3943
Prognostic value of quantitative dynamic contrast-enhanced magnetic resonance imaging and texture analysis for nasopharyngeal carcinoma1Department of Radiology, West China Hospital, Chengdu, China, 2Department of Radiology, Affiliated Cancer Hospital of Xiangya School of Medicine, Changsha, China
Synopsis
Although several studies have demonstrated that DCE-MRI is helpful in predicting the short-term therapeutic response for NPC, the relationship between the quantitative parameters and texture features (based on DCE-MRI and T2WI) and the prognosis of NPC is unclear. The present work is the first study to explore the performance of quantitative DCE-MRI and texture analysis in predicting the long-term outcome of NPC. Our data revealed that baseline quantitative DCE-MRI parameters and texture features might serve as predictors for the prognosis of NPC. These findings provide new insights to help optimize individual treatment regimen and improve the clinical outcome for patients.
Nasopharyngeal carcinoma (NPC) is a common malignant tumor in South China and southeast Asia(1), for which definitive radiotherapy and concurrent chemoradiotherapy are the prior treatment(2,3). Accurate staging before treatment or prediction of disease risk and timely evaluation of efficacy after treatment are imperative for personalized treatment programs, thus helping to improve clinical outcome and survival rate. Quantitative dynamic contrastenhanced magnetic resonance imaging (DCE-MRI) is a functional MRI technique that can directly provide imaging markers to evaluate tumor vascularity, oxygenation, and perfusion information of tissues (4). It is well known that these factors are closely associated with curative effect of malignant tumors (4,5). Consequently, quantitative DCE-MRI has become increasingly useful for predicting the short- and/or long-term outcome of malignant tumors at different sites(6-8). As for NPC, quantitative DCE-MRI was reportedly feasible to distinguish the early response to neoadjuvant chemotherapy and chemoradiotherapy (4). However, to the best of our knowledge, few reports evaluated the utility of quantitative DCE-MRI and texture analysis in predicting the long-term outcome of NPC. Therefore, the purpose of this study is to explore whether the pretreatment quantitative DCE-MRI parameters and texture features derived from the primary lesion of NPC can help to predict its prognosis.
The relationships between the prognosis and pretreatment quantitative DCE-MRI (Ktrans, Kep, Ve and fpv) values plus the texture features derived from T2WI and the four quantitative DCE-MRI maps of the primary tumors were retrospectively analyzed in 113 NPC patients receiving chemoradiotherapy. Receiver-operating characteristic (ROC) curve were done to determine the cut-off value (the maximal conditional Youden score) of the pretreatment quantitative DCE-MRI values and texture feature values. Kaplan-Meier analysis was performed to calculate the local-regional relapse-free survival (LRRFS), local relapse-free survival (LRFS), regional relapse-free survival (RRFS), distant metastasis-free survival (DMFS), progression-free survival (PFS) and overall survival (OS) rates. Cox proportional hazards model was used to explore the independent predictors for prognosis.
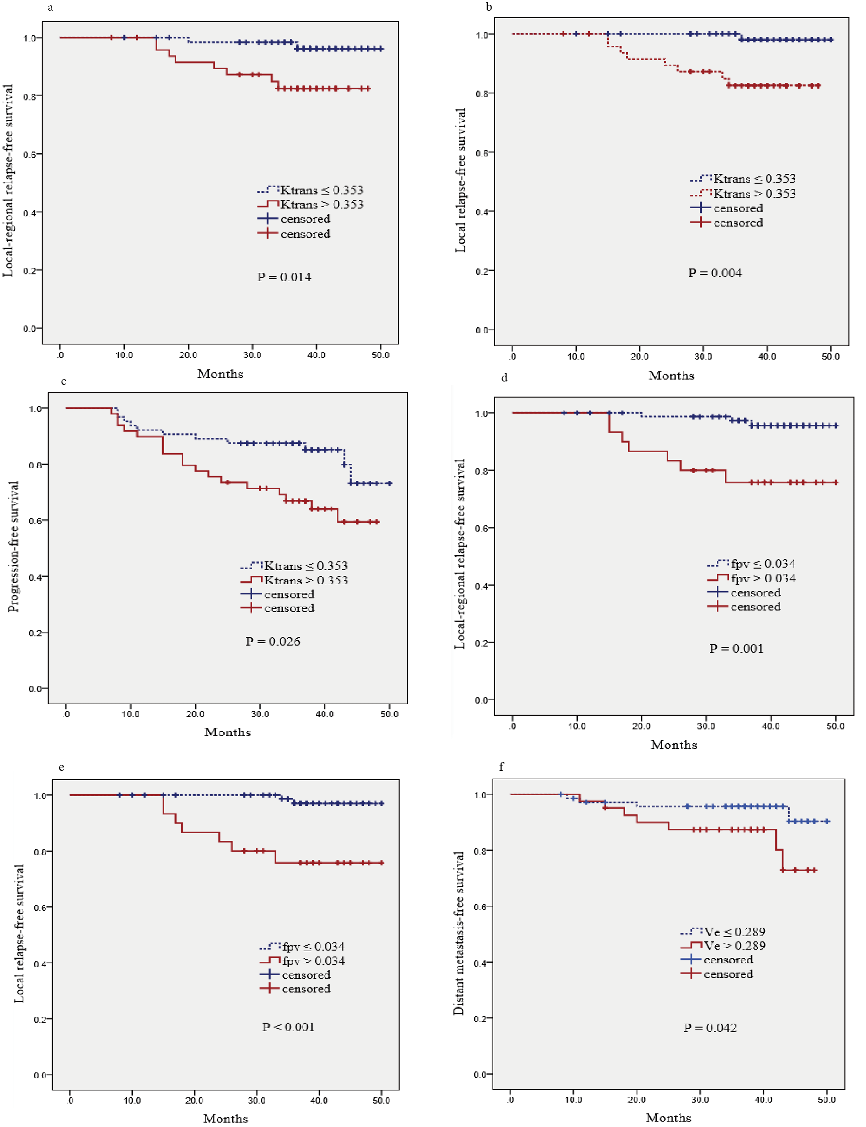
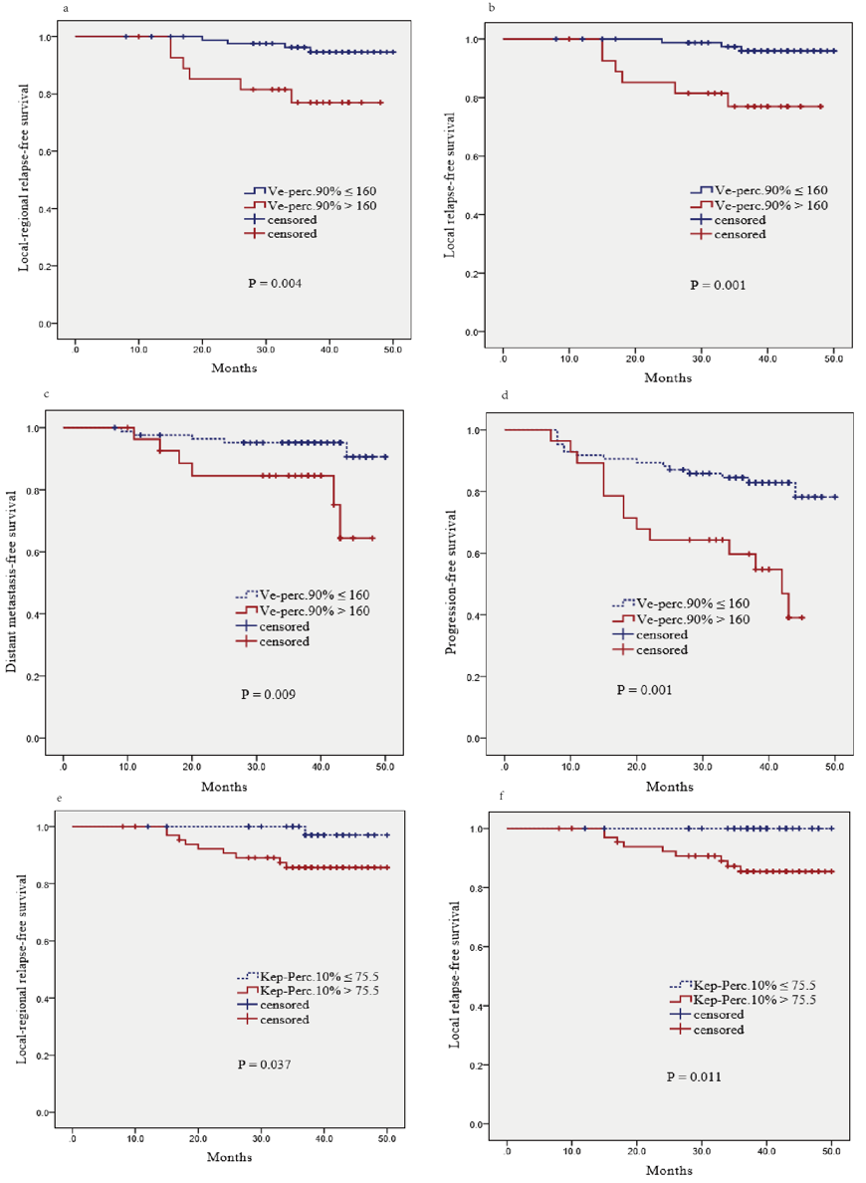
The local-failure group had significantly higher Ktrans(P = 0.029)、fpv(P = 0.003)、Ve (P = 0.017) 、Kep-Perc.10% (P = 0.024) and Ve-Perc.90% values (P = 0.018) than the non-local-failure group.The Ktrans-high group showed significantly lower LRRFS(P = 0.014), LRFS(P = 0.004) and PFS(P = 0.026) rates than the Ktrans-low group.The fpv-high group exhibited significantly lower LRRFS (P = 0.001) and LRFS (P < 0.001) rates than the fpv-low group. The Ve-high group showed obviously lower DMFS (P = 0.042) rate than the Ve-low group. The Kep-Perc.10%-high group demonstrated significantly lower LRRFS (P = 0.037) and LRFS (P = 0.011) rates than the Kep-Perc.10%-low group. The Ve-Perc.90%-high group exhibited markedly lower LRRFS (P = 0.004), LRFS (P = 0.001), DMFS (P = 0.009) and PFS (P = 0.026) rates than the Ve-Perc.90%-low group. fpv was the independent predictor for LRRFS (P = 0.007) and LRFS (P = 0.011); age and N stage were independent indicators for DMFS (P = 0.008 and 0.014, respectively); Ktrans and Ve-Perc.90% were the independent predictors for PFS (P = 0.041 and 0.032, respectively ); Ve and T stage were the independent indicators for OS (P = 0.011 and 0.023, respectively) .
This study focuses on the potential of quantitative DCE - MRI parameters (Ktrans, Kep, fpv, ve) and texture analysis based on DCE-MRI and T2WI(Skewness, Kurtosis, Perc1%, Perc10%, Perc50%, Perc90% and Perc99%) in the prediction of long-term efficacy in NPC after chemoradiation. The main findings of our study were as follows: 1) pretreatment quantitative DCE-MRI parameters Ktrans, fpv and Ve may help to predict the long-term outcome after treatment for nasopharyngeal carcinoma. 2) The texture features of quantitative DCE-MRI parameters before treatment (Kep-perc.10% and Ve-perc.90%) may be predictors of the long-term efficacy of NPC. 3) The texture features based on T2WI didn’t show significant relationship with the prognosis of NPC. These results demonstrate that the pretreatment primary lesion quantitative DCE-MRI and texture analysis based on DCE-MRI can provide valuable informations in predicting prognosis for NPC. In addition, the data indicated that functional MRI is better than morphological MRI in predicting the prognosis of NPC.
Baseline quantitative DCE-MRI parameters (Ktrans , fpv and Ve) and texture features (Kep-Perc.10% and Ve-Perc.90%) derived from DCE-MRI maps may be valuable in predicting the prognosis for NPC.
Acknowledgements
This study was supported by the Provincial Key Clinical Specialty (Medical Imaging) Development Program from Health and Family Planning Commission of Hunan Province, China (contract grant number: 2015/43), and by the Guidance Program for Clinical Technique Innovation from China Hunan Provincial Science & Technology Department (project number: 2017SK50601).References
1. Parkin DM, Bray F, Ferlay J. Global cancer statistics, 2002. CA Cancer J Clin 2005; 55:74–108.
2. Lee AW, Lin JC, Ng WT. Current management of nasopharyngeal cancer. Semin Radiat Oncol 2012; 22:233–244.
3. Pfister DG, Spencer S, Brizel DM, et al. Head and neck cancers, version 1.2015. J Natl Compr Cancer Netw 2015; 13:847–855.
4. Zheng D, Chen Y, Liu X, et al. Early response to chemoradiotherapy for nasopharyngeal carcinoma treatment: value of dynamic contrastenhanced 3.0 T MRI. J Magn Reson Imaging 2015; 41:1528–1540.
5. Hou J, Yu X, Hu Y, et al. Value of intravoxel incoherent motion and dynamic contrast-enhanced MRI for predicting the early and short-term responses to chemoradiotherapy in nasopharyngeal carcinoma. Medicine (Baltimore) 2016; 95:e4320.
6. Joo I, Lee JM, Han JK, et al. Dynamic contrast-enhanced MRI of gastric cancer: correlation of the perfusion parameters with pathological prognostic factors. J Magn Reson Imaging 2015; 41:1608–1614.
7. Chung MP, Margolis D, Mesko S, et al. Correlation of quantitative diffusion-weighted and dynamic contrast-enhanced MRI parameters with prognostic factors in prostate cancer. J Med Imaging Radiat Oncol 2014; 58:588–594.
8. Kim S, Loevner LA, Quon H, et al. Prediction of response to chemoradiation therapy in squamous cell carcinomas of the head and neck using dynamic contrast-enhanced MR imaging. AJNR Am J Neuroradiol 2010;31:262–268.
Figures