3941
The Value of Apparent Diffusion Coefficient Gray Histogram in the Differential Diagnosis of Central Nervous System Lymphoma1The Third Affiliated Hospital of Zhengzhou University, Zhengzhou City, China, 2GE Healthcare, MR Research China,, Beijing, China, 3GE Healthcare, MR Research China, Beijing, China
Synopsis
Retrospective analysis of patients with brain MRI examination and confirmed by pathology, respectively in three groups of MR ADC axial images, using Mazda software to delineate the region of interest at each level of the tumor, and carry out gray-scale global histogram analysis, and statistical analysis of the three groups of histogram parameter characteristics.The nine parameters, mean, variance, kurtosis, skewness, perc. 01%, perc. 10%, perc. 50%, perc. 90% and perc. 99% were obtained by gray histogram analysis (P < 0.05).
Abstract
Introduction: Primary central nervous system lymphoma(PCNSL), Glioblastoma multiform(GBM) and Solitary brain metastasis(SMT) are three common intracranial malignant tumors. Routine MRI, such as T1WI,T2WI,enhanced T1WI, can be used to differentiate these tumors. However, there is an overlap of imaging manifestations among the three tumors. For example, irregular, uniform or heterogeneous ring enhancement as well as relatively low-intensity enhancement in the central necrotic zone are shown on enhanced MRI. All the factors cause difficulties for conventional MRI in differentiation of PCNSL, GBM and MET. Global gray histogram,as a quantitative analysis of tumors’ global features, have been introduced in recent years, and demonstrated higher accuracy for the differential diagnosis of tumors[Example 1]. As it can reflect the overall data of each slice of the lesion area, and can better avoid sampling errors due to the delineation of the ROI of the local area [Example 2]. It may be more reliable and accurate for the identification of these three tumors. In this study, we explore the ability of global gray histogram analysis of ADC map to differentiate the PCNSL, GBM and SMT.Material and methods: This was a retrospective analysis in our hospital of brain MRI examinations in 95 pathologically-confirmed patients, including 38 patients with central nervous system lymphoma (19 males, 21 females; average age 57.1 ± 12.5, range 33 to 81 years), 29 patients with glioblastoma (13 males, 17 males, mean age 51.2 ± 14.5, range 10 to 69 years old), and 28 patients with solitary metastases (15 males, 13 females, average age 59.8, range 36 to 76 years). The ROI of each layer was manually outlined along the edge of the whole tumor in ADC image using Mazda software. (Fig.1)The gray histogram of the ROI was generated automatically. Variance, mean, skewness, kurtosis, the 100th quantile (Perc.01%), tenth percentile (Perc.10%), fiftieth percentile (Perc.50%), ninetieth percentile (Perc.90%) and ninety-ninth percentile (99%) were obtained using gray histogram analysis. One-way analysis of variance (ANOVA) or Kruskal-Wallis test was applied for all the quantitative indexes after the normality and homogeneity of variance test. The diagnostic efficiency of the parameters with statistical difference among the three tumors was analyzed by using Receiver operating characteristic (ROC) analysis. (Fig.2)ROC curves were generated using Medcalc software and the optimal cutoff for differentiating the three kinds of tumors were determined. AUCs, sensitivity and specificity were also calculated.
Results: The differences among mean, variance, skewness, kurtosis, Perc.01%, Perc.10%, Perc.50%, Perc.90% and Perc.99% were all found with statistically significant differences among the three tumors. Mean, skewness and Perc.50% showed the value of differential diagnosis between the two comparisons of the three tumors, especially in the identification of GBM and PCNSL, where the AUC values were 0.89, 0.75 and 0.90, respectively, the sensitivities were 84.21%, 94.74%, and 84.21%, respectively, and the specificities were 82.76%, 51.72%, and 86.21%, respectively. (Fig.3)
Discussion: The study demonstrated that ADC gray histogram analysis could be well used for the differentiation of malignant intracranial tumors PCNSL, GBM and SMT. As a novel auxiliary diagnostic method, it is more conducive to selection of clinical treatment and prognosis.
Acknowledgements
Thanks to president Zhao Xin and Ge engineers's support.References
Example 1:1. Ahn SJ, Choi SH, Kim YJ, et al. Histogram analysis of apparent diffusion coefficient map of standard and high B-value diffusion MR imaging in head and neck squamous cell carcinoma: a correlation study with histological grade. Acad Radiol. 2012 Oct;19(10):1233-40. doi: 10.1016/j.acra.2012.04.019. Example 2:2. Liu Yang-ying-qiu, SHANG Jin, TIAN Shi-yun, et al. Whole tumor volume-based histogram analysis of ADC signal intensity for differentiating between WHO grade II and III glioma. Chin J Magn Reson Imaging, 2017,8(4):276-282.doi: 10.12015/issn.1674-8034.2017.04.008Figures
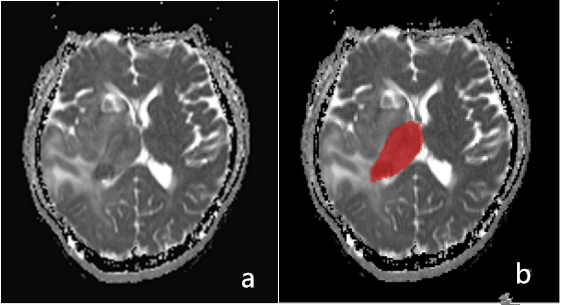
Fig.1 Axial original image of ADC in central nervous system lymphoma. Axial-labeled ADC images of central nervous system lymphoma
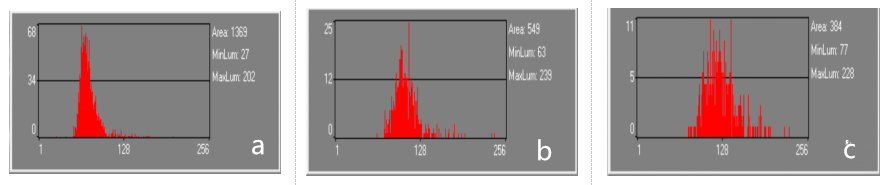
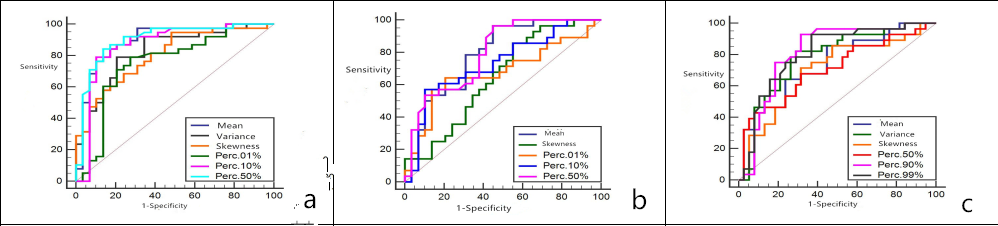
Fig. 3 A ROC curve was made based on the six most statistically significant parameters for differentiating glioblastoma and CNS lymphoma.
An ROC curve was made based on the six most statistically significant parameters for differentiating glioblastoma and metastatic tumors.
An ROC curve was made based on the six most statistically significant parameters for differentiating CNS lymphoma and metastatic tumors.