3937
Can texture analysis of T2WI be used to predict extrathyroidal extension in papillary thyroid carcinoma?1Department of Radiology, Affiliated Hospital, Jiangnan University, Wuxi, China, 2GE Healthcare, MR Research, Bejing, China
Synopsis
76 patients with pathologically confirmed papillary thyroid carcinoma (PTC) underwent preoperative thyroid T2-weighted (T2WI) MRI examination in this retrospective study. Using texture analysis for acquired T2WI imaging, entropy was found significantly higher in PTC patients with extrathyroidal extension (ETE) than without ETE, and thus considered an independent index for predicting PTC patients with ETE. With this finding, we therefore consider that preoperative T2WI-based texture features may be valuable for identifying ETE status in PTC patients and may help customize treatment strategies.
Introduction
The prevalence of papillary thyroid cancer (PTC), as a major subtype of well-differentiated thyroid cancer, has been steadily rising in recent years 1. Although PTC has a slow growth and low mortality, some aggressive treatments such as extrathyroidal extension (ETE) are associated with poor outcomes 2. Due to the non-invasiveness, superior spatial resolution and good soft tissue contrast, magnetic resonance imaging (MRI) is increasingly used for preoperative assessment of PTC. However, the ability of MRI in discriminating ETE is limited because the available evaluation criteria are primarily based on the morphological and anatomical details. Texture analysis is a method for extracting quantitative features from medical images and can be used to detect pathological changes that cannot be perceived by human visional evaluation 3. Previous studies also showed its reliability in differentiating thyroid malignant nodules from benign as well as comparing negative and positive lymph nodal in PTC4,5. However, to our knowledge, no published study has been performed to investigate if T2-weighted imaging(T2WI) texture features are possible for predicting the extent of ETE in PTC. Therefore, the main goal in this study was to investigate if preoperative T2WI derived histogram and gray-level co-occurrence matrix (GLCM) texture features are feasible in predicting the existence of ETE in PTC patients.Materials and Methods
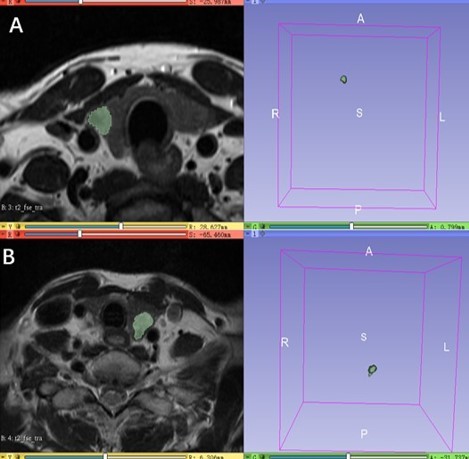
A total of 76 patients (mean age 46.11±11.68 years, 63.2% female) with PTC confirmed by pathology in our hospital were enrolled in this study and underwent MRI examinations preoperatively. Each patient also underwent ipsilateral lobectomy or total thyroidectomy. Tissue samplings were collected from lesions during surgery served as a gold standard for histopathological reference and assessment of ETE status. All MRI experiments were performed on 1.5 Tesla MR scanner (GE Signa HD 1.5 T MR scanner; GE Healthcare Systems, Milwaukee, WI, USA) with an eight-channel high-resolution receiver synergy-head/neck phased-array coil. MRI protocols included transverse T1WI, transverse T2WI, diffusion weighted imaging (DWI) and contrast-enhanced MRI. For transverse T2WI scanning, the scan parameters were as follows: repetition time (TR)/echo time (TE), 3500/95ms; matrix size, 128 × 128; field of view (FOV), 140 × 140 mm2; slice thickness, 3 mm; spacing between slices, 1mm. A total scan time was 30 minutes. Texture analysis was performed independently on axial T2WI using 3D slicer (Version V4.10.0) by two senior radiologists blinded to the pathological results. Regions of interest (ROIs) covering the whole tumor were manually delineated along the tumor contour on each section, excluding obvious necrosis and cystic areas (Fig 1). 9 histogram and GLCM texture features were automatically extracted. All statistical analyses were performed in SPSS 17.0 software. Categorical variables were compared between groups using the chi-square test. Comparisons of age, maximum diameter of tumor and texture parameters in different patient groups were performed using the independent-samples t-test or Mann-Whitney U test depending on distribution normality or non-normality, respectively. Spearman correlation analysis was applied to assess the correlation between texture parameters and ETE. Subsequently, multivariate binary logistic regression analysis was performed to identify independent predictors for ETE. Interobserver agreement was evaluated using the intraclass correlation coefficient (ICC). Receiver operating characteristic (ROC) curves were generated to assess the diagnostic performance of the texture parameters in predicting ETE status by calculating the area under the ROC curve (AUC). P< 0.05 was considered statistical significance.Results
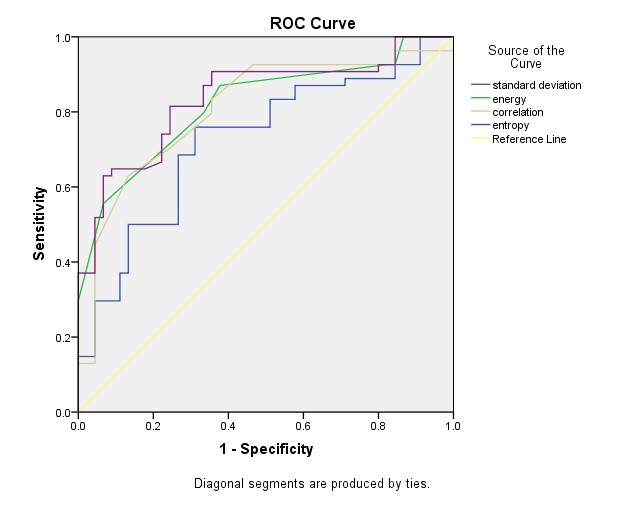
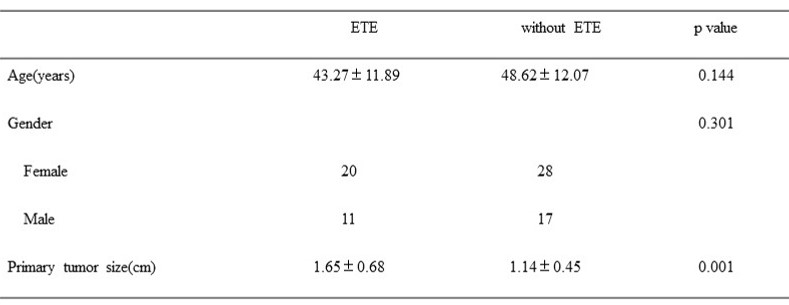
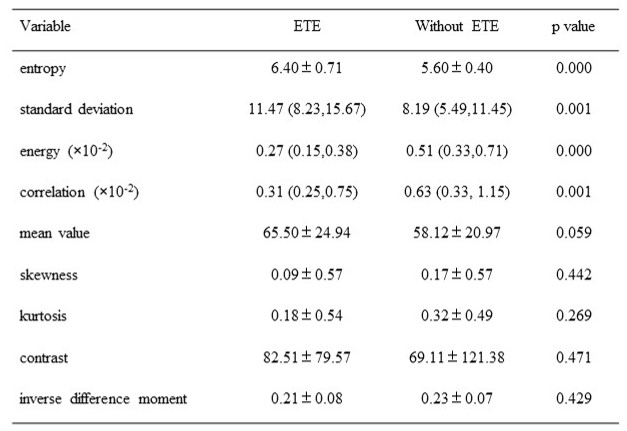
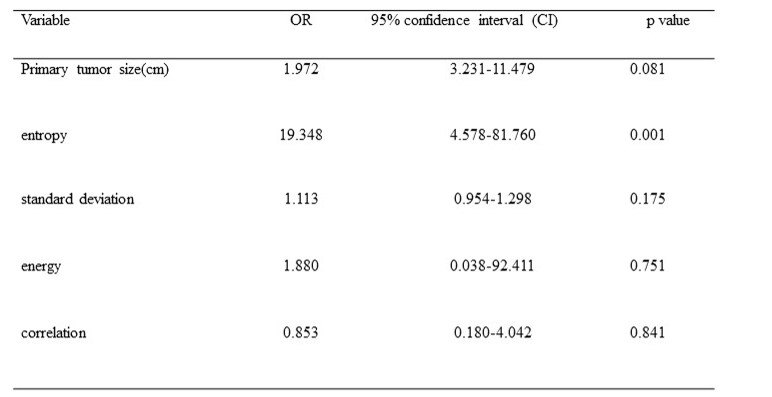
Clinicopathological features of total 76 patients with and without ETE were included in our study (Table 1). The histogram and GLCM parameters between both groups were shown in Table 2. Significantly lower energy and correlation as well as higher entropy and standard deviation were found in PTC patients with ETE than without ETE group (Table 2). Interobserver agreement between both radiologists were excellent for all texture features derived from separately delineated ROIs. The ICC’s range was 0.78-0.89. The logistic regression analysis demonstrated that high entropy was an independent risk factor of ETE (odds ratio, OR = 19.348; 95%CI, 4.578-81.760; p= 0.001; Table 3). Using ROC analysis, the entropy showed moderate to good diagnostic power with a cutoff value > 5.86 (AUC = 0.837, 95%CI, 0.764–0.910) in predicting ETE, yielding sensitivities of 81.5% and specificities of 75.6% (Fig 2).Discussion and Conclusions
This study performed texture analysis of primary tumors on preoperative transverse T2WI and then investigated the correlation between texture features and the ETE state in PTC. As shown in the results, entropy, energy, standard deviation and correlation extracted from histogram and GLCM differed significantly between patients with ETE and without ETE. Multivariate analysis showed that entropy was an independent risk factor of ETE with an OR of 19.348. Entropy represents the randomness or heterogeneity of the pixel distribution, and thus high entropy distinguishes hidden microcosmic heterogeneity in PTC patients with ETE from those without ETE. In conclusions, texture features extracted from T2WI might be considered potential valuable imaging biomarkers in predicting the ETE state of PTC.Acknowledgements
This study was supported in part by a grant-in-aid for scientific research from the Technology Plan of Jiangsu (Project No. H2019087), the Technology Plan of Wuxi (Project No. MS201901) and the Science and Technology Development Plan of Wuxi (Project No. N20192027).References
1. Siegel RL, Miller KD, Jemal A. Cancer statistics, 2020. CA Cancer J Clin 2020; 70(1): 7-30.
2. Haugen BR, Alexander EK, Bible KC, et al. 2015 American Thyroid Association Management Guidelines for Adult Patients with Thyroid Nodules and Differentiated Thyroid Cancer: The American Thyroid Association Guidelines Task Force on Thyroid Nodules and Differentiated Thyroid Cancer. Thyroid 2016; 26(1): 1-133.
3. Yang L, Liu D, Fang X, et al. Rectal cancer: can T2WI histogram of the primary tumor help predict the existence of lymph node metastasis? European radiology 2019; 29(12): 6469-76.
4. Schob S, Meyer HJ, Dieckow J, et al. Histogram Analysis of Diffusion Weighted Imaging at 3T is Useful for Prediction of Lymphatic Metastatic Spread, Proliferative Activity, and Cellularity in Thyroid Cancer. Int J Mol Sci 2017; 18(4).
5. Hao Y, Pan C, Chen W, Li T, Zhu W, Qi J. Differentiation between malignant and benign thyroid nodules and stratification of papillary thyroid cancer with aggressive histological features: Whole-lesion diffusion-weighted imaging histogram analysis. Journal of magnetic resonance imaging : JMRI 2016; 44(6): 1546-55.
Figures