3932
Multiparametric Physiologic MR Imaging of Head and Neck Cancer: Imaging Biomarker for Tumor Hypoxia and Heterogeneity1Department of Radiology and Imaging Sciences, University of Utah, Salt Lake City, UT, United States, 2UCAIR, Department of Radiology and Imaging Sciences, University of Utah, Salt Lake City, UT, United States, 3Radiation oncology, University of Utah, Salt Lake City, UT, United States
Synopsis
This prospective, single-arm, cohort patients study with a newly diagnosed head&neck cancer aims to demonstrate the feasibility of multiparametric MRI to reveal tumor hypoxia and treatment failure. Although tumor hypoxia is a critical physiologic feature related to treatment resistance and poor outcomes, effective imaging technology to detect the area of hypoxia in an individual patient is lacking. Incorporating multiparametric maps into cross-sectional imaging is critically essential for translating imaging information to radiation dose paining. We generated the composite color map incorporating oxygen-enhanced BOLD, ADC, and FDG-PET and correlated it with CRT response at 3 months, as a proof of concept.
INTRODUCTION
Globally, head and neck cancer (HNC) accounts for approximately 550,000 cases annually[1]. Despite recent advancements in chemoradiotherapy (CRT), 25-30% of patients failed to respond to CRT[2]. Tumor hypoxia is considered one of the physiological factors for such treatment resistance and likely contributes to a higher recurrence rate and decreased overall survival[3]. Identifying hypoxic features of HNC may allow modification of the treatment plan.This prospective cohort study used multiparametric physiologic (MPP) MR imaging and correlated MPP MRI with pre-treatment FDG-PET imaging and treatment response assessed by 3 months FDG-PET. Image analysis approach was developed to incorporate FDG-PET, ADC, and oxygen-enhanced BOLD imaging in color-coded map to facilitate visualization of multiparametric information.METHODS
In this prospective pilot study, 8 patients with newly diagnosed HNC were recruited. All patients provided written consent. Patients underwent MPP MR imaging on a Siemens Prisma 3T MRI scanner with 20 channel head and neck coil. MPP MR imaging includes oxygen-enhanced BOLD MRI and DWI imaging. R2* of blood decreases with O2 saturation. It is expected that normoxic tumor regions show a reduction of R2*, whereas hypoxic tumor regions show stable or increased R2* in oxygen-enhanced BOLD[4].DWI was acquired to calculate ADC map, which reflects cellular density. The detailed scan protocol is summarized in Table 1. FDG-PET/CT was performed before and 3 months after CRT as a part of the standard care to plan CRT and access CRT response. R2* values were computed from BOLD measurements using a bounded non-linear least-squares fit to the model in equation presented as S(TEi) = M0*Exp(-TEi*R2*), where S(TEi) is the image signal at ith echo time, TEi [5]. The model was solved in Python using the SciPy curve fit package employing the Trust Region Reflective algorithm. Primary tumor and lymph node metastases were manually traced on T2w images. For comparison between the MR and PET images, a program was written in Python to perform manual rigid translations and rotations of the PET data to align it with the MR images and resample on the coordinate framework of the MR images. 1D and 2D histograms of all pixels from a primary tumor and lymph node metastases were generated for ΔR2*, ADC, and FDG-PET. ΔR2* was computed as follows; ΔR2* = R2*(O2) - R2*(pre-O2).RESULTS
Three patients (subject 1, 2, and 5) were excluded from analysis due to the following reasons; inability to complete MR, severe artifacts from dental hardware, and incompatibility of FDG-PET imaging dataset. The remainder of 5 subjects was analyzed, including 5 primary tumors and 3 cervical lymph node metastases. Figure 1 shows one-dimensional histograms for (a) ΔR2*, (b) ADC, and (c) FDG-PET with colors indicating the contribution of the subjects shows very little difference in ΔR2*. ADC and PET values revealed a wide range of variations in subject 6, which showed early recurrence and cancer-related death. A pooled 2D scatter histogram (Fig 2) comparing the combination of three parameters shows a larger standard deviation (length of vertical and horizontal bars) and positive ΔR2* among a patient with recurrence (subject 6.) Pearson correlation coefficients were computed comparing each tumor physiology metrics shows a mild negative correlation between FDG-PET vs. ADC, though the difference was not statistically significant (Table 2). A composite multiparametric color map was created incorporating ΔR2* (red), ADC (green), and PET (blue) values for two patient (Fig3). The red channel scales as max(|ΔR2*|) - |ΔR2*|, where the magnitude of ΔR2* is used. Thus, regions with no R2* change show as bright red. Similarly, the green channel scales as max(ADC) – ADC so that bright green indicates small to zero ADC. Tumor with green area indicates low ADC value with non-zero ΔR2* and low FDG-PET activity, whereas tumor with pink-magenta area indicates near-zero ΔR2* and higher FDG-PET activity, suggestive of hypoxia features.DISCUSSION
Although tumor hypoxia is a critical physiologic feature related to treatment resistance and poor outcomes, effective imaging technology to visualize the area of hypoxia in an individual patient is lacking. With inhalation of 100% oxygen, BOLD may detect a small change in R2* where oxygen is delivered. MPP MR imaging has the potential to reveal the spatial distribution of the area of hypoxia within a tumor. Larger variations of ΔR2* and ADC within a tumor suggests underlying tumor heterogeneity. The limitation of the current BOLD technique is low SNR, highly susceptible to magnetic susceptibility in the head and neck and patient motion. 3D acquisition and advanced shimming technique may provide the improved BOLD measurement. A more accurate measurement of T2* by using BOLD could be corrected from T2 relaxation effect [6]. While BOLD imaging provides an indication of tumor blood oxygenation, it is also sensitive to local hematocrit, vascular volume, pH, flow, and vessel density. Additional DCE measurement can provide the tissue perfusion information and better quantification of tissue hypoxia.CONCLUSION
Although the study is preliminary, multiparametric MR imaging with oxygen-enhanced BOLD and DWI has the potential to serve as a surrogate of non-invasive imaging of tumor hypoxia and predict treatment failure.Acknowledgements
The study was funded by the National Center for Advancing Translational Sciences of the National Institutes of Health Pilot grant under Award Number 1UL1TR002538.References
1. Head and Neck Cancer: Statistics | Cancer.Net [Internet]: https://www.cancer.net/cancer-types/head-and-neck-cancer/statistics.
2. Nordsmark M, Bentzen SM, Rudat V, et al. Prognostic value of tumor oxygenation in 397 head and neck tumors after primary radiation therapy. An international multi-center study. Radiother Oncol; 2005;77:18–24.
3. Brizel DM, Sibley GS, Prosnitz LR, Scher RL, Dewhirst MW. Tumor hypoxia adversely affects the prognosis of carcinoma of the head and neck. Int J Radiat Oncol Biol Phys;1997;38:285–9.
4. Baudelet C, Gallez B. How does blood oxygen level-dependent (BOLD) contrast correlate with oxygen partial pressure (pO2) inside tumors? Magn Reson Med; 2002;48:980–6.
5. Panek R, Welsh L, Dunlop A, Wong KH, Riddell AM, Koh DM, et al. Repeatability and sensitivity of T2* measurements in patients with head and neck squamous cell carcinoma at 3T. J Magn Reson Imaging; 2016;44:72–80.
6. Rodrigues LM, Howe FA, Griffiths JR, Robinson SP. Tumor R2* is a prognostic indicator of acute radiotherapeutic response in rodent tumors. J Magn Reson Imaging; 2004;19:482–8.
Figures
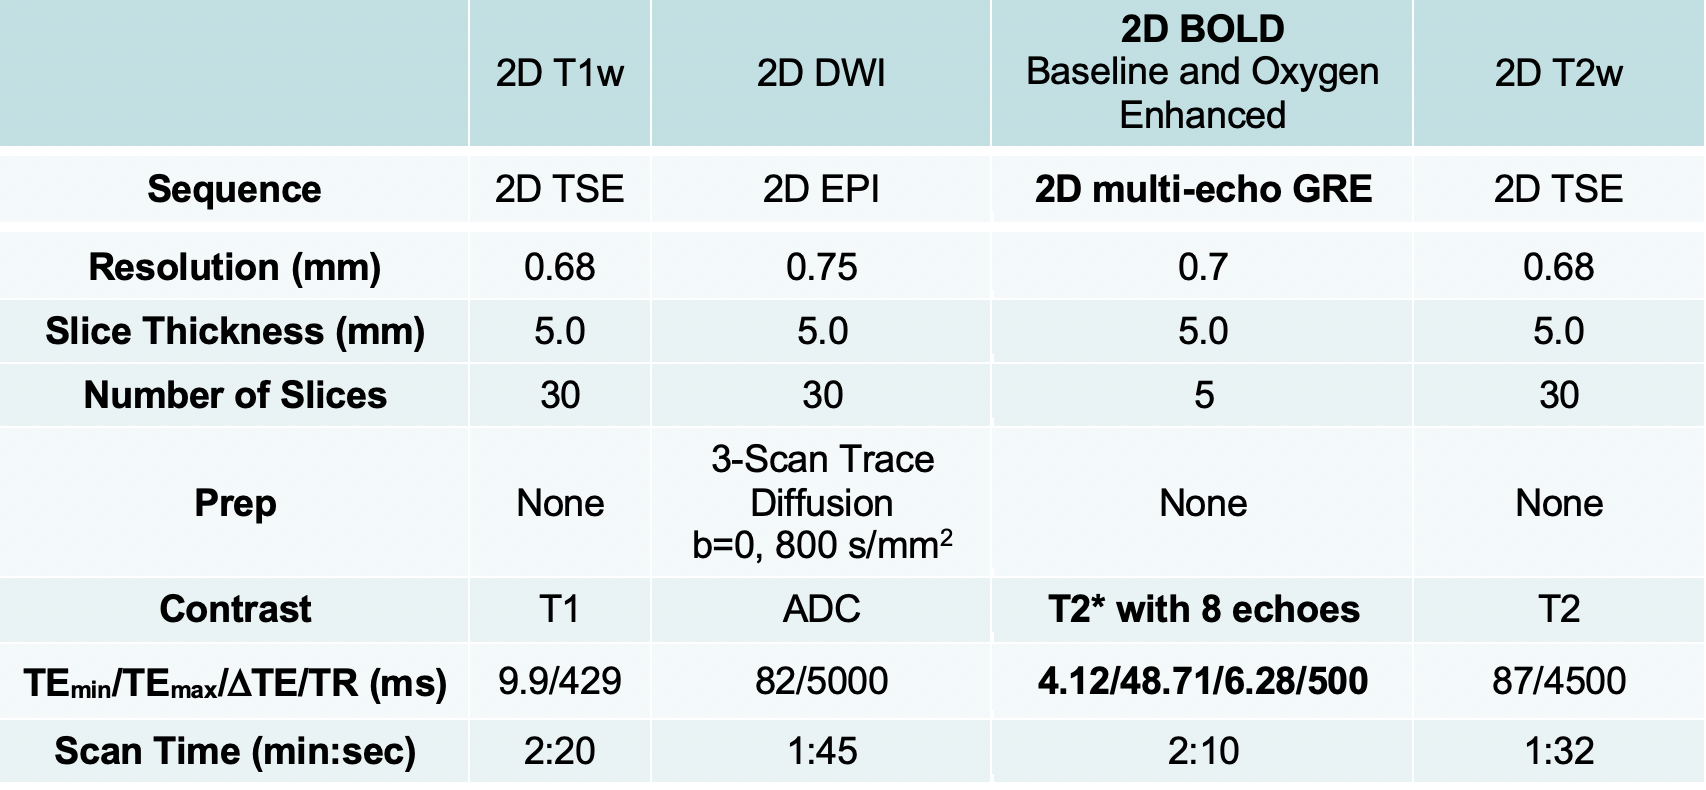
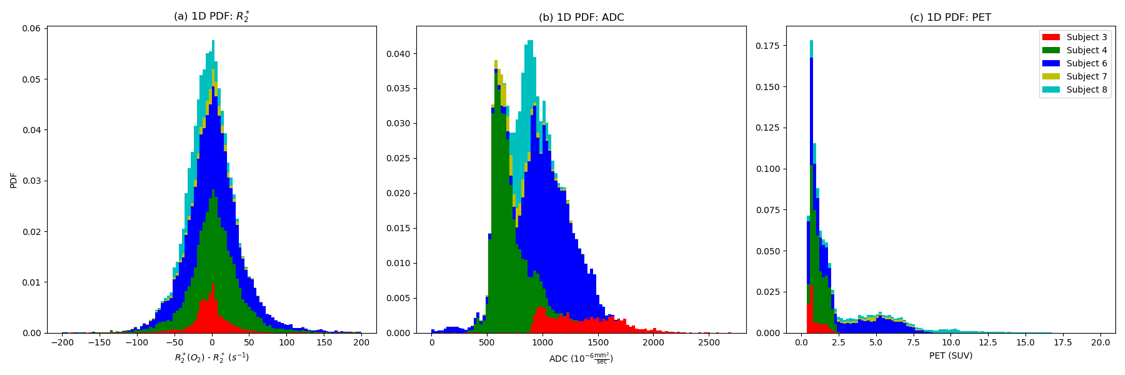
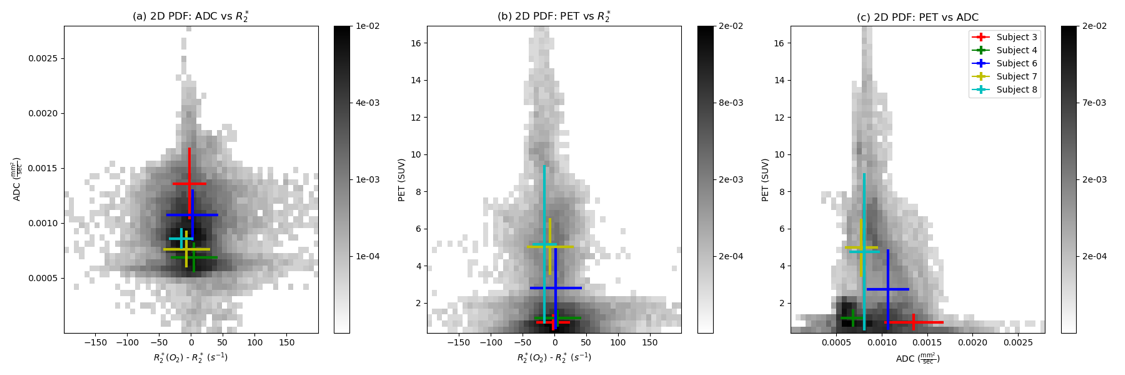

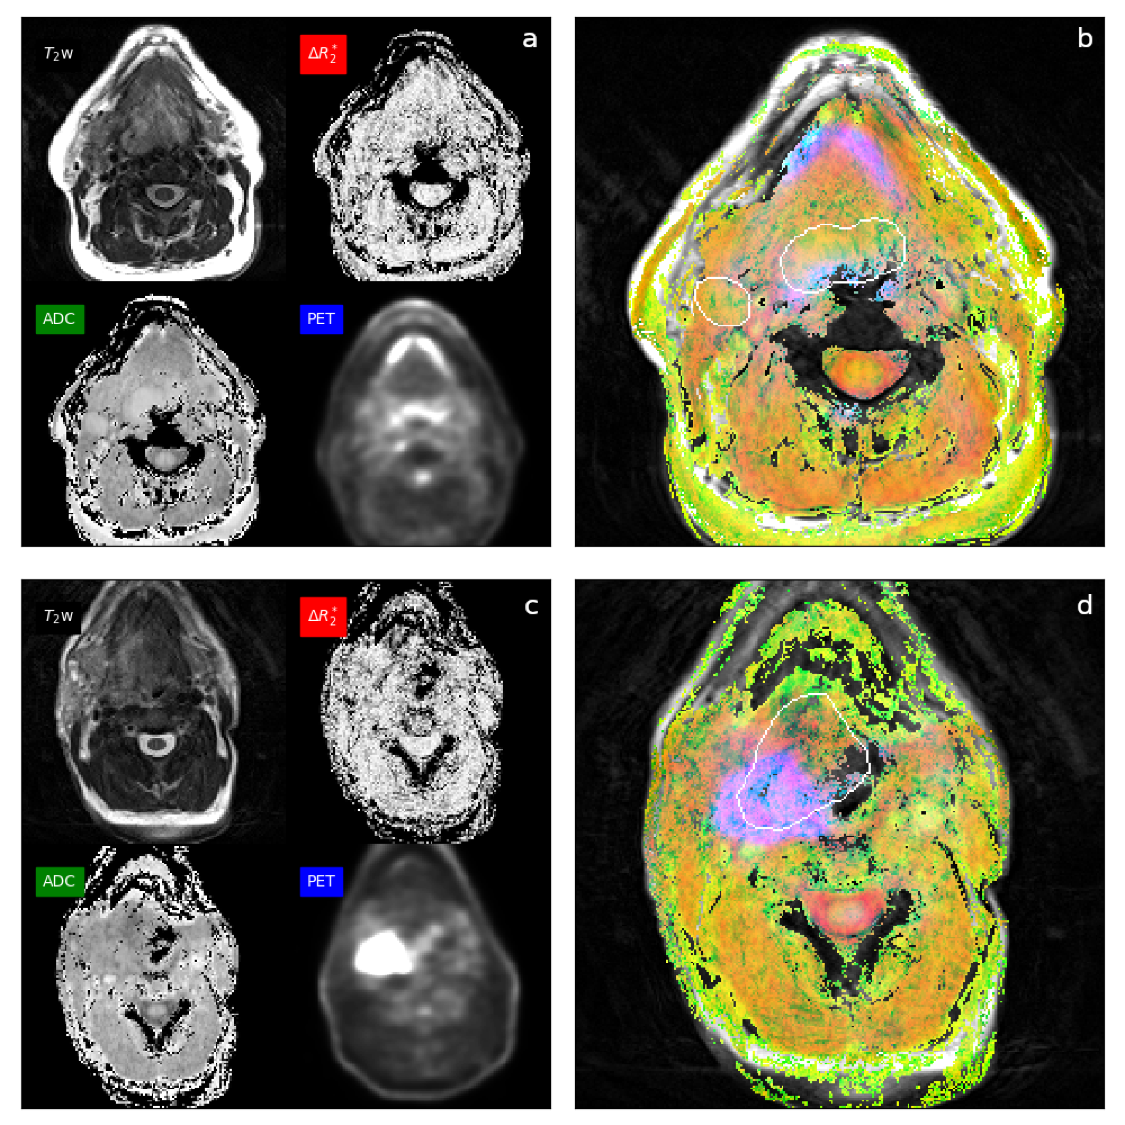
Fig 3. The color map of the patient (a, b) shows a green color of the base of tongue tumor and right lymph node metastases suggestive of low ADC value with non-zero ΔR2*, oxygenated tumor. The color map of another patient (c, d) of right tonsillar carcinoma shows pink-magenta color posteriorly, suggestive of near-zero ΔR2* and high PET activity, features of hypoxic tumor. This patient had early recurrence and disease-related mortality