3927
The visualization of the saccule and utricle with non-contrast-enhanced FLAIR sequence.1Institut de Bio-imagerie IBIO, Université de Bordeaux, Bordeaux, France, 2CHU de Bordeaux, Neuroimagerie diagnostique et thérapeutique, Bordeaux, France, 3Canon Medical Systems Europe, Zoetermeer, Netherlands, 4Canon Medical Systems China, Beijing, China, 5Canon Medical Systems Corporation, Tochigi, Japan
Synopsis
Delayed post-gadolinium FLAIR can delineate peri- and endo-lymphatic spaces to capture endolymphatic hydrops, the pathological counterpart of Ménière’s disease. However, the four hours delay between injection and acquisition is a burden for patients and staff. No previous work has proposed a satisfying delineation of inner ear internal anatomy without injection yet. This study presents step-by-step 3D-FLAIR optimizations with specific T2 preparation and inversion time to maximize the contrast between peri- and endo-lymphatic spaces. We showed that optimized 3D-FLAIR sequence allowed delineating saccule and utricle in healthy volunteers without injection, paving the way toward future application to diagnose Meniere disease.
Introduction
Ménière’s disease is a chronic condition characterized by fluctuating hearing loss, intermittent vertigo, tinnitus, and aural fullness. Its pathological counterpart is represented by endolymphatic hydrops (EH) that can be captured with delayed 3D-FLAIR post gadolinium injection to delineate peri- (PLS) and endo-lymphatic space (ELS). No one has ever represented a good delineation of these structures without contrast media. However, there is a 7.2-fold difference in the concentration of proteins between PLS and ELS1, which might allow differentiating these structures without injection. Outside the context of the inner ear, combining T2Prep and inversion recovery pulse is used to enhance the contrast between the gray and white matter2. Together, we hypothesized that non-contrast 3D-FLAIR with specific T2Prep and inversion time could enhance the contrast to delineate PLS and ELS.Materials and Methods
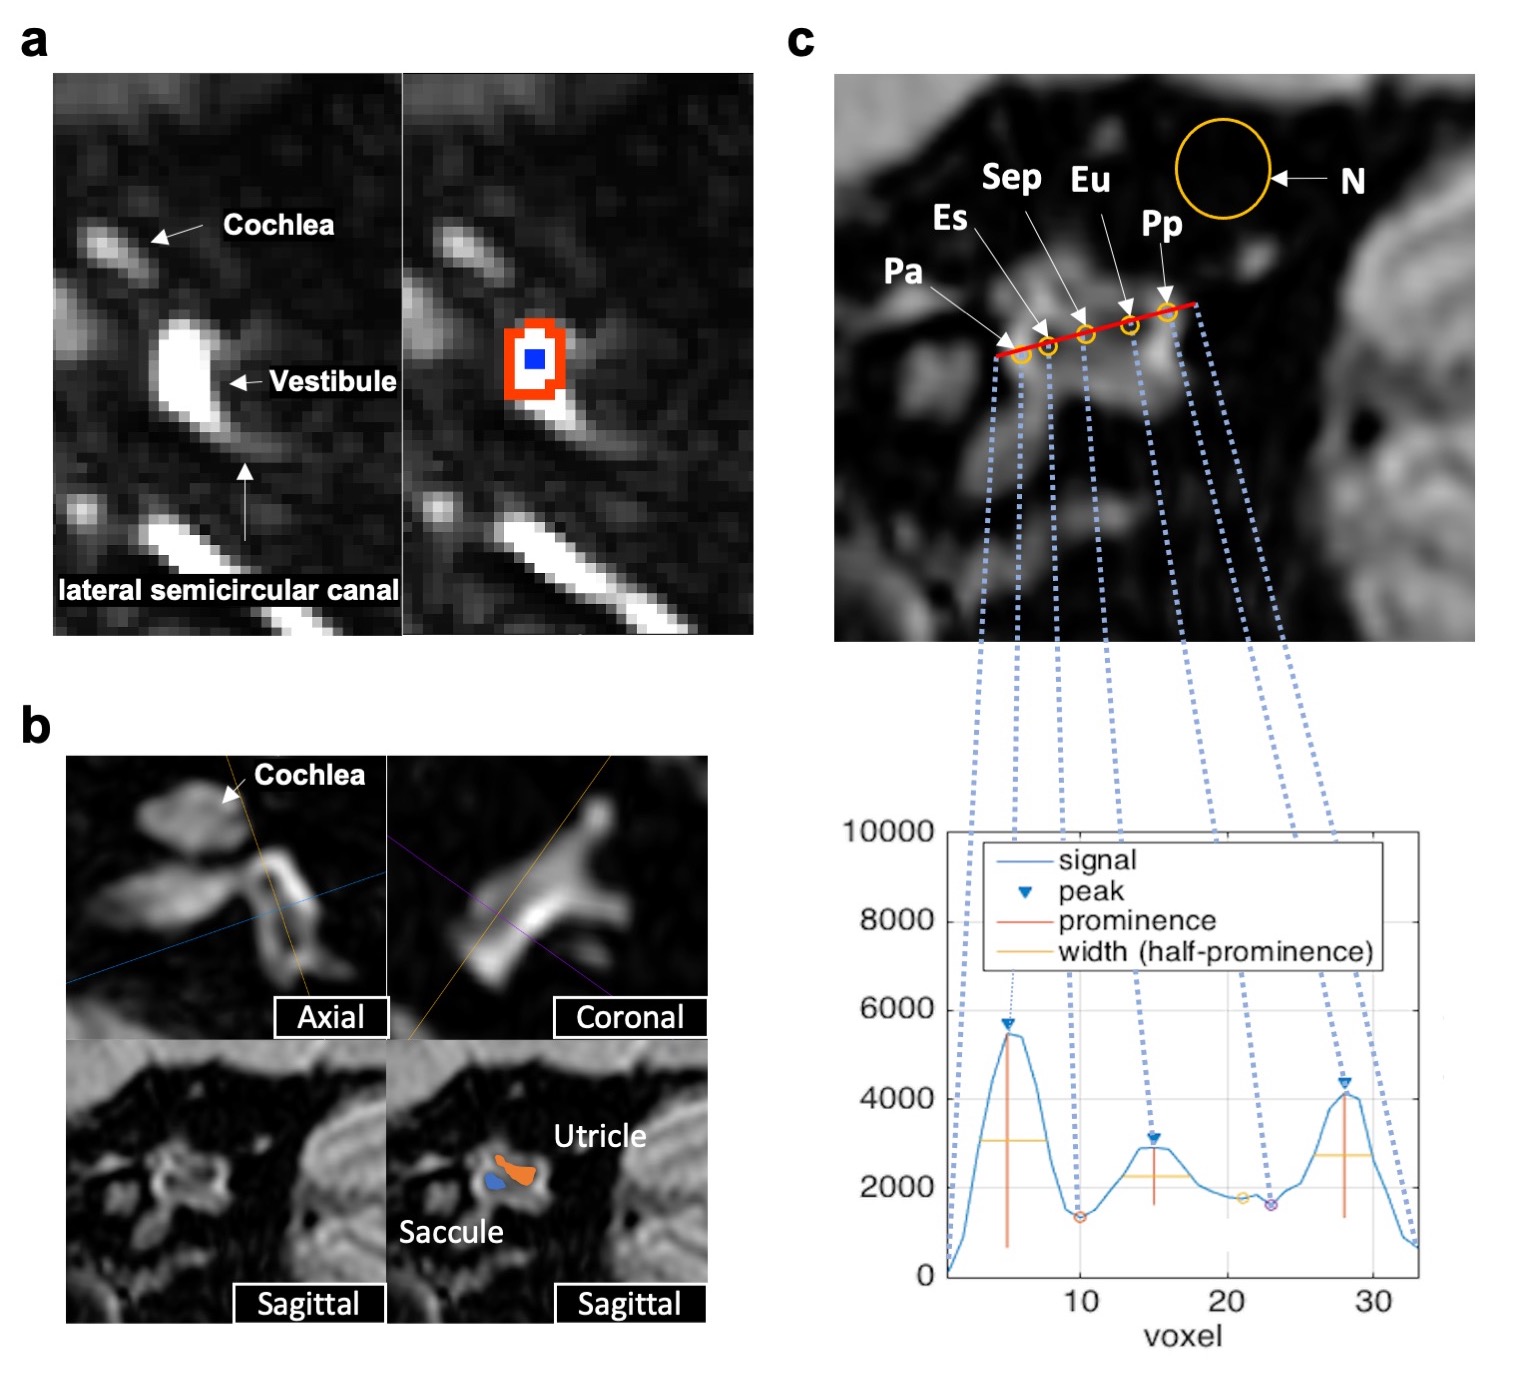
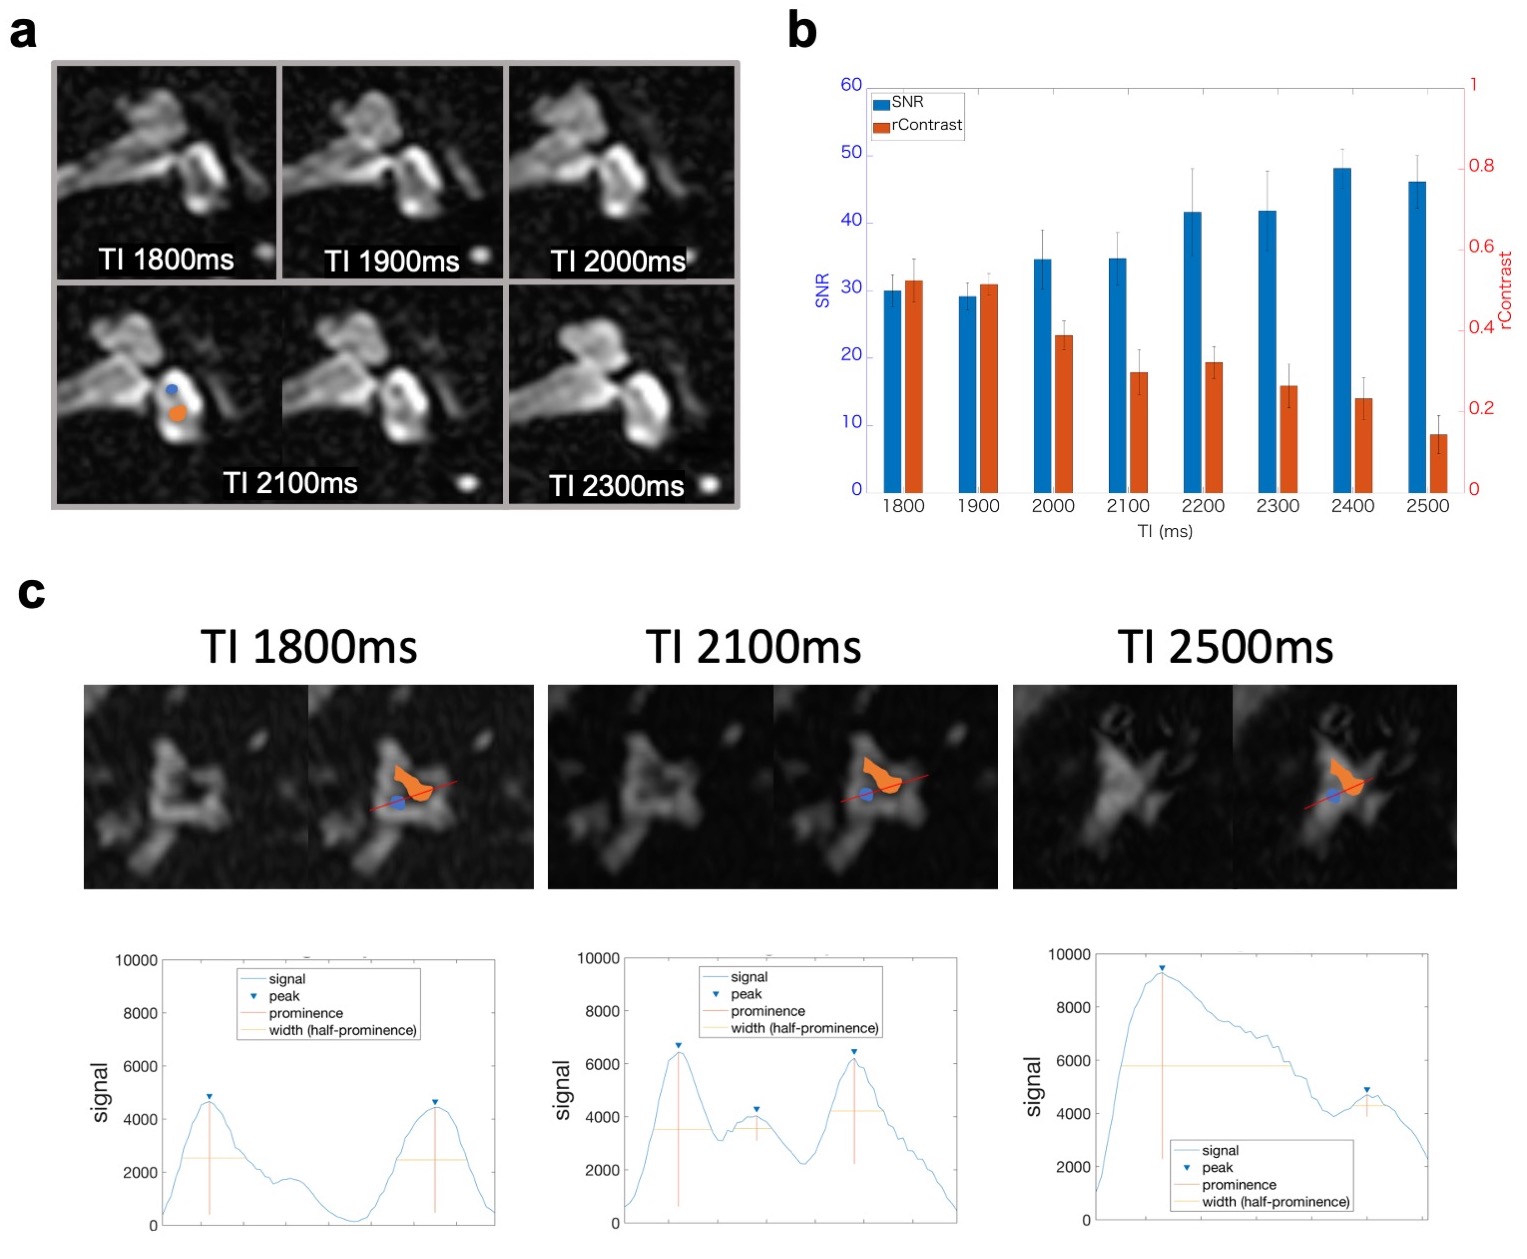
Twenty-five healthy volunteers (22-42, mean 27.6 years old) were scanned on a 3T MRI unit (Vantage Galan 3T/ZGO, Canon Medical Systems Corporation, Tochigi, Japan). To investigate how T2Prep can affect the contrast between PLS and ELS in 3D-FLAIR, we first scanned healthy subjects with variable T2Prep (OFF, 200ms, 400ms, and 600ms) and variable TIs (from 224ms to 5000ms) with the other constant parameters (TE 355ms, TR 7600ms, scan resolution 1×1×1.5mm3). Regions of interests (ROI) were drawn on the vestibular edge for PLS, and on the center for ELS (Fig.1a). Subsequently, fine TI optimization was performed for delineation of the saccule and utricle (two ELS structures separated by a septum) by using higher-resolution 3D-FLAIR (0.6×0.6×0.8mm) with variable TI (from 1800ms to 2500ms) and T2Prep=400ms (optimal value from the previous experiment; see result). Image quality was evaluated on a reference sagittal slice3 (Fig. 1b). The ROIs were drawn, as shown in Fig. 1c. The signal-to-noise ratio (SNR) of PLS and relative contrast (rContrast) between PLS and ELS were calculated with the following formulas from ROIs defined in Fig. 1c;$$SNR=((Pa+Pp)/2)/(Standard\ Deviation\ of\ N)$$,
$$rContrast=((Pa+Pp)/2-(Es+Eu)/2)/((Pa+Pp)/2+(Es+Eu)/2)$$.
In addition, signals were plotted along a reference line passing through the center of the utricle and saccule (Fig. 1c). Signal curves were considered as “good shape” if three peaks could be identified with prominence higher than 5% of the signal range and half wideness more than three voxels. These peaks correspond to an alternation of PLS-utricle-septum-saccule-PLS. Finally, thirteen healthy volunteers were scanned with the optimal parameters determined from the above experiments.
Results
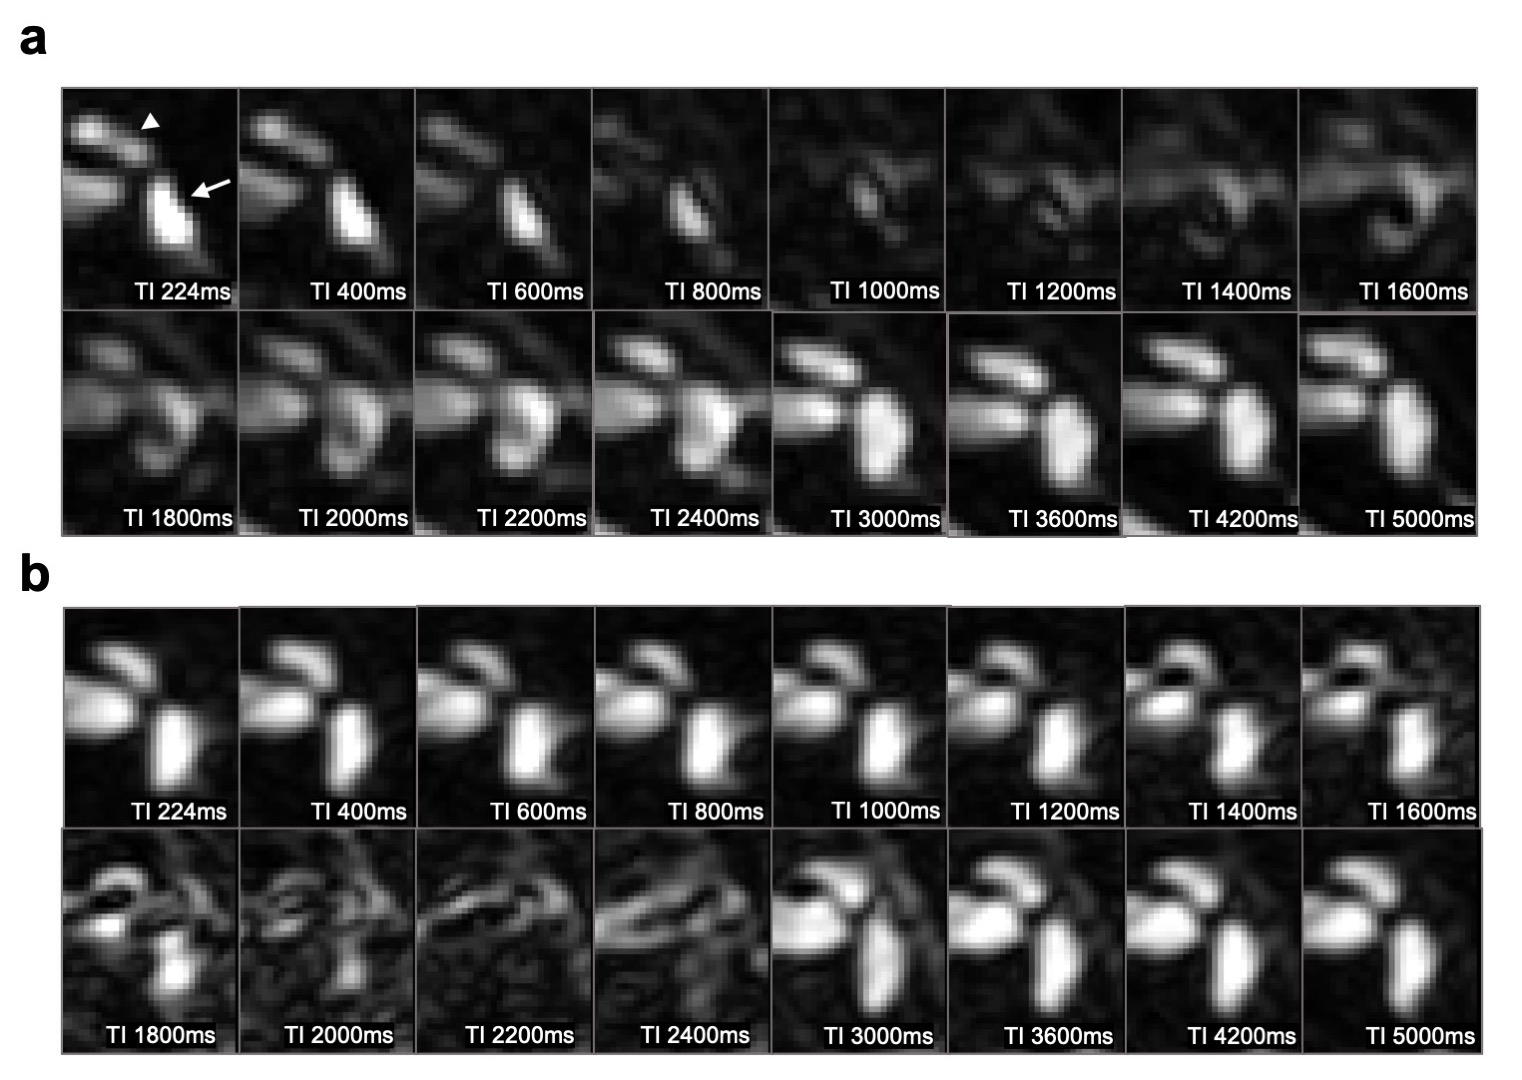
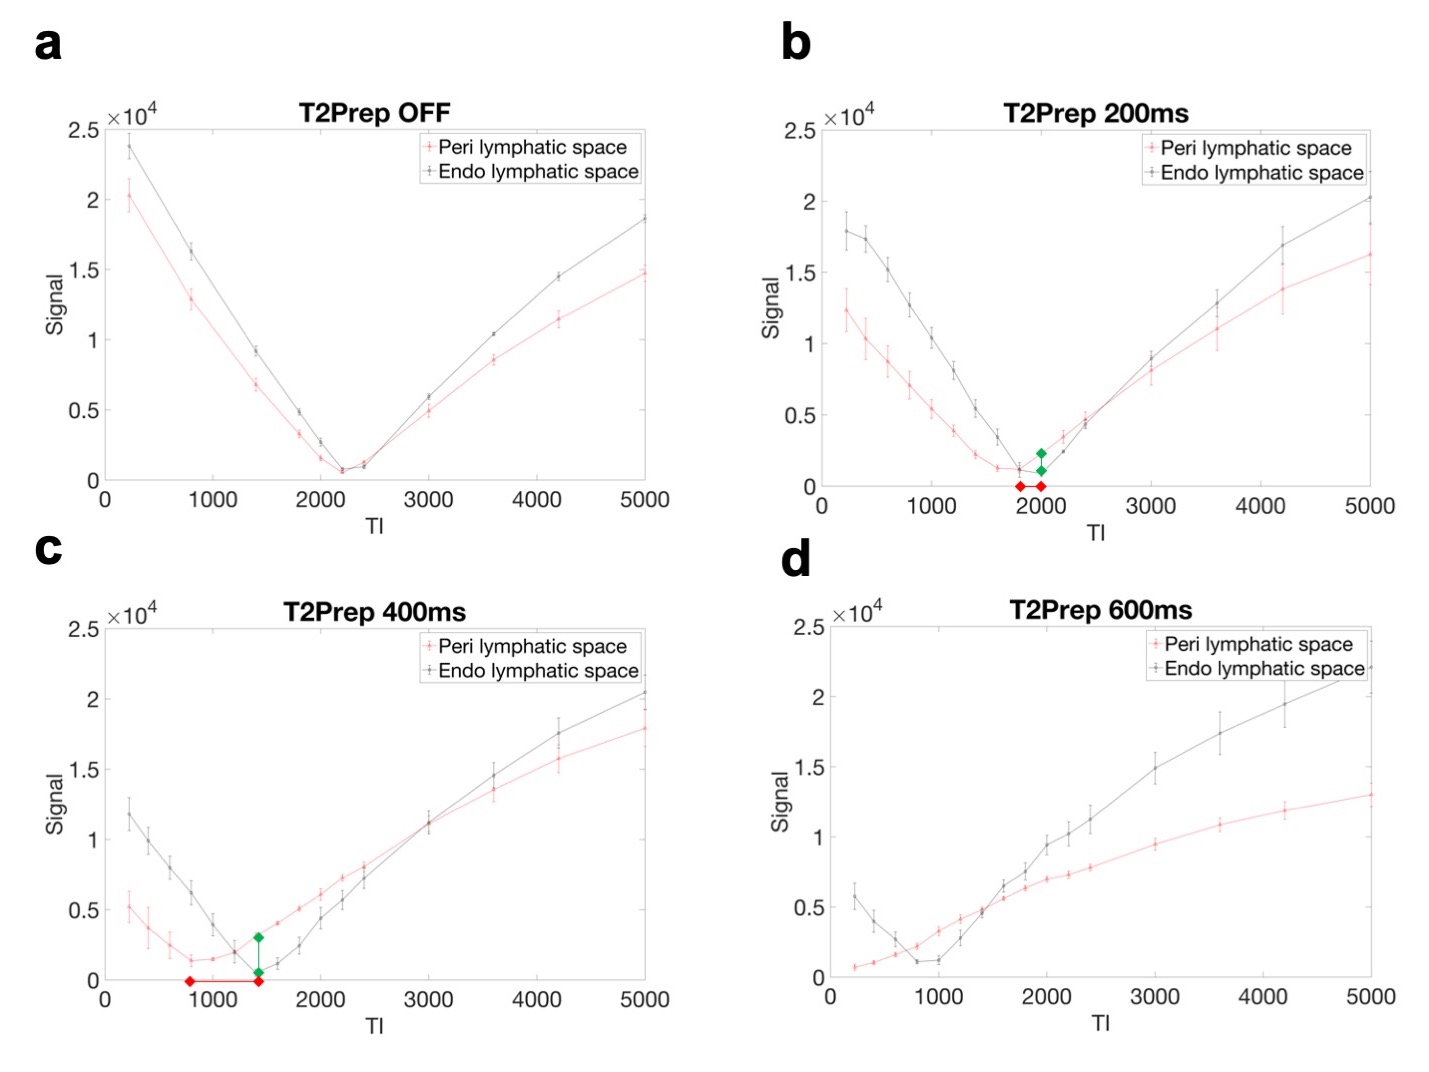
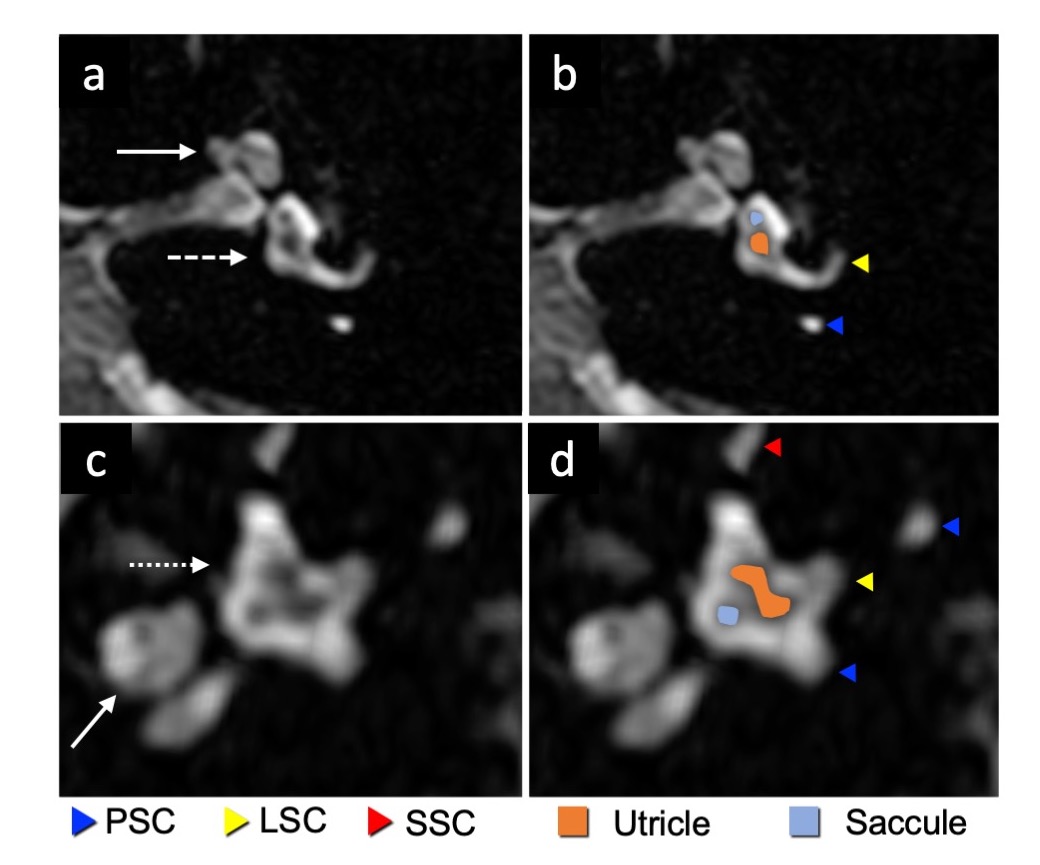
PLS and ELS could not be distinguished when T2Prep was turned off, but these structures started to be differentiated even at an intermediate spatial resolution when T2Prep was used (Fig. 2). The evolution of the signal from PLS and ELS is shown in Fig 3. The PLS and ELS null points were identical when T2Prep was turned off, explaining that these structures were hard to differentiate (Fig 3). The application of T2Prep shortened the null points of both PLS and ELS but from different amounts. Interestingly, the null point difference was larger for T2Prep=400ms than for 200ms (Fig 3b,c). The relative contrast between PLS and ELS at ELS's null point was also larger for T2Prep=400ms than for 200ms (Fig 3b,c). When using T2Prep=600ms, PLS's null point was less than the available minimum TI (Fig. 3d). From these experiments, we concluded that 400ms T2Prep was optimal. The saccule and utricle are two ELS structures separated by a thin septum and were visualized with T2Prep=400ms at high resolution even without contrast media (Fig 4). Such visualization varied depending on TI (Fig. 5a). There was a tradeoff between the rContrast that increased with shorter TI, and SNR of PLS that decreased with shorter TI (Fig. 5b). In addition, signal curve analysis showed that “good shape” curve (indicating separation of the saccule and utricle by a septum) was most frequently observed (6 in 8 ears) when using TI=2100ms (Fig. 5c, Table 1). These results were consistent with the visual impression (Fig. 5a,c). When testing such optimal non-contrast 3D-FLAIR using T2Prep=400ms and TI=2100ms in healthy volunteers, the saccule and utricle were successfully delineated in 20 out of a total of 26 ears (77%).Discussion
We identified a specific combination of T2Prep and TI from high-resolution 3D-FLAIR that allowed differentiating ELS from PLS and even delineating the utricle from the saccule without gadolinium injection. The null points of PLS and ELS were identical when T2Prep was turned off, but they were differentially shortened by T2Prep, suggesting that T1 values of PLS and ELS are close, but T2 values are different and that T2Prep captures this T2 difference and provides the contrast. In contrast, post-gadolinium FLAIR captures T1 shortening of gadolinium distributed only in PLS. The saccule and utricle were best distinguished with T2Prep=400ms and TI=2100ms. The two structure delineation was very similar to that showed in previous studies using delayed (4h) contrast-enhanced FLAIR3,4, supporting the validity of this sequence. We found these structures were clearly identifiable in a high percentage (77%) of healthy cases. This result is slightly inferior but close to a recent study showing that the two structures were separately seen in 89% of healthy subjects on the delayed post-gadolinium FLAIR5. This optimization paves the way toward exploring Meniere disease without injection, which is currently under investigation at our institution.Acknowledgements
No acknowledgement found.References
1. Thalmann I, Comegys TH, Liu SZ, Ito Z, Thalmann R. Protein profiles of perilymph and endolymph of the guinea pig. Hear Res. 1992;63(1–2):37–42. doi: 10.1016/0378-5955(92)90071-T.
2. Visser F, Zwanenburg JJM, Hoogduin JM, Luijten PR. High-resolution magnetization-prepared 3D-FLAIR imaging at 7.0 Tesla: Magnetization-Prepared 3D-FLAIR Imaging at 7T. Magn Reson Med. 2010;64(1):194–202. doi: 10.1002/mrm.22397.
3. Attyé A, Eliezer M, Boudiaf N, et al. MRI of endolymphatic hydrops in patients with Meniere’s disease: a case-controlled study with a simplified classification based on saccular morphology. Eur Radiol. 2017;27(8):3138–3146. doi: 10.1007/s00330-016-4701-z.
4. Banciu E. The inner ear imaging anatomy with 3T MRI new sequences: A comprehensive update. European Congress of Radiology; 2014; doi: 10.1594/ECR2014/C-2316.
5. Bernaerts A, Vanspauwen R, Blaivie C, et al. The value of four stage vestibular hydrops grading and asymmetric perilymphatic enhancement in the diagnosis of Menière’s disease on MRI. Neuroradiology. 2019;61(4):421–429. doi: 10.1007/s00234-019-02155-7.
Figures