3925
Dose Painting Intensity-modulated Radiotherapy Guided by 3D arterial spin labeling MRI for Brain Metastases1Department of Radiation Physics, Shandong Cancer Hospital and Institute, Shandong First Medical University and Shandong Academy of Medical Sciences, Jinan, China, 2GE Healthcare, MR Research China, Beijing, China
Synopsis
In this work, brain metastases (BM) were divided into multiple sub-volumes based on the cerebral blood flow (CBF) distribution derived by 3D arterial spin labeling (ASL) perfusion imaging. Due to the previously reported strong relationship, low CBF area was defined as the hypoxia area and selected as the region of interest (ROI). On this ROI, we further investigated the behaviors of conventional Intensity-modulated Radiotherapy (IMRT) plan, simultaneous integrated boost IMRT plan with and without constraints by increasing targeted doses, aiming to provide a new reference model for individualized radiotherapy for BM patients.
Synopsis
In this work, brain metastases (BM) were divided into multiple sub-volumes based on the cerebral blood flow (CBF) distribution derived by 3D arterial spin labeling (ASL) perfusion imaging. Due to the previously reported strong relationship, low CBF area was defined as the hypoxia area and selected as the region of interest (ROI). On this ROI, we further investigated the behaviors of conventional Intensity-modulated Radiotherapy (IMRT) plan, simultaneous integrated boost IMRT plan with and without constraints by increasing targeted doses, aiming to provide a new reference model for individualized radiotherapy for BM patients.Introduction
Radiotherapy (RT) has been applied routinely in clinic for brain metastases (BM) patients[1]. However, good curative effects have not been achieved successfully. One possible reason is that low blood flow area is often hypoxic with RT resistance where more radiation dose is needed[2]. Accurate and comprehensive identification of hypoxic regions is thus crucial.As a well-established noninvasive and quantitative perfusion imaging, 3D arterial spin labeling (ASL) magnetic resonance imaging (MRI) can accurately measure cerebral blood flow (CBF), allowing direct reflection of tumor perfusion[3]. Previous studies have proved that 3D-ASL perform well in the recognition of hypoxic areas[4]. Therefore, this study aimed to explore the feasibility of 3D-ASL in identifying and segmenting hypoxic area for BM. Additionally, the dosimetric characteristics of safe targeted dose escalation for low-CBF sub-volumes were also examined.Materials and Methods
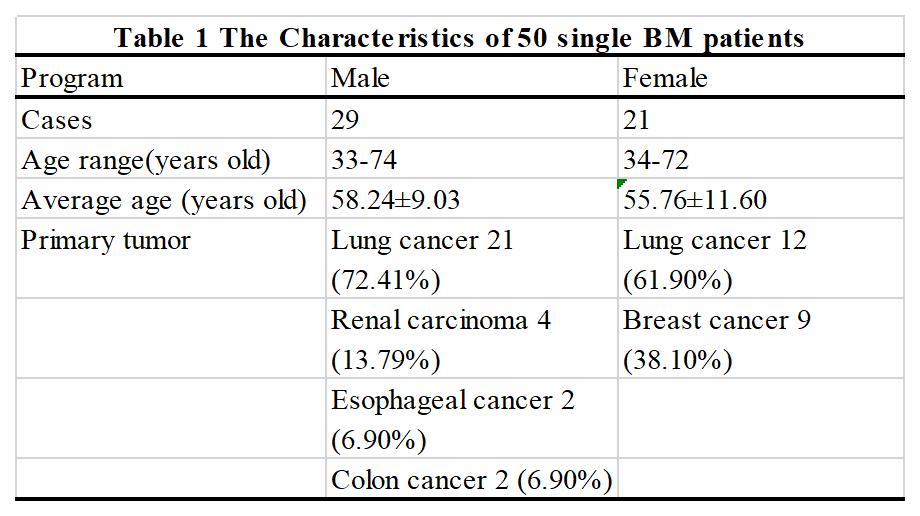
Subjects50 patients with single BM and only RT received were recruited in this study (Table 1). The eligibility criteria for patient recruitment were shown as follows: an imaging-based diagnosis of BM; no contraindications to CT or MR; clear images with no artifacts; and a maximum tumor cross-sectional diameter of more than 2 cm.
Image acquisition
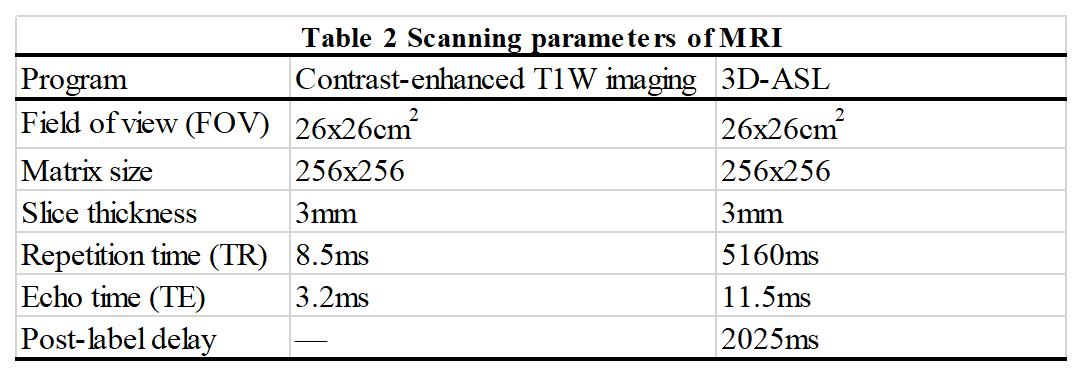
CT and MR simulation experiments were respectively performed on CT scanner (Brilliance Big Bore, Philips, Netherlands) and 3.0 T MR scanner (Discovery 750W, GE Healthcare, USA) with 6 coil employed. Contrast-enhanced T1-weighted (T1W) images, 3D-ASL and contrast-enhanced T1-weighted (T1W) images were obtained successively. Gadopentetate dimeglumine was power-injected at doses standardized by patient body weight (0.2 mL/kg) at 2 mL/s, and the scan started 3-5 mins after injection. The detailed scan parameters were shown in Table 2.
Data analysis and Treatment planning
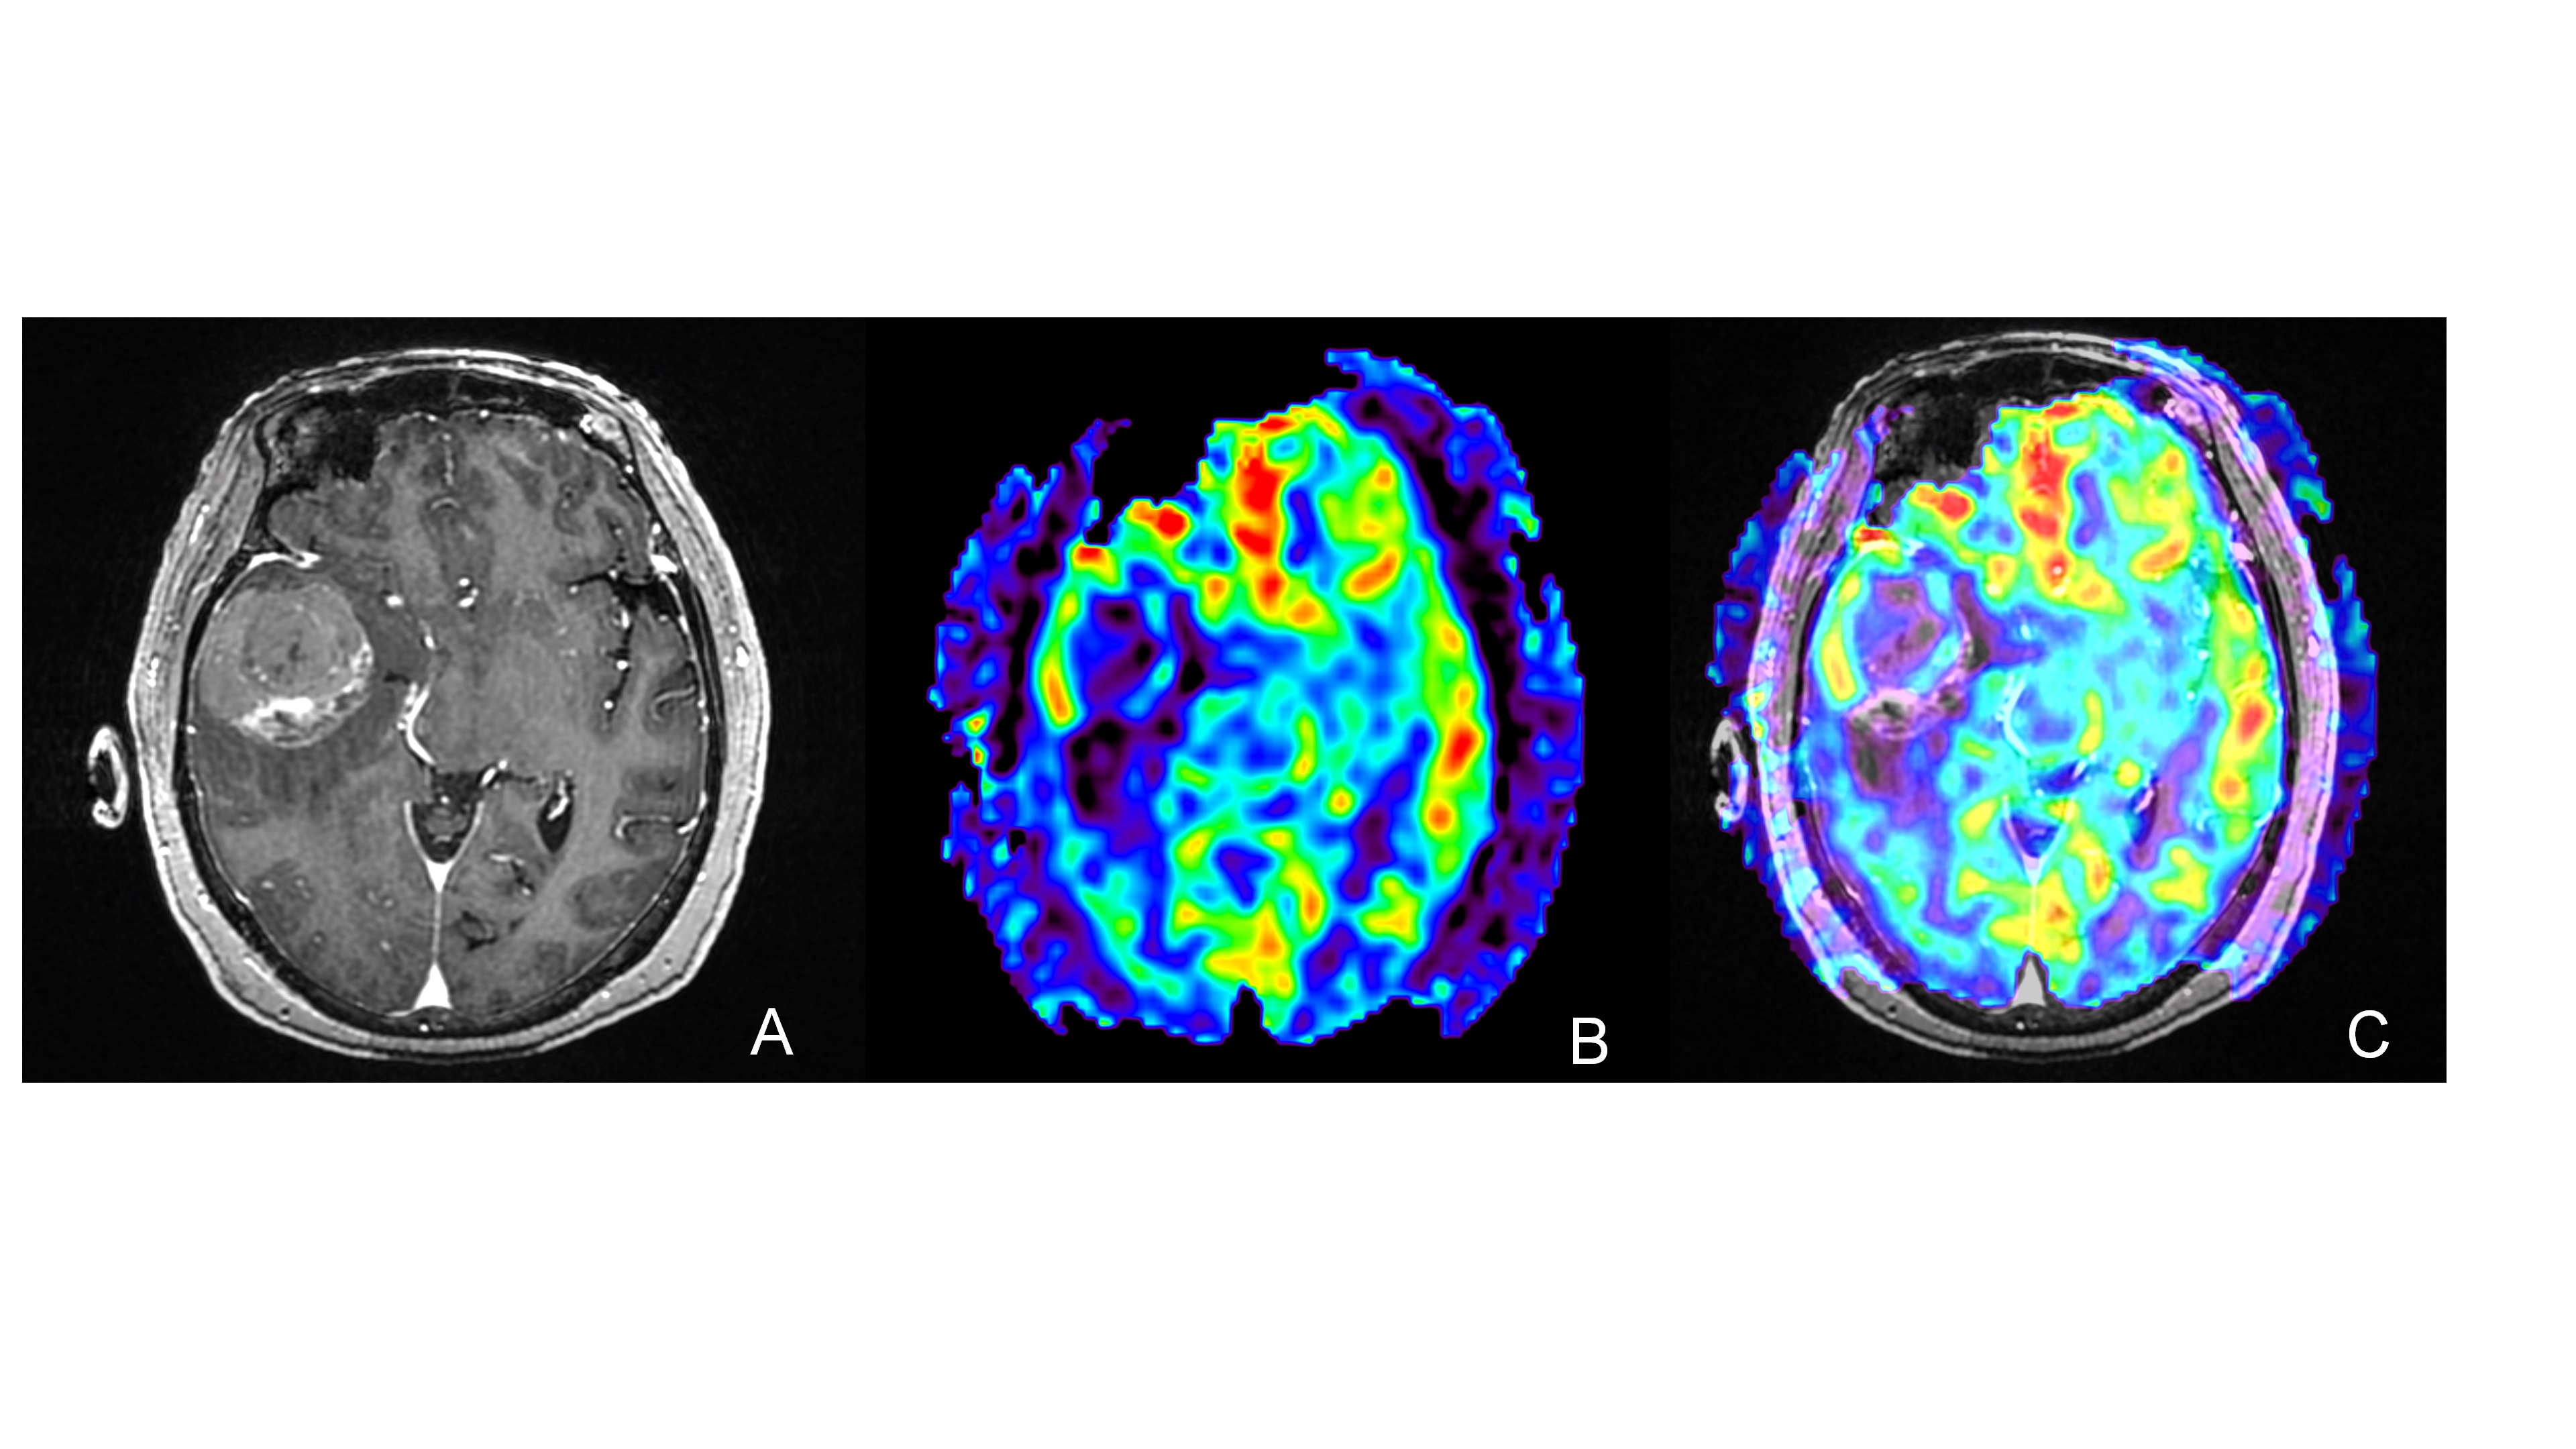
3D ASL images were analyzed using a vendor-provided software in GE ADW 4.7 workstation. The CBF parametric mapping was obtained accordingly.
Gross tumor volume (GTV) was defined as the region with notable enhancement on contrast-enhanced T1W images. Sub-volume with less than 25% of the maximum CBF was defined as (potential) hypoxic region GTVH. High- or non-perfusion sub-volumes were considered the normal prescription dose region GTVN. The planning target volume (PTV) was designed to allow 5mm margin beyond GTV, and 3mm margin was added to GTVH to obtain PTVH. PTVN was calculated by subtracting PTVH from PTV.
Conventional and Simultaneous Integrated Boost Intensity-modulated radiotherapy plans were defined using Eclipse (Version 15.6, Varian, USA) for PTV and PTVH, respectively. Plan 1 prescribed 60Gy to the primary PTV with a maximum dose constraint of 66Gy. Plans 2 and 3 were designed based on Plan 1 adding a boost of 12Gy to PTVH, with a maximum dose constraint of 79Gy for Plan2 alone.And the radiation dose that covered 2%, 50% and 98% of PTVs (D2%, D98%, and Dmean) and D2% of organs at risk (OARs) were counted. Furthermore, the target coverage, conformity index (CI) and homogeneity index (HI) were calculated.
Statistical analyses were performed using SPSS software with Version 22.0. Analysis of variance was used to evaluate the differences among three plans. The least significant difference (LSD) was used in post-hoc pairwise comparisons. All data were expressed as, and P<0.05 indicates a significant difference.
Results
Mean GTV volume was 34.53 cm3, and GTVH volume was 16.95 cm3, accounting for 49.09% of GTV. A representative example was shown in Figure 1.Compared to Plan 1, D2%, D98% and Dmean values of PTVH escalated by 20.50%, 19.32%, and 19.60%, respectively, in Plan 2, and by 24.05%, 6.77%, and 17.00%, respectively, in Plan 3 (all P<0.05). Accordingly, the doses administered in Plans 2 and 3 were 73.67±0.34Gy and 72.37±0.61Gy (both P<0.05). Both conventional plans and boost plans achieved 98% target coverage, and Plan 2 achieved PTVH coverage of up to 99.90%. In Plans 2 and 3, the CI of PTVH was increased by 45.45% and 63.64%, respectively; HI was sacrificed, increasing separately from 0.04 to 0.05 and to 0.11 (all P<0.05). To be noted, the doses received by OARs did not significantly differ between the conventional plans and boost plans (all P >0.05).
Discussion
In this study, the volume of hypoxic area identified by 3D-ASL was close to half the tumor volume. Constrained boost plan not only has better improvement to hypoxic areas than non-constrained boost plan, but also achieved higher average and minimum doses than the other two plans during all three classes of PTVs. Indeed, the targeted dose escalation did not lead to additional risk to OARs with statistical differences. But, the corresponding performance in constrained boost plan was still better than that of the other one. Furthermore, constrained boost plan performed well in target coverage and HI, while non-constrained boost plan showed better results in CI.Conclusions
In summary, it is feasible to delineate hypoxic sub-volumes and escalate their radiation doses under the guidance of CBF distribution based on 3D-ASL imaging. An increased dose is targeted to the hypoxic sub-volume without increasing the dose delivered to OARs. This approach provides an effective individualized dose-painting strategy for BM patients. However, the effect of boost plan for BM still needs to be validated further and the follow-up research is on-going.Acknowledgements
We gratefully acknowledge Lizhen Wang and Ya Su for their support with technology.References
[1] Hughes Ryan T,Masters Adrianna H,McTyre Emory R et al. Initial SRS for Patients With 5 to 15 Brain Metastases: Results of a Multi-Institutional Experience[J]. Int. J. Radiat. Oncol. Biol. Phys, 2019, 104: 1091-1098.
[2] Lee CT, Boss MK, Dewhirst MW. Imaging tumor hypoxia to advance radiation oncology. Antioxid Redox Signal 2014; 21:313–337.
[3] Wells JA, Thomas DL, Saga T, et al. MRI of cerebral micro-vascular flow patterns: A multi-direction diffusion-weighted ASL approach[J]. J Cereb Blood Flow Metab. 2017;37(6):2076-2083.
[4] Shimizu Yukie,Kudo Kohsuke,Kameda Hiroyuki et al. Prediction of Hypoxia in Brain Tumors Using a Multivariate Model Built from MR Imaging and F-Fluorodeoxyglucose Accumulation Data.[J] .Magn Reson Med Sci, 2020, 19: 227-234.
Figures