3921
Simultaneously acquired PET and ASL imaging biomarkers are helpful in differentiating progression from pseudo-progression in treated gliomas1Neuroradiology, Pitié-Salpêtrière Hospital, APHP, Sorbonne universite, Paris, France, 2UMR S 1127, CNRS UMR 722, ICM, Sorbonne Universités, Paris, France, 3CENIR, ICM, Sorbonne Universités, Paris, France, 4CENIR, ICM, Paris, France, 5Nuclear Medecine, Pitié-Salpêtrière Hospital, APHP, Sorbonne universite, Paris, France
Synopsis
We aimed at investigating the methods based on coupling cerebral perfusion (ASL) and amino-acid metabolism (18F-DOPA-PET) measurements to evaluate the diagnostic performance of simultaneous PET/MRI in glioma follow-up. Tumour isocontour maps of 18F-DOPA-PET and ASL T-maps were created using SPM and metabolic/perfusion abnormalities were evaluated with the asymmetry index z-score. SPM map analysis of significant-size clusters and semi-quantitative PET and ASL map evaluation were performed. The tumour isocontour maps and T-maps showed the highest specificity (100%) and sensitivity (94.1%) for ASL and 18F-DOPA analysis, allowing to achieve high diagnostic performance in differentiating between progression and pseudo-progression in treated gliomas.
Introduction
Surgery resection of adult brain glioma is often followed by adjuvant radiotherapy and/or chemotherapy. However, complete remission when occurs is usually time-limited and the risk of tumour recurrence is high, especially for high-grade glial lesions. Close follow-up under treatment of patients presenting with high grade glioma is essential for early detection of a progression. The magnetic resonance imaging (MRI) is the modality of choice in daily routine for this follow up. However, standard anatomical MRI may not be always reliable after radiation or chemotherapy inducing necrosis and increasing incidence of non-specific treatment induced signal changes caused by inflammation, edema, ischemia, or specific treatment-related effects such as anti-angiogenic or immune therapy. In radiotherapy-treated glioma patients, the specificity of standard MRI may be as low as 50% for detection of recurrent disease. Various advanced MRI techniques as well as positron emission tomography (PET) were proposed for improving the diagnostic accuracy, that remains still moderate and variable across studies. The hybrid imaging PET-MRI brain allows, in a single examination session, to study in a combined and optimal way, the metabolic profile in PET, the anatomical extension and the tumor neoangiogenesis. The aim of the present work was studying, in a reproducible quantitative way, cerebral perfusion measured by ASL-MRI and glucose metabolism measured by 18F-DOPA-PET in post-therapeutic glioma to evaluate the potential of hybrid PET/MR in characterizing the tumour-progression profile. We expected that the proposed processing method of simultaneous analysis of ASL perfusion and 18F-DOPA PET maps will allow to successfully differentiate between tumour progression and treatment-related pseudo-progression or radionecrosis, bringing and objective method as an alternative to clinical routine standards.Methods
Between December 2015 and September 2017, patients followed for primary malignant brain tumors underwent FDOPA PET-MRI for the differential diagnosis between tumor progression and radionecrosis. The acquisitions were performed with a PET-MR system (SIGNA, GE Healthcare, Milwaukee, USA) 10 min after the injection of 2 MBq/kg of FDOPA. The MRI acquisition included Spin-echo (SE) 3D T1-weighted (T1-w) images without contrast and after injection of 0.2 ml/kg of Gadolinium (Gd)-DOTA (0.5 M Dotarem, Guerbet, Roissy, France), 3D FLAIR imaging, suseptibility weighted angiography (SWAN), diffusion weighted imaging (DWI) and pseudo-continuous arterial spin labeling (pCASL) and dynamic susceptibility-contrast (DSC) perfusion. Scanning time included a 20 min single-bed-position PET emission scan (Figure 1). PET images were reconstructed with an OSEM algorithm integrating TOF, PSF modeling and attenuation and scatter correction with 8 iterations and 28 subsets, a FOV of 300 x 300 mm2, and a voxel size of 1.17x1.17x2.78mm3.Data were preprocessed with statistical parametric mapping (SPM), including registration on T1-weighted images, spatial and intensity normalization, and tumour segmentation. As index tests, tumour isocontour maps of 18F-DOPA-PET and ASL T-maps were created and metabolic/perfusion abnormalities were evaluated with the asymmetry index z-score. SPM map analysis of significant-size clusters and semi-quantitative PET and ASL map evaluation were performed and compared to the gold-standard diagnosis. Lastly, ASL and PET topography of significant clusters was compared to that of the initial tumour. The results were compared with the gold standard being histology results or follow-up at more than 3 months.Statistical analysis: The results of the analysis of each SPM map as well as of the CBF and PET readings were compared to the gold standard diagnosis. Sensitivity, specificity, PPV and NPV were calculated. The subgroup analyses for low- and high-grade and for WHO III and WHO IV tumours were performed.Additionally, qualitative analysis of the SPM maps was performed to assess the PET and CBF high-signal cluster topography.Results
Fifty-eight patients (mean age 53.1+/- 14.3, 34 males) with treated unilateral gliomas who were included in the study constituted a group of 10 (17.2%) low-grade and 48 (82.8%) high-grade gliomas.The tumour isocontour maps and T maps showed the highest specificity (100%) and sensitivity (94,1%) for ASL and 18F-DOPA analysis, respectively. The sensitivity of qualitative SPM maps and semi-quantitative rCBF and rSUV analyses were the highest for glioblastoma as compared to other glioma grades.Clusters of high ASL-CBF were located within the PET clusters in 61.8% cases of progression. The location was, in most cases (64.3%), on the lesion periphery.Discussion
In the present work, we propose an objective method of simultaneous analysis of ASL perfusion and 18F-DOPA-PET maps for the evaluation of glial tumour progression. Tumoural isocontour and T-map analyses has shown high diagnostic accuracy with the highest specificity for ASL-CBF analysis and the highest sensitivity for 18F-DOPA analysis, which suggests that these two biomarkers, acquired during the same examination session, are concordant and complementary.Conclusion
Simultaneous analysis of the tumour CBF isocontour and T-maps and the 18F-DOPA PET uptake allows achieving high diagnostic performance. This can help differentiate between tumour progression and pseudo-progression or radio-necrosis. The method can be promising for large-scale clinical trials and artificial intelligence studies, where unbiased reproducible techniques are required.Acknowledgements
No acknowledgement found.References
- Mullins ME, Barest GD, Schaefer PW, Hochberg FH, Gonzalez RG, Lev MH. Radiation necrosis versus glioma recurrence: conventional MR imagingclues to diagnosis. AJNR Am J Neuroradiol. 2005; 26(8):1967–72. 3.
- Kumar AJ, Leeds NE, Fuller GN, Van Tassel P, Maor MH, Sawaya RE, et al. Malignant gliomas: MR imaging spectrum of radiation therapy- andchemotherapy-induced necrosis of the brain after treatment. Radiology 2000 ; 217(2):377–84.
- Rachinger W, Goetz C, Popperl G, Gildehaus FJ, Kreth FW, Holtmannspotter M et al Positron emission tomography with O-(2-[18F]fluoroethyl)-Ltyrosineversus magnetic resonance imaging in the diagnosis of recurrent gliomas. Neurosurgery 2005; 57:505–511
- Ellingson BM, Bendszus M, Sorensen AG, Pope WB Emerging techniques and technologies in brain tumor imaging. Neuro Oncol 2014; 16(Suppl7):vii12–vii23
- Galldiks N, Langen KJ, Pope WB From the clinician’s point of view: what is the status quo of positron emission tomography in patients with braintumors? Neuro Oncol 2015; 17:1434–1444
- Albert NL, Weller M, Suchorska B, Galldiks N, Soffietti R, Kim MM et al. Response Assessment in Neuro-Oncology working group and EuropeanAssociation for Neuro-Oncology recommendations for the clinical use of PET imaging in gliomas. Neuro Oncol. 2016
- Fink JR, Muzi M, Peck M, Krohn KA Multimodality brain tumor imaging: MR imaging, PET, and PET/MR imaging. J Nucl Med. 2015; 56:1554–1561
- Catana C, Drzezga A, Heiss WD, Rosen BR (2012) PET/MRI for neurologic applications. J Nucl Med 53:1916–1925
- Werner P, Barthel H, Drzezga A, Sabri O Current status and future role of brain PET/MRI in clinical and research settings. Eur J Nucl Med Mol Imaging2015; 42:512–526
Figures
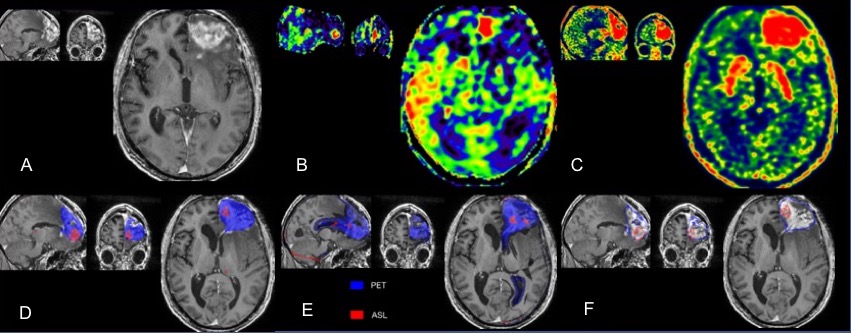
PET-MR of a patient with left WHO IV glioblastoma treated by surgery and adjuvant radio-chemotherapy.
Upper row: A: enhancement on the frontal lesion on a contrast-enhanced axial T1-w image; B: hyper-perfusion with increased CBF on ASL images corresponds to the area of contrast enhancement; C: 18F-DOPA PET map with increased SUV
Lower row: SPM maps were concordant with significant clusters, which confirmed progression. The red ASL clusters appear to be more peripheral than the blue extensive PET clusters. D: T-score map; E: Z-score of asymmetry index; F: isocontour map.
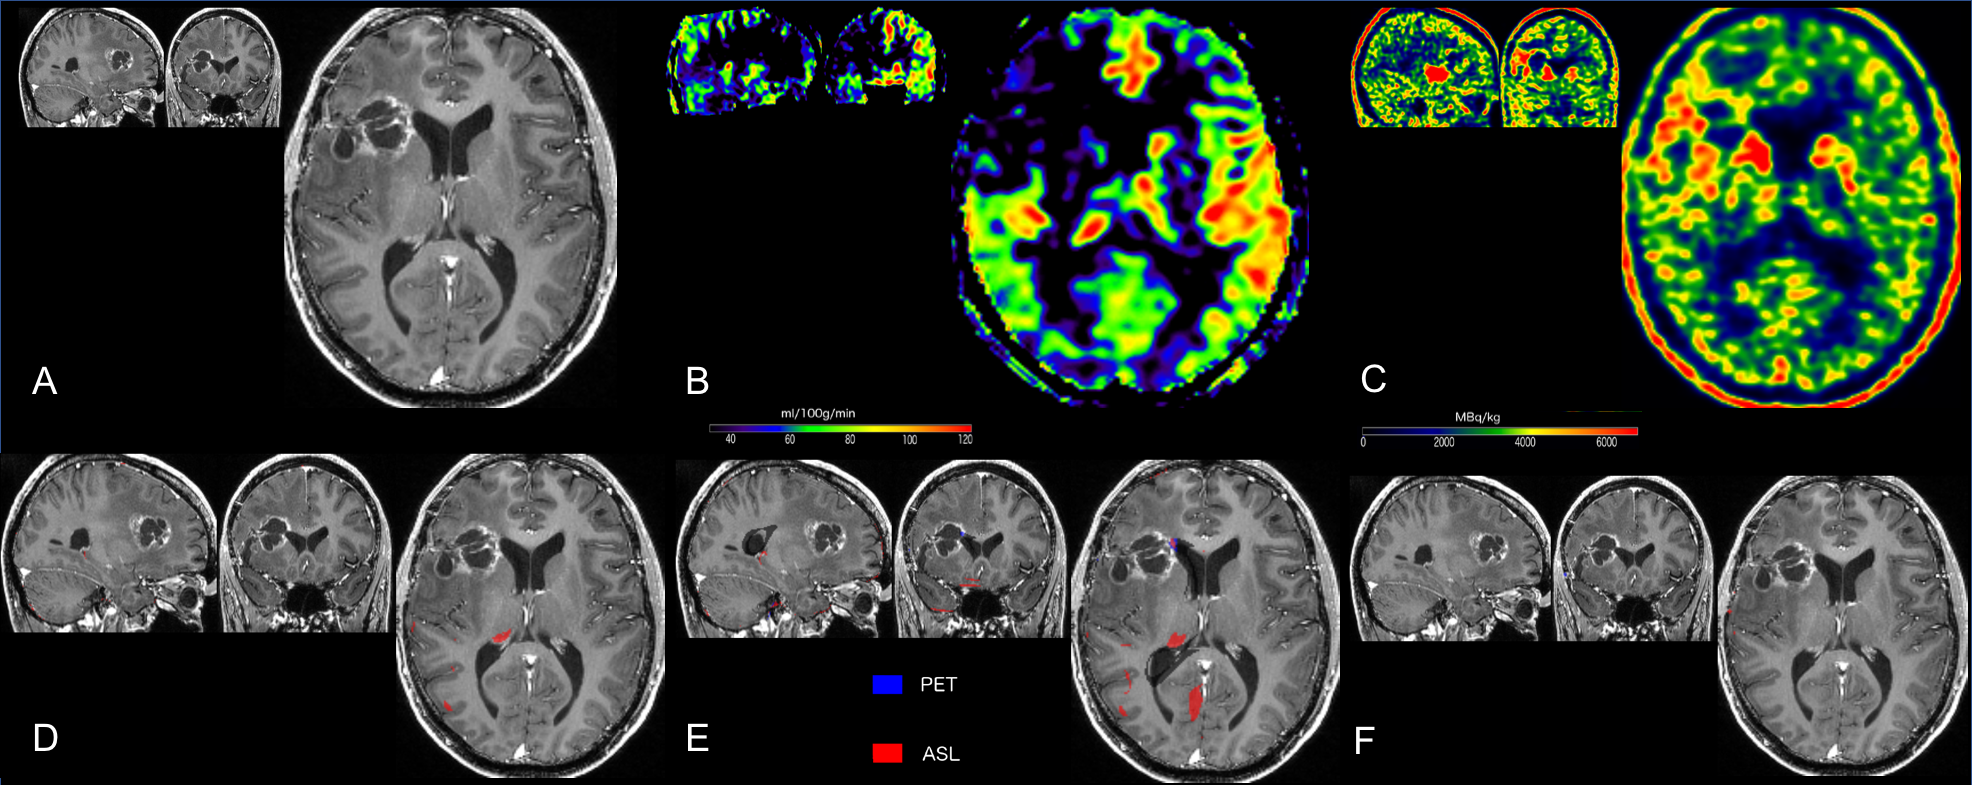
PET-MR of patient with right glioblastoma, treated by surgery and adjuvant radiotherapy
Upper row: A: linear cavitary enhancement observed on the initially-treated frontal lesion site on a contrast-enhanced axial T1-w image; B: the absence of hyper-perfusion as assessed by CBF on ASL images; C: 18F-DOPA PET map showing no significantly increased SUV
Lower row: SPM maps were concordant, with the absence of significant clusters, which confirmed pseudo-progression. D: T-score map; E: Z-score of asymmetry index; F: isocontour map.