3920
Value of Diffusion Kurtosis Imaging in Detecting Isocitrate Dehydrogenase Genotype in Low-grade Gliomas1Shandong Medical Imaging Research Institute, Jinan, China, 2Philips Healthcare, Beijing, China, 3Shandong provincal hospital, Jinan, China
Synopsis
The aim of this study was to detect the isocitrate dehydrogenase 1 (IDH 1) genotype in low grade gliomas using diffusion kurtosis imaging (DKI). The results indicated that IDH 1 wild-type gliomas have higher MK and lower MD values in tumor foci compared with mutant gliomas, and MK increased and MD decreased significantly in normal-appearing perilesional white matter (pWM) in all gliomas. Interestingly, lower FA in pWM than contralateral normal-appearing white matter was only seen in wild-type gliomas, while no difference was found in mutant-gliomas. These findings indicated that DKI were sensitive to differentiate IDH 1 genotypes in low-grade gliomas.
Introduction
Isocitrate dehydrogenase 1 (IDH 1) genotype was a key molecular marker and prognostic indicator for gliomas (1). Patients with IDH 1-wild-type gliomas tend to have a worse prognosis than those with IDH 1-mutant gliomas (2,3). Therefore, determination of IDH 1 genotype status prior to surgery has vital clinical significance for tumor classification and assessment of prognosis. Diffusion kurtosis imaging (DKI) is an MR technique extending from diffusion tensor imaging (DTI), based on acquisitions with strong diffusion weighting, which can be better in characterization of non-Gaussian diffusion contribution and detection of microstructural tissue alterations in vivo (4,5). So the aim of this prospective observational study was to assess the alterations of DKI variables in tumor foci and perilesional white matter (pWM), and further to distinguish IDH genotypes in low-grade gliomas.Methods
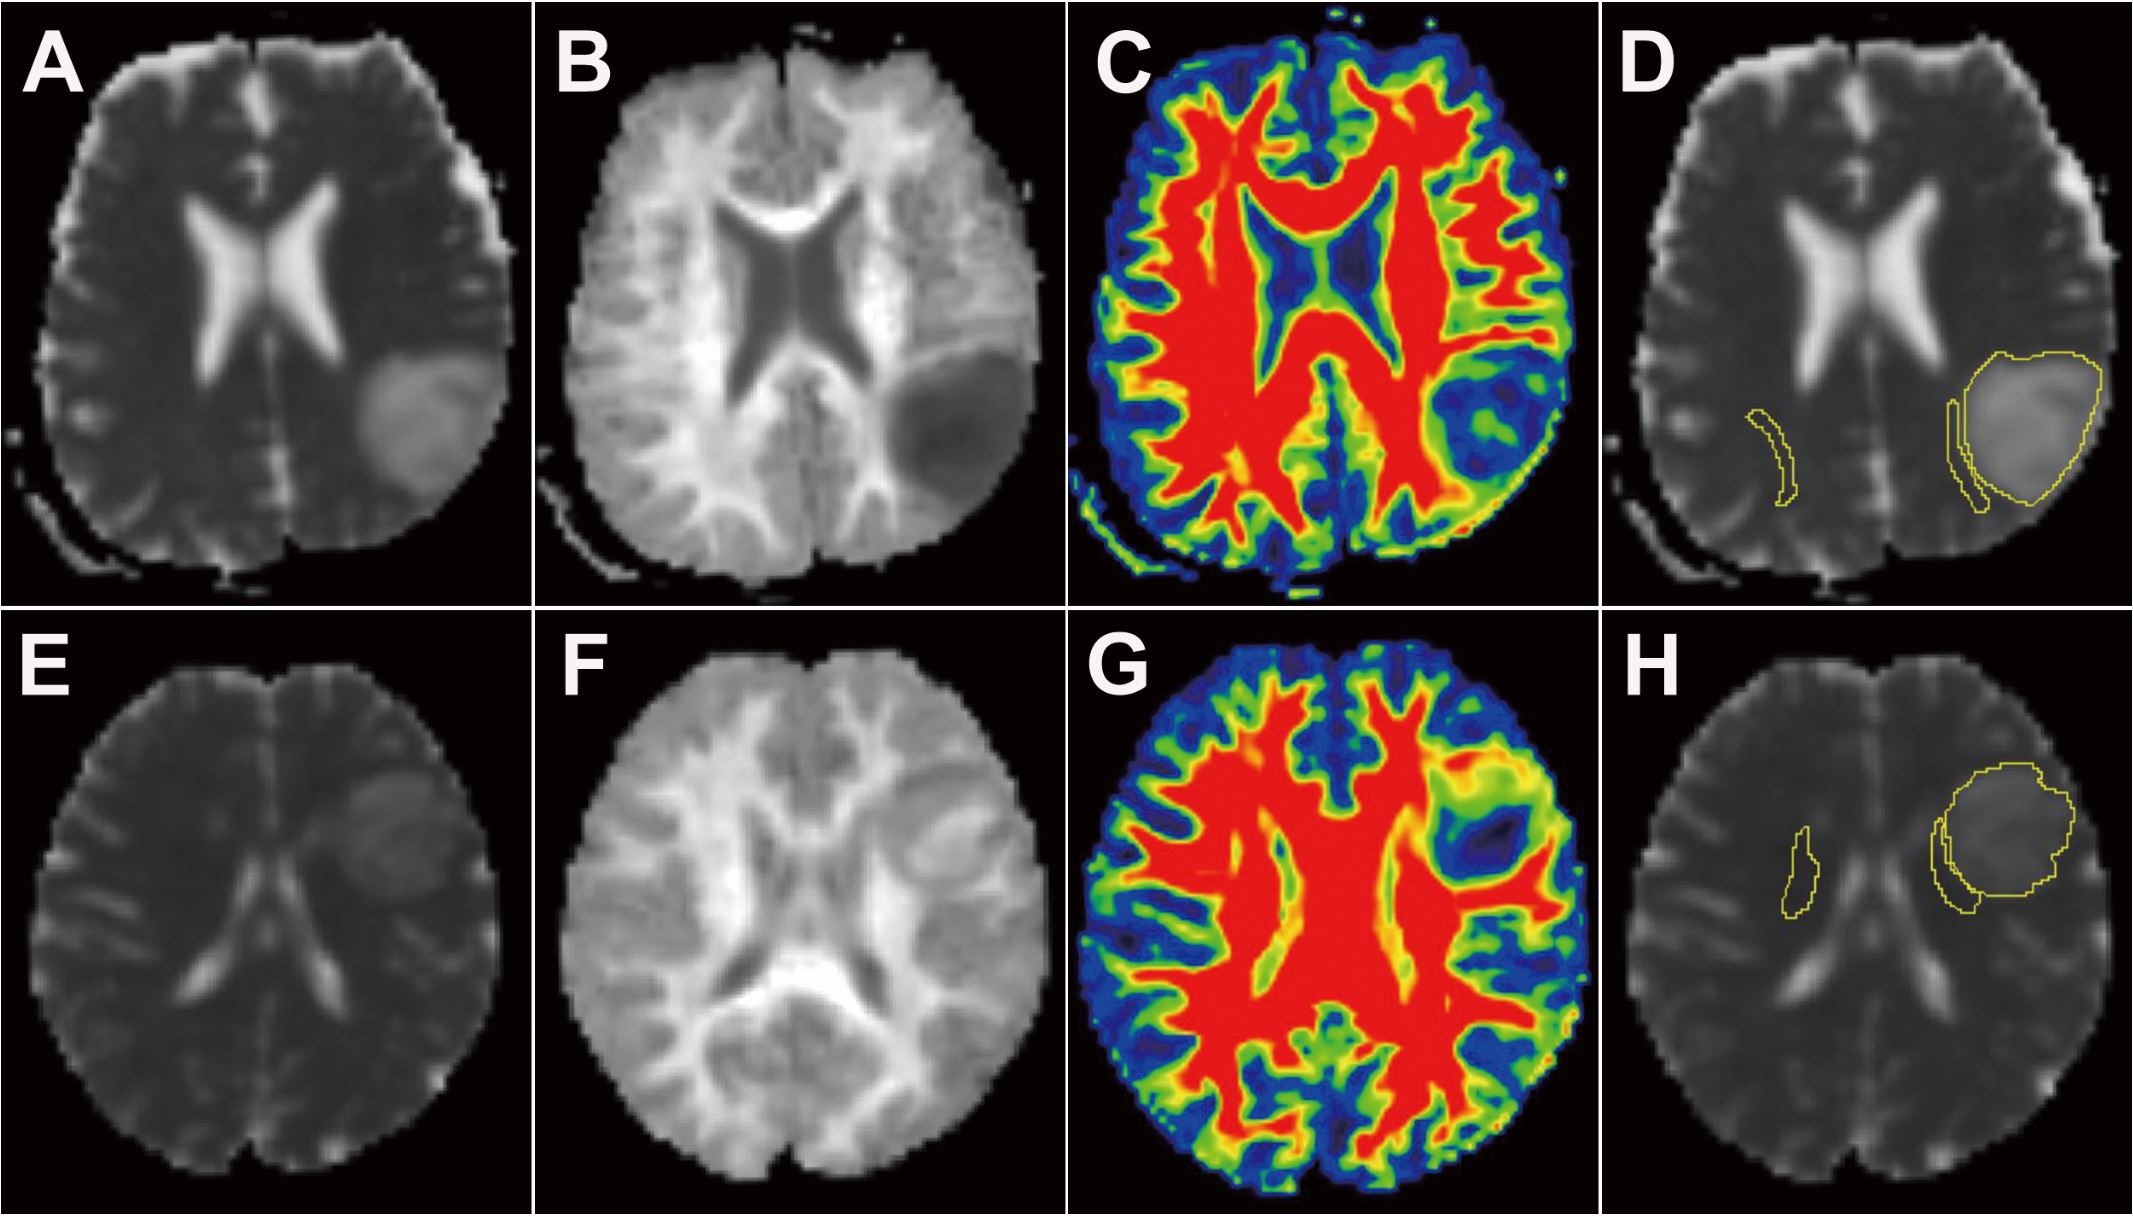
Forty-five suspected low-grade gliomas were enrolled in this study, all participants underwent 3T MR scanner (Skyra, Siemens, Erlangen, Germany) using a 32-channel phased-array head coil, DKI parameters were as follows: a spin-echo 2D echo-planar imaging sequence was used; b values were 0, 1000, 2000 s/mm2, with 30 diffusion gradient directions; TR 4300 ms; TE 93 ms; slice thickness 2.2 mm; flip angle 90°; pixel size 2.3×2.3 mm2; field of view 20.8×20.8 cm2; bandwidth 1975 Hz/pixel. All DKI data were processed using the Diffusion Kurtosis Estimator (DKE) software. Motion and eddy current distortions were corrected by the Beddy_correct tool in FMRIB’s Diffusion Toolbox (FDT) listed in FSL (version 6.0). The parametric maps estimated by DKE were obtained including MK, MD and FA. The ROIs of glioma were manually drawn on MD maps in the slice where the tumor was maximum, covering the whole foci. To evaluate the alterations in adjacent white matter tracts, crescent-shaped ROIs were placed in the pWM, and contralateral normal-appearing white matter (cNAWM) regions as controls, based on FA maps, as shown in Figure 1, and then extracted the MD, MK and FA values. Each ROI was drawn three times at different time points for calculation of DKI parameters, with the average values taken for final statistical analyses. Mean diffusivity (MD), Mean kurtosis (MK) and fractional anisotropy (FA) derived from DKI were evaluated in the tumor foci, perilesional white matter (pWM) and contralateral normal-appearing white matter (cNAWM) regions. Independent samples t-test was performed to compare differences of the DKI parameters calculated from the foci between IDH 1-mutant and wild-type groups, and differences between pWM and cNAWM were analyzed using paired sample t-test.Results
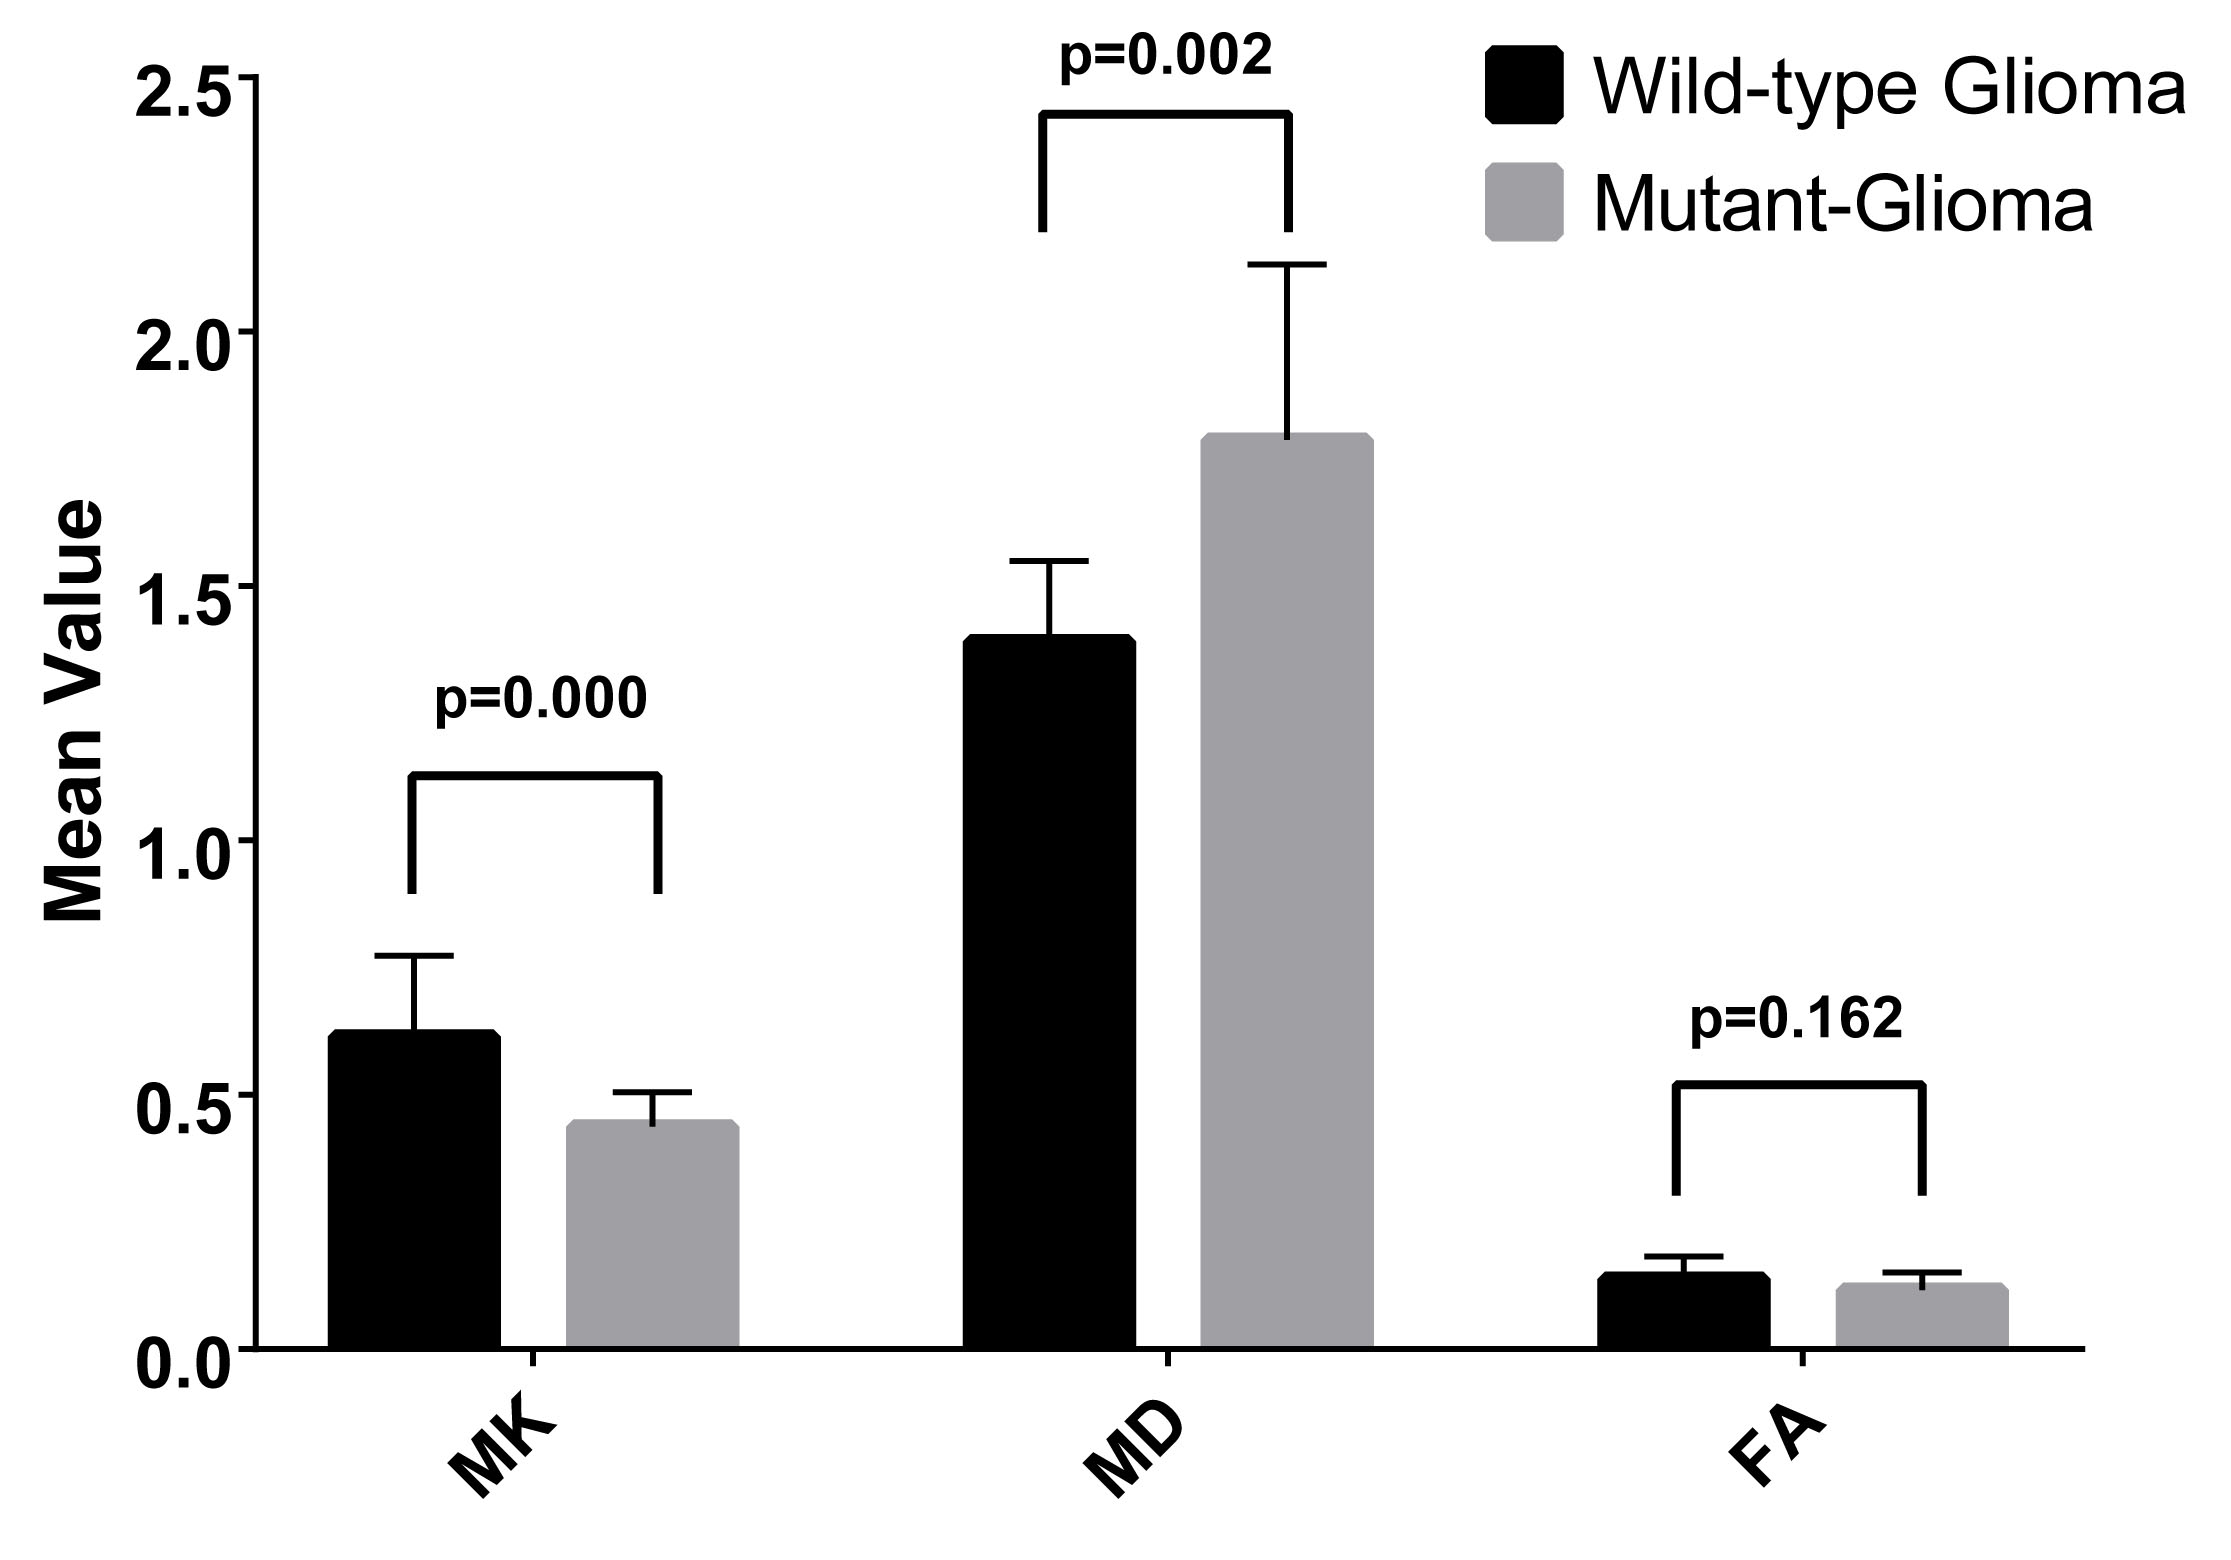
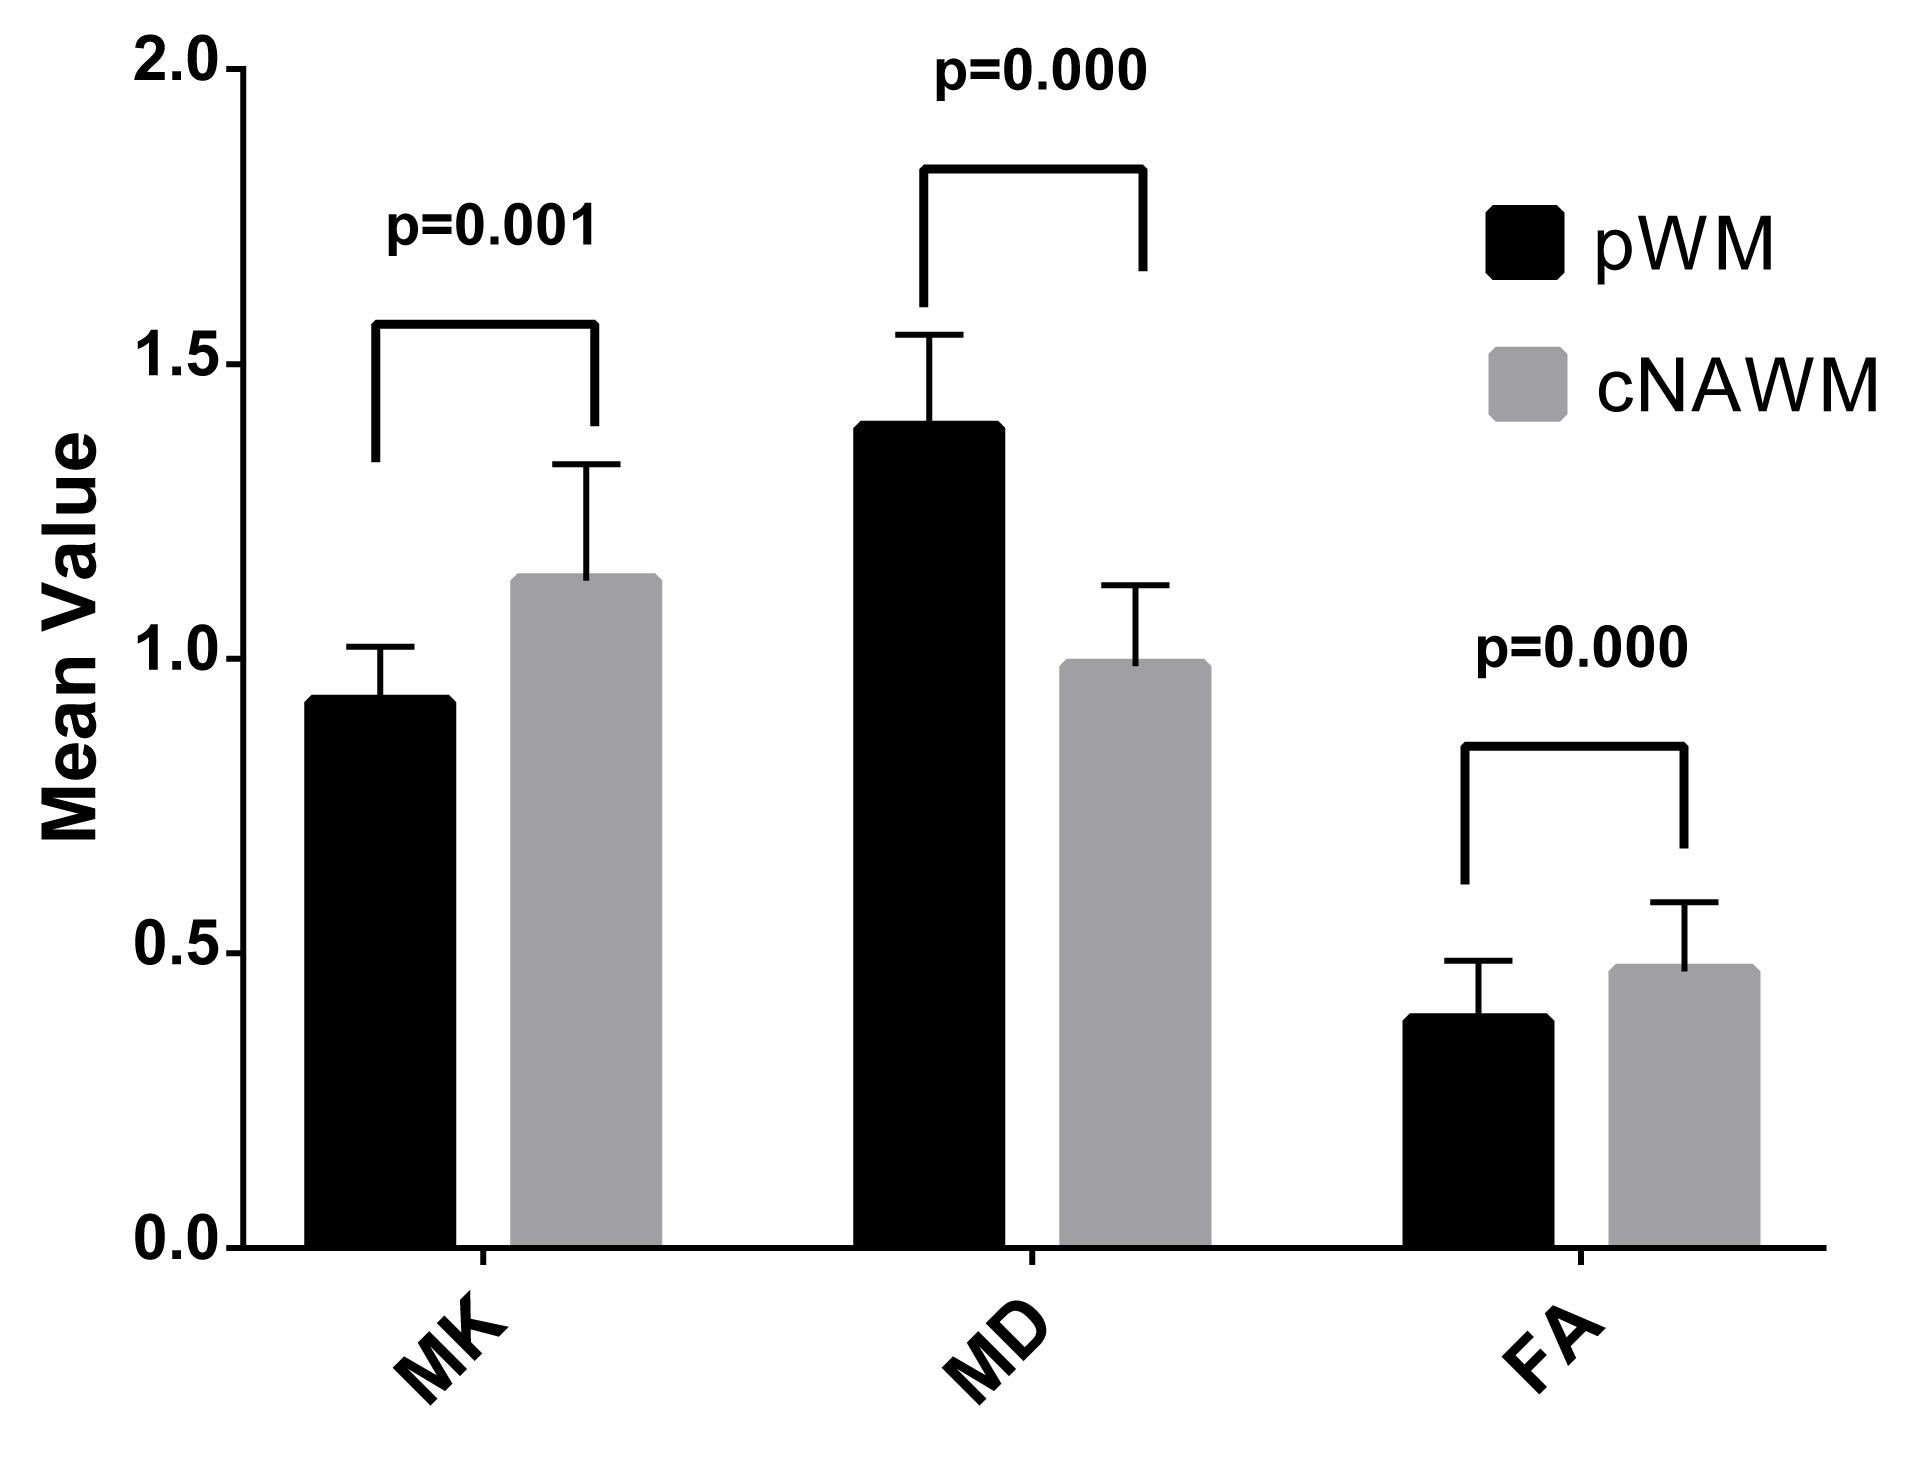
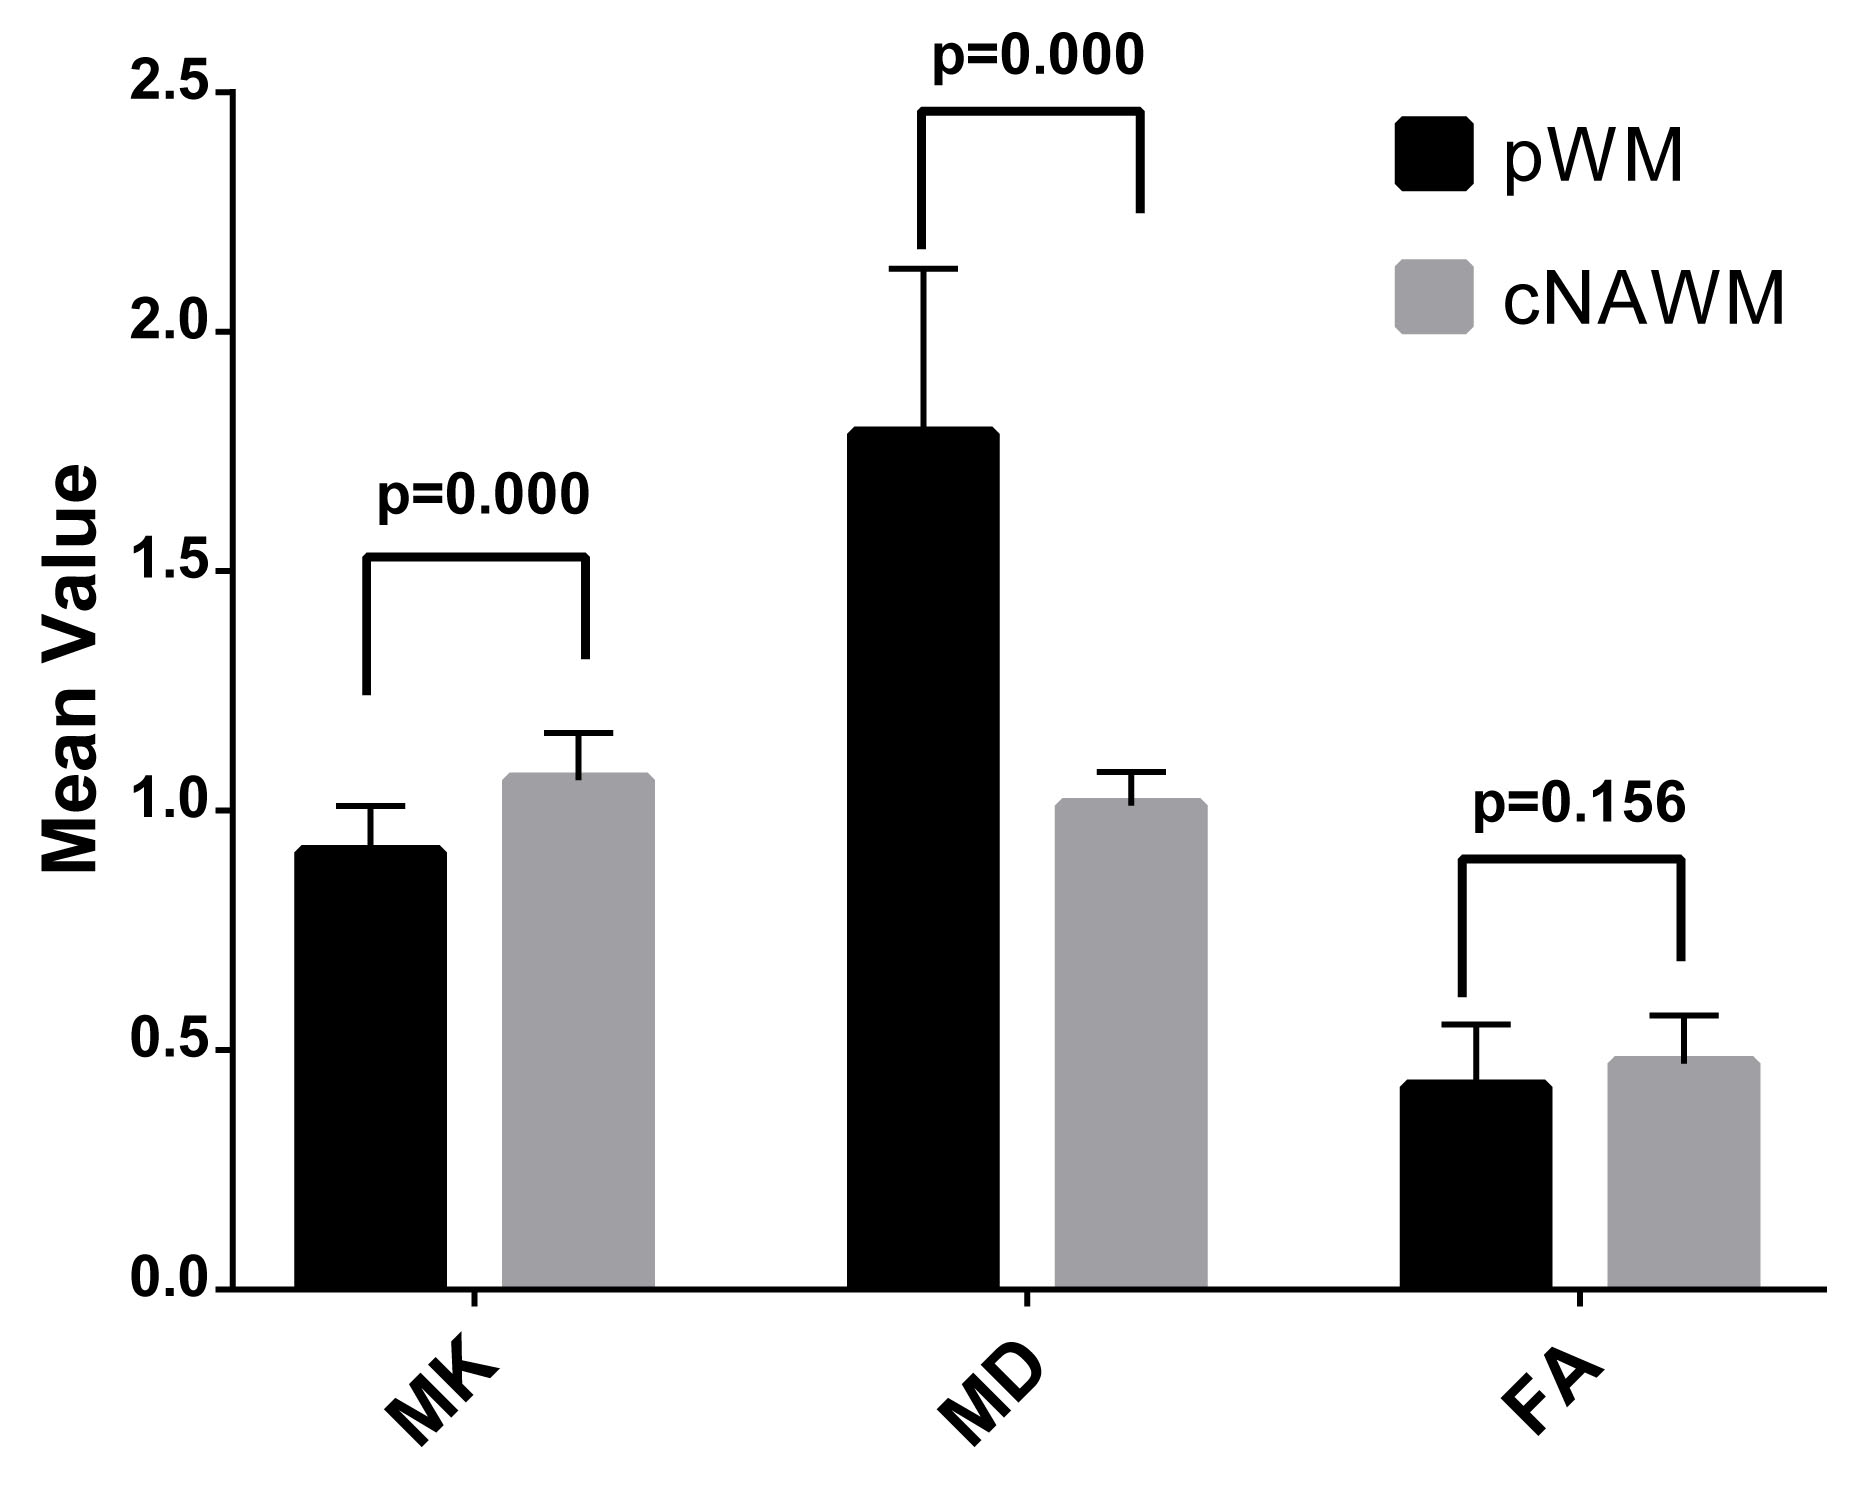
Thirty-eight low-grade gliomas were finally enrolled in this study, including 10 IDH 1 wild-type and 28 mutant cases. MK increased and MD decreased significantly in tumor foci wild-type gliomas compared with mutant-glioma, and both had great predictive value in detecting IDH 1 genotype, while no differences of FA values were observed. MD and MK was significantly different between pWM and cNAWM in gliomas. Intriguingly, there were marked differences of FA values comparing pWM with cNAWM in wild-type gliomas, while no difference was found in mutant-gliomas.Discussion
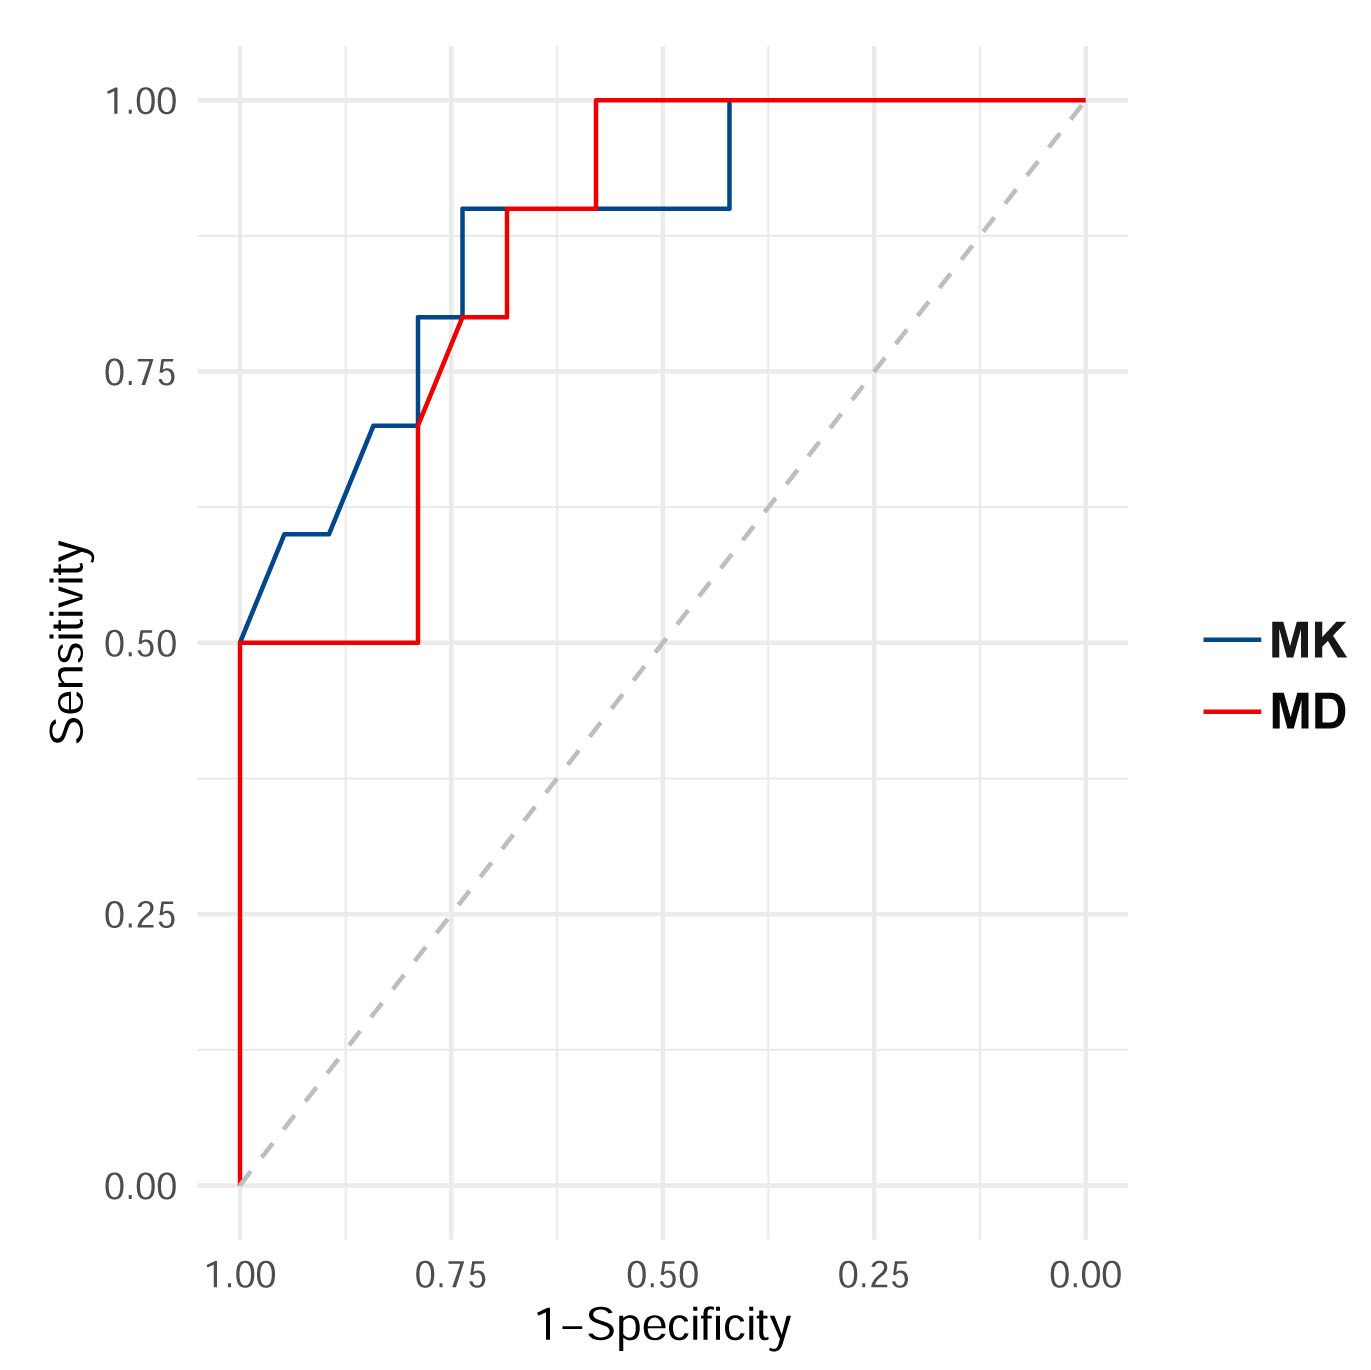
Significant differences of MK and MD values in tumor foci were observed in this study between wild-type and mutant low-grade gliomas, and higher effect sizes (1.54 vs.1.47) were seen for MK values, while no difference was found for FA values. The ROC curve of MK for prediction of IDH 1 genotypes also showed a slightly higher AUC value than that of MD (0.88 vs. 0.86). These results indicate that MK in tumor foci is the most sensitive parameter for evaluation of microstructural alterations and differentiation of IDH 1 genotype in low-grade gliomas, and this is in line with previous studies (6-8). The significant decrease of MK in the foci of mutant gliomas compared with wild-type can be regarded as a sign of decreased microstructural complexity, and maybe attributed to increase of water content caused by more pronounced inflammation, demyelination, or axonal disorganization (9). Glioma tends to infiltrate along the white matter (10), our results showed that significantly increased MK and decreased MD values of pWM compared to cNAWM in both wild-type and mutant gliomas, which is in agreement with previous research results (11-13). Dramatically, no FA change was found between pWM and cNAWM in mutant gliomas, but a conspicuous FA decrease was observed for pWM in wild-type patients. The decreased FA values hint axonal damage and fiber disruption (14,15), indicating a less preserved microstructural fiber integrity in pWM of wild-type patients, which is in line with a prior study (16). These results further certified the greater infiltrative nature in IDH 1 wild-type gliomas (12,16).Conclusions
Higher MK and lower MD values of tumor foci were found in IDH 1 wild-type gliomas compared with IDH 1 mutant patients. MD and MK values were significantly different between pWM and cNAWM in both IDH 1 wild-type- and mutant-gliomas, lower FA in pWM was seen in wild-type gliomas, while no difference was found in mutant cases. MK and MD from the tumor foci region were with comparable sensitivity for differentiation of IDH 1 wild-type and mutant low-grade gliomas, and FA alteration in the pWM region may also help distinguish these two genotypes.Acknowledgements
This study was financially supported by Natural Science Foundation of Shandong (Grant No. ZR201911120706).References
1. Sanson M, Marie Y, Paris S, et al. Isocitrate dehydrogenase 1 codon 132 mutation is an important prognostic biomarker in gliomas. Journal of clinical oncology : official journal of the American Society of Clinical Oncology 2009;27(25):4150-4154.
2. Yan H, Parsons DW, Jin G, et al. IDH1 and IDH2 mutations in gliomas. N Engl J Med 2009;360(8):765-773.
3. Bush NA, Butowski N. The Effect of Molecular Diagnostics on the Treatment of Glioma. Curr Oncol Rep 2017;19(4):26.
4. Kang Y, Choi SH, Kim YJ, et al. Gliomas: Histogram analysis of apparent diffusion coefficient maps with standard- or high-b-value diffusion-weighted MR imaging--correlation with tumor grade. Radiology 2011;261(3):882-890.
5. Szczepankiewicz F, van Westen D, Englund E, et al. The link between diffusion MRI and tumor heterogeneity: Mapping cell eccentricity and density by diffusional variance decomposition (DIVIDE). Neuroimage 2016;142:522-532.
6. Zhao J, Wang Y-l, Li X-b, et al. Comparative analysis of the diffusion kurtosis imaging and diffusion tensor imaging in grading gliomas, predicting tumour cell proliferation and IDH-1 gene mutation status. Journal of Neuro-Oncology 2018;141(1):195-203.
7. Goryawala MZ, Heros DO, Komotar RJ, Sheriff S, Saraf-Lavi E, Maudsley AA. Value of diffusion kurtosis imaging in assessing low-grade gliomas. J Magn Reson Imaging 2018;48(6):1551-1558.
8. Hempel JM, Bisdas S, Schittenhelm J, et al. In vivo molecular profiling of human glioma using diffusion kurtosis imaging. J Neurooncol 2017;131(1):93-101.
9. Winston GP. The physical and biological basis of quantitative parameters derived from diffusion MRI. Quant Imaging Med Surg 2012;2(4):254-265.
10. Swanson KR, Alvord EC, Jr., Murray JD. A quantitative model for differential motility of gliomas in grey and white matter. Cell Prolif 2000;33(5):317-329.
11. Martin Soberón MC, Sepulveda Sanchez JMM, Gargini R, et al. Study of tumor infiltrating immune CELLS and vasculature in human gliomas: Differences in IDH1/2 mutant versus IDH1/2WT tumors. Journal of Clinical Oncology 2019;37(15_suppl):2030-2030.
12. Aliotta E, Batchala PP, Schiff D, et al. Increased intratumoral infiltration in IDH wild-type lower-grade gliomas observed with diffusion tensor imaging. J Neurooncol 2019;145(2):257-263.
13. Price SJ, Allinson K, Liu H, et al. Less Invasive Phenotype Found in Isocitrate Dehydrogenase-mutated Glioblastomas than in Isocitrate Dehydrogenase Wild-Type Glioblastomas: A Diffusion-Tensor Imaging Study. Radiology 2017;283(1):215-221.
14. Kallenberg K, Goldmann T, Menke J, et al. Glioma infiltration of the corpus callosum: early signs detected by DTI. J Neurooncol 2013;112(2):217-222.
15. Wagner MW, Bell WR, Kern J, et al. Diffusion tensor imaging suggests extrapontine extension of pediatric diffuse intrinsic pontine gliomas. Eur J Radiol 2016;85(4):700-706.
16. Jütten K, Mainz V, Gauggel S, et al. Diffusion Tensor Imaging Reveals Microstructural Heterogeneity of Normal-Appearing White Matter and Related Cognitive Dysfunction in Glioma Patients. Front Oncol 2019;9:536.
Figures