3919
Conventional MRI Texture Analysis to Predict Proliferative Behaviour in Gliomas1First Affiliated Hospital of Dalian Medical University, Dalian, China, 2GE Healthcare, MR Research China, Beijing, China
Synopsis
To evaluate the application value of texture analysis based on conventional MRI for predicting the cell proliferation status of glioma. Patients with glioma were divided into two groups by Ki-67, group 1 was Ki-67 less than or equal to 10% and group 2 was Ki-67 more than 10%. The texture feature value of T1WI, T2WI, and contrasted T1WI were obtained by Omni-Kinetics software. The texture features of three sequences were significantly different between two groups, and uniformity and correlation showed better diagnostic efficiency. So the texture analysis based on conventional MRI is useful to predicting cell proliferation status of glioma.
Introduction
To evaluate the application value of texture analysis based on conventional MRI for predicting the cell proliferation status of glioma.Methods
A total amount of 62 patients with glioma were enrolled this retrospectively analyzed. To be specific, the patients were divided into two groups by immunohistochemical index, that is Ki-67, group 1 was consisted of 24 patients with Ki-67 less than or equal to 10% (14 males and 10 females; mean age: 44.38±11.27 years), and group 2 was consisted of 38 patients with Ki-67 more than 10% (21 males and 17 females; mean age: 55.97±12.50 years). Conventional MRI of all patients, including T1WI, T2WI, and contrasted T1WI were imported into Omni-Kinetics software, where ROIs containing tumor parenchyma were manually depicted along the edge of tumor on each layer of image, the ROIs of all layers were merged into a 3D ROI. The texture features of 3D ROI were automatically obtained. Independent t test was used for comparison between two groups. ROC curve was used to evaluate the diagnostic efficiency of the features.Results
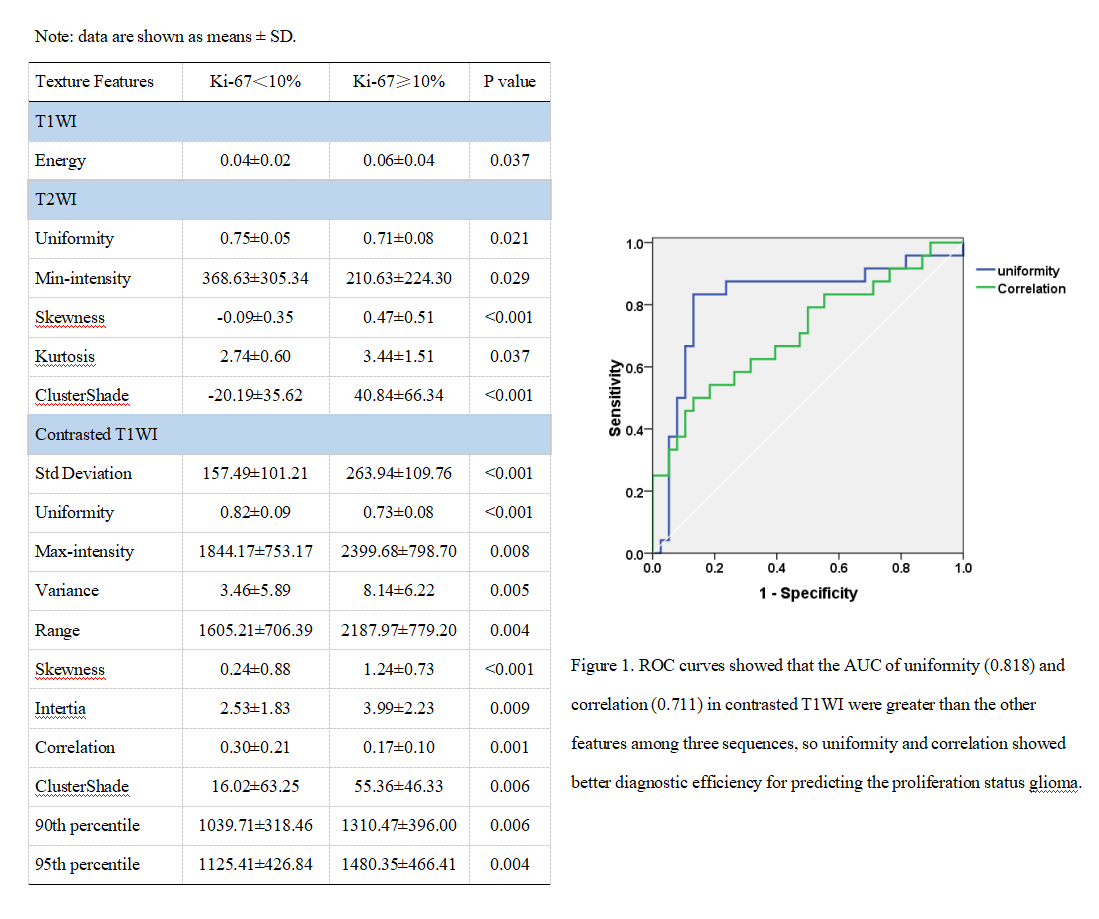
In the texture features of T1WI, the energy (P=0.037) are significantly different between two groups, the energy was higher in group 2. In the texture features of T2WI, the min-intensity (P=0.029), skewness (P<0.001), kurtosis (P=0.037), uniformity (P=0.021), and cluster shadow (P<0.001) were significantly different between two groups, the average value of features were higher in group 2, except for min-intensity and uniformity. In the texture features of contrasted T1WI, the max-intensity (P=0.008), std-deviation (P<0.001), variance (P=0.005) , skewness (P<0.001), uniformity (P<0.001), quantile 90 (P=0.006), quantile 95 (P=0.004), intertia (P=0.009), correlation (P=0.001) and cluster shadow (P=0.006) were significantly different between two groups, the average value of features were higher in group 2, except for uniformity and correlation.ROC curves showed that the AUC of uniformity (0.818) and correlation (0.711) in contrasted T1WI texture features were greater than the other features among three sequences, so uniformity and correlation showed better diagnostic efficiency for predicting the proliferation status glioma.
Discussion
The average values of the three sequences of texture features were generally higher in group 2 than group 1, and the tumor cell proliferation ability of the group 2 was stronger, indicating that the value of the texture features could reflect the proliferation ability of cells to some extent. The texture features of the three sequences show that the image signal intensity of the group 2 changes greatly and the signal is relatively heterogeneous, which may be related to the higher-proliferative tumor with more hemorrhage or necrosis 1,2.Conclusions
The texture analysis based on conventional MRI is useful to predicting cell proliferation status of glioma. Uniformity and correlation are preferable features to help us evaluating glioma proliferation status.Acknowledgements
no acknowledgements.References
1. Soni N, Priya S, Bathla G. Texture Analysis in Cerebral Gliomas: A Review of the Literature. AJNR Am J Neuroradiol. 2019;40(6):928-934.
2. Chen WJ1, He DS, Tang RX, et al. Ki-67 is a valuable prognostic factor in gliomas: evidence from a systematic review and meta-analysis. Asian Pac J Cancer Prev. 2015;16(2):411-20.
Figures