3913
Structural and Functional Changes in Patients with Lower Grade Tumors Receiving Partial Brain Radiotherapy: A Longitudinal Study1Biomedical Engineering, University of Rochester, Rochester, NY, United States, 2Physics and Astronomy, University of Rochester, Rochester, NY, United States, 3Imaging Sciences, University of Rochester, Rochester, NY, United States, 4Neurology, University of Rochester, Rochester, NY, United States, 5Radiation Oncology, University of Rochester, Rochester, NY, United States, 6Surgery, University of Rochester, Rochester, NY, United States
Synopsis
Patients receiving partial brain radiotherapy (RT) experience cognitive impairment. Determining what structures and networks in the brain are susceptible to RT will help to elucidate mechanisms of cognitive impairment in the setting of RT. In this abstract, we examine structural and functional changes before and 6 months post RT in patients with lower grade brain tumors. Further, graph theory analysis of functional connectivity (FC) data was used to investigate network topology. We found that subcortical volume and local graph theory metrics were significantly correlated with RT dose. We also propose a putative link between volumetric changes and network topology.
Purpose
Patients receiving partial cranial radiation therapy (RT) often experience cognitive impairment1-3. Previous studies have shown cranial RT is associated with dose-dependent atrophy of the cortex4, hippocampus5, and amygdala6. Clinical trials have shown that reduction of RT dose to the hippocampus reduces cognitive decline7,8. Elucidating other structures and functional networks in the brain that are susceptible to RT will help to improve and guide treatment planning, aid in development of dose constraints, and other strategies to mitigate cognitive effects due to RT. However, studies examining functional connectivity (FC) in the setting of RT remain limited9. In this study we use graph theory analysis of resting state functional MRI (rs-fMRI) data to determine the effect of RT dose exposure on network topology in patients receiving RT.Methods
As part of an observational study, 19 subjects with low-grade or benign brain tumors (mean age std: 56.83 ± 16.94, range: 30.14-88.14) were enrolled to evaluate the impact of RT on cognition. All subjects received partial brain RT, either hypofractionated(>2 Gy/fraction) or fractionated(1.8-2 Gy/fraction). They underwent a battery of neurocognitive tests and MRI, at baseline and 6 months follow-up after RT. All images were acquired on a 3T GE Discovery 750 MRI system (Chicago, IL, USA) equipped with an 8-channel head coil. T1-weighted (T1w) structural images are acquired using a 3D BRAVO FSPGR sequence (TR/TE=8200/3.2ms, 1x1x1 mm3 ). Resting state fMRI (rs-fMRI) was acquired using a BOLD GE-EPI sequence (TR/TE=2000/30ms, 3x3x3 mm3, 150 volumes). CT images and an RT structure set were also acquired for each subject.The RT-dose maps were scaled and co-registered with CT images and T1w MRI using pydicom (https://github.com/pydicom/pydicom). Structural images were co-registered with CT images and RT dose maps. Brain tumors were masked using the gross target volume (GTV), delineated on planar MRI and CT imaging. Cortical thickness and subcortical volume were estimated using Freesurfer (version 6.0.0; https://surfer.nmr.harvard.edu) using the tumor masked T1w images10. The pipeline was run independently for each time point (pre-RT and 6 months post RT). Subcortical volume was normalized by the total intracranial volume (ICV) prior to further analyses. The fMRI data was processed independently for each time point using FMRI Expert Analysis Tool (FEAT, version 6.00, part of FSL, http://fsl.fmrib.ox.ac.uk/fsl)11. After preprocessing, ICA-based decomposition and classification were performed using MELODIC12 and FSL FIX (FMRIB’s ICA-based Xnoiseifier)13,14. Subject specific parcellations (without tumor) were used to extract the mean BOLD time series for each region of interest (ROI). Subject specific correlation matrices were then generated in MATLAB. Graph theory analysis was then used to evaluate differences between pre and post-RT using the Brain Connectivity Toolbox (BCT, https://sites.google.com/site/bctnet/)15.
To calculate the mean RT dose to each ROI, subject specific parcellations were registered to CT space. The 2 Gy/fraction equivalent dose (EQD2) was calculated using the linear quadratic model, with an ratio equal to 3, to model the radiosensitivity of normal brain tissue16. Correlation analyses between each imaging metric and EQD2 was performed using the non-parametric Spearman’s Rho. Linear mixed effects models were performed for subcortical structures including age and dose as fixed effects, and subject as a random effect. Multivariate regression was performed for global metrics including age as a covariate. All analyses were performed in R17.
Results
Subject demographic data are provided in Table 1. Correlations between global graph theory metrics and EQD2 show a moderate inverse relationship (Figure 1). In a multiple regression model there was a significant interaction between RT dose and patient age (Global Efficiency: p =0.0162; Transitivity: p =0.0239). Local efficiency and clustering coefficient also exhibit a dose dependent decrease with EQD2 (Figure 2a and Figure 2b, respectively). Subcortical volume was negatively correlated with EQD2 for every ROI (Figure 3). Results of linear mixed effects models and multivariate analyses are reported in Table 2. For all significant ROIs there was an inverse relationship between dose and imaging metric.Discussion
Here we reported structural and FC analyses, in a cohort of patients with benign and lower grade gliomas receiving RT. Our findings from structural analysis are consistent with those previously reported by others5,6. Using graph theory analysis of FC data we showed that there are dose dependent effects on measures of network topology. Local efficiency is an indication of how effectively information is integrated by the local network around a node (ROI). The clustering coefficient is reflective of the small-worldness, or integration, of a brain network18. This suggests that cranial RT results in atrophy of surrounding normal brain tissue, resulting in more diffuse brain network topology, which may explain the cognitive impairment seen in the setting of cranial RT. Additionally, our findings suggest that network changes may serve as an early marker of cognitive decline in the setting of cranial RT.Conclusion
In this preliminary analysis we showed that measures of FC and subcortical volume exhibit a dose dependent relationship with RT. Our findings suggests RT results in atrophy and altered brain network topology, which may explain cognitive impairment in the setting of cranial RT. Future analyses will investigate changes in FC with neurocognitive testing.Acknowledgements
This work was supported by the NIH (DP2195765) and CTSI Trainee grantReferences
1. Greene-Schloesser D, Robbins ME. Radiation-induced cognitive impairment--from bench to bedside. Neuro Oncol. 2012;14 Suppl 4:iv37-44.
2. Greene-Schloesser D, Moore E, Robbins ME. Molecular pathways: radiation-induced cognitive impairment. Clin Cancer Res. 2013;19(9):2294-2300.
3. Surma-aho O, Niemela M, Vilkki J, et al. Adverse long-term effects of brain radiotherapy in adult low-grade glioma patients. Neurology. 2001;56(10):1285-1290.
4. Karunamuni R, Bartsch H, White NS, et al. Dose-Dependent Cortical Thinning After Partial Brain Irradiation in High-Grade Glioma. Int J Radiat Oncol Biol Phys. 2016;94(2):297-304.
5. Seibert TM, Karunamuni R, Bartsch H, et al. Radiation Dose-Dependent Hippocampal Atrophy Detected With Longitudinal Volumetric Magnetic Resonance Imaging. Int J Radiat Oncol Biol Phys. 2017;97(2):263-269.
6. Huynh-Le MP, Karunamuni R, Moiseenko V, et al. Dose-dependent atrophy of the amygdala after radiotherapy. Radiother Oncol. 2019;136:44-49.
7. Gondi V, Tolakanahalli R, Mehta MP, et al. Hippocampal-sparing whole-brain radiotherapy: a "how-to" technique using helical tomotherapy and linear accelerator-based intensity-modulated radiotherapy. Int J Radiat Oncol Biol Phys. 2010;78(4):1244-1252.
8. Ma TM, Grimm J, McIntyre R, et al. A prospective evaluation of hippocampal radiation dose volume effects and memory deficits following cranial irradiation. Radiother Oncol. 2017;125(2):234-240.
9. Duffau H. Why brain radiation therapy should take account of the individual structural and functional connectivity: Toward an irradiation "a la carte". Crit Rev Oncol Hematol. 2020;154:103073.
10. Fischl B. FreeSurfer. Neuroimage. 2012;62(2):774-781.
11. Woolrich MW, Ripley BD, Brady M, Smith SM. Temporal autocorrelation in univariate linear modeling of FMRI data. Neuroimage. 2001;14(6):1370-1386.
12. Beckmann CF, Smith SM. Probabilistic independent component analysis for functional magnetic resonance imaging. IEEE Trans Med Imaging. 2004;23(2):137-152.
13. Salimi-Khorshidi G, Douaud G, Beckmann CF, Glasser MF, Griffanti L, Smith SM. Automatic denoising of functional MRI data: combining independent component analysis and hierarchical fusion of classifiers. Neuroimage. 2014;90:449-468.
14. Griffanti L, Salimi-Khorshidi G, Beckmann CF, et al. ICA-based artefact removal and accelerated fMRI acquisition for improved resting state network imaging. Neuroimage. 2014;95:232-247.
15. Rubinov M, Sporns O. Complex network measures of brain connectivity: uses and interpretations. Neuroimage. 2010;52(3):1059-1069.
16. van Leeuwen CM, Oei AL, Crezee J, et al. The alfa and beta of tumours: a review of parameters of the linear-quadratic model, derived from clinical radiotherapy studies. Radiat Oncol. 2018;13(1):96.
17. R Core Team (2020). R: A language and environment for statistical computing. R Foundation for Statistical Computing, Vienna, Austria.
18. Sporns O. Structure and function of complex brain networks. Dialogues Clin Neurosci. 2013;15(3):247-262.
Figures
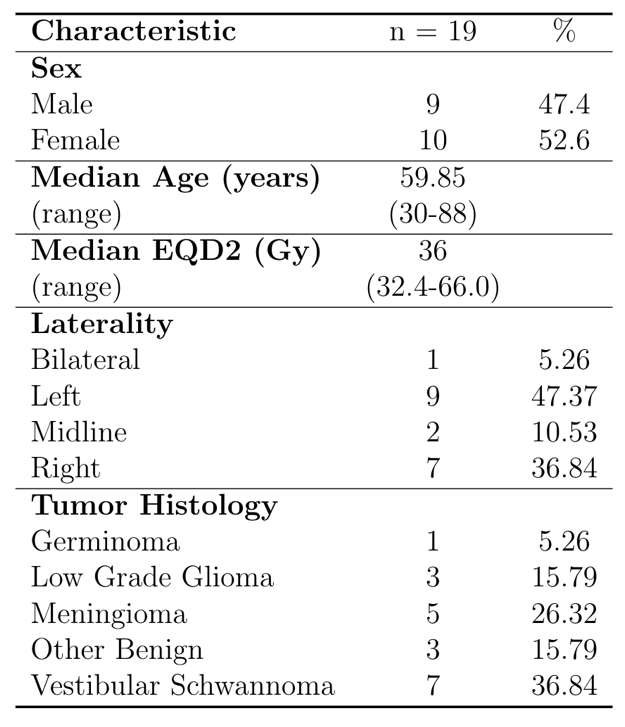
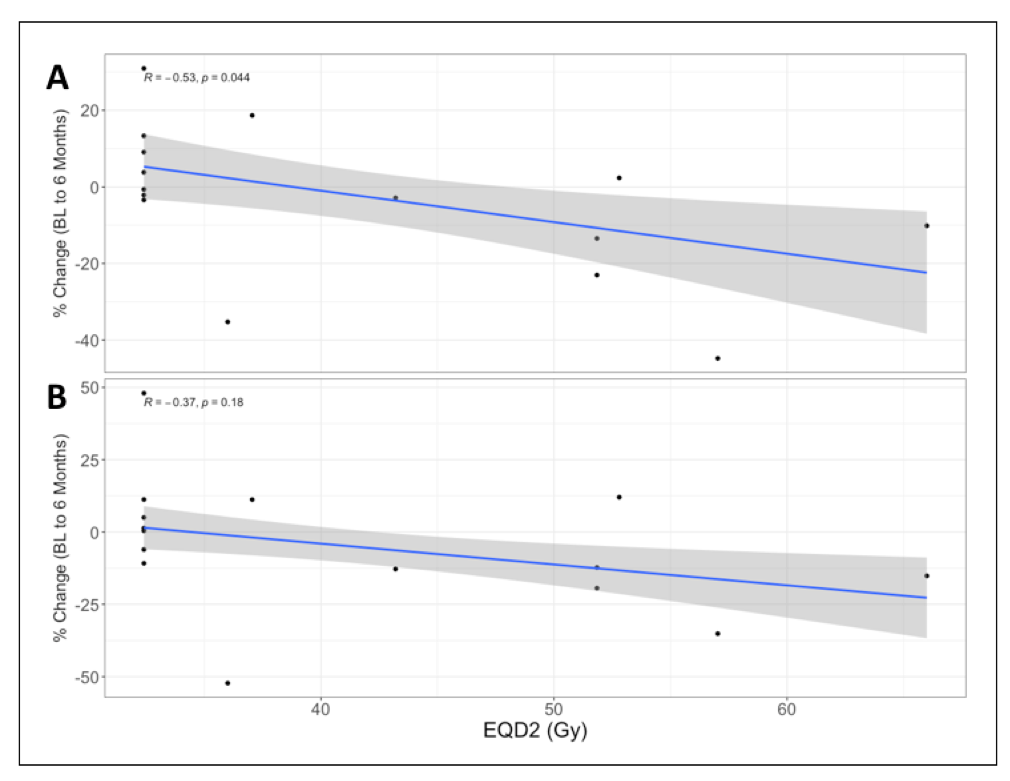
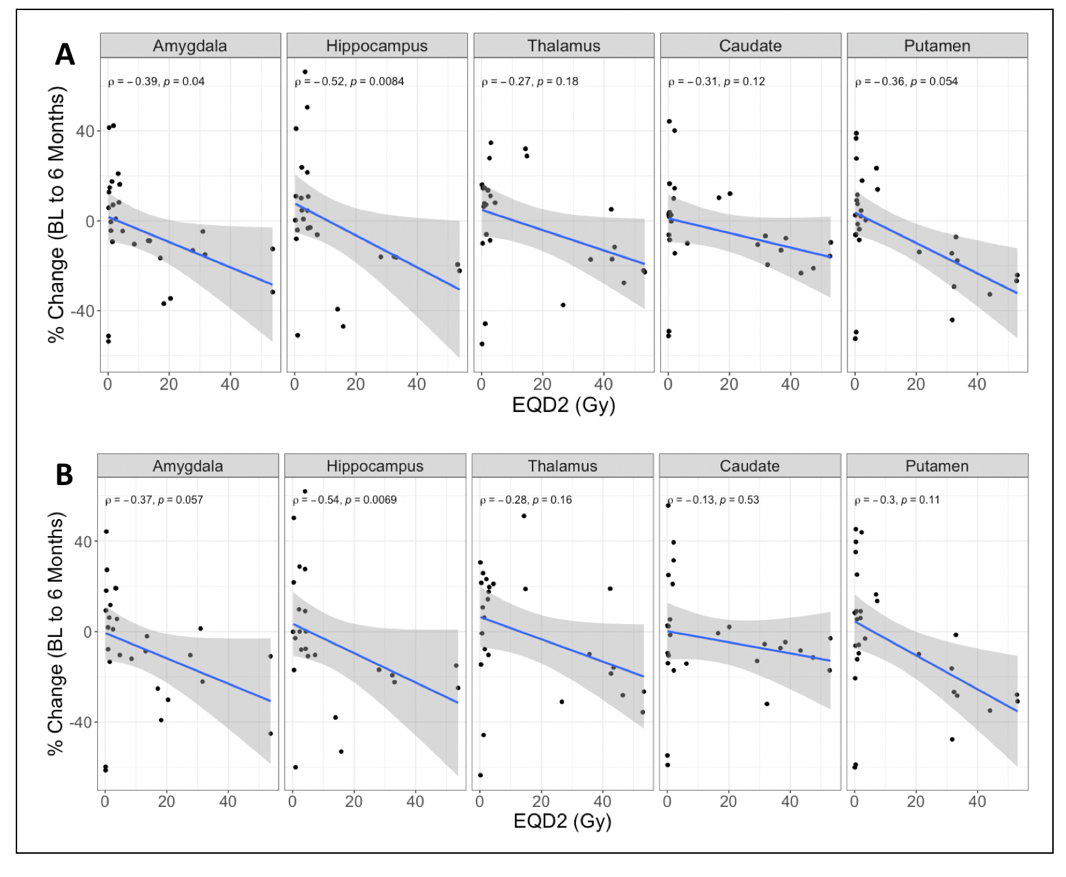
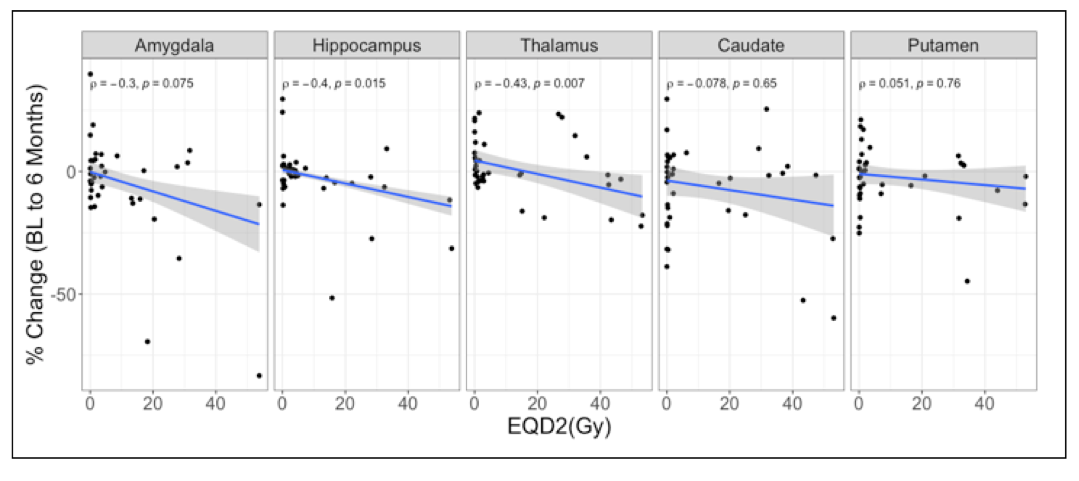
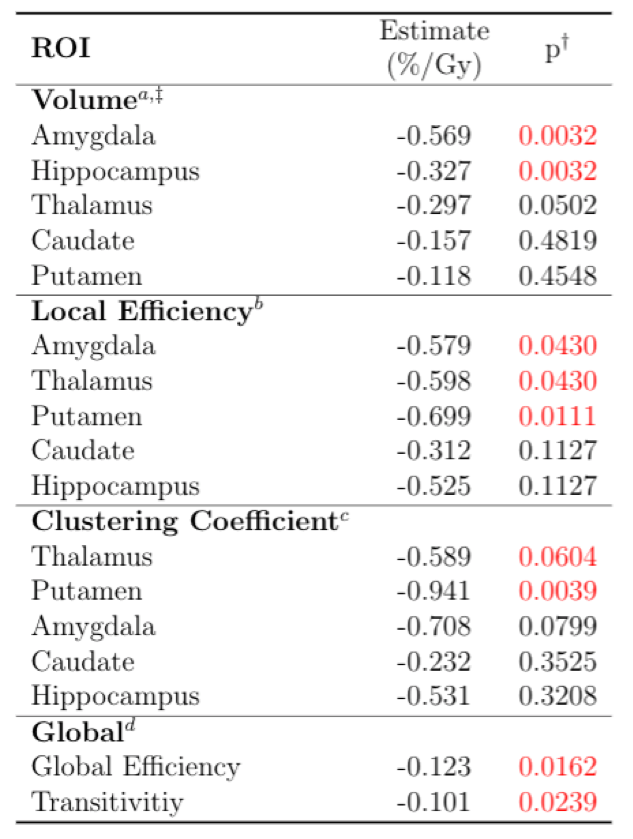
Table 2. Linear mixed-effects model of the effect of dose on apercent volume change, bLocal Efficiency, cClustering Coefficient, and dGlobal graph theory metrics.
†Benjamini-Hochberg adjusted p-value from linear mixed effects model (two-sided t-test).
‡Percent change in volume, 6 months after the start of radiation therapy, reported as percent change from pre-radiotherapy as baseline.