3912
Vascular input function measurement in brain tumor DCE-MRI: a comparison of arterial and venous sinus based approaches1DIIDS, University of Manchester, Manchester, United Kingdom, 2Neurosurgery, Salford Royal NHS Foundation Trust, Manchester, United Kingdom, 3University of Manchester, Manchester, United Kingdom
Synopsis
Accurate derivation of a vascular input function (VIF) is essential for pharmacokinetic modeling of brain DCE-MRI data. In this patient study we compared VIFs extracted from either the internal carotid artery (ICA) and its branches or the superior sagittal sinus (SSS). We demonstrate that plasma gadolinium based contrast-agent (GBCA) concentration-time curves during the 1st-pass of the bolus are equivalent in shape in both the ICA and SSS; and that compared to large intracranial arteries the SSS is able to provide a superior global VIF, with lower noise, higher peak-amplitude and demonstrably greater sensitivity to inter-individual changes in plasma GBCA concentration.
INTRODUCTION
Accurate measurement of a vascular input function (VIF) is essential for pharmacokinetic modeling of DCE-MRI data in brain tumors but direct measurement of a VIF from small blood-vessels supplying the tumor is often impractical. Large intracranial arteries such as the internal carotid artery (ICA) and venous structures such as the superior sagittal sinus (SSS) are therefore often used as a surrogate global VIF measurement but the optimum site for this VIF estimation in brain DCE-MRI is debated1–6. The purpose of this study was to therefore compare features of VIFs extracted from either the ICA and its branches or the SSS in a patient cohort, and evaluate the respective ability of each VIF to accurately capture inter-individual changes in patient dosing and plasma gadolinium based contrast-agent (GBCA) concentration.METHODS
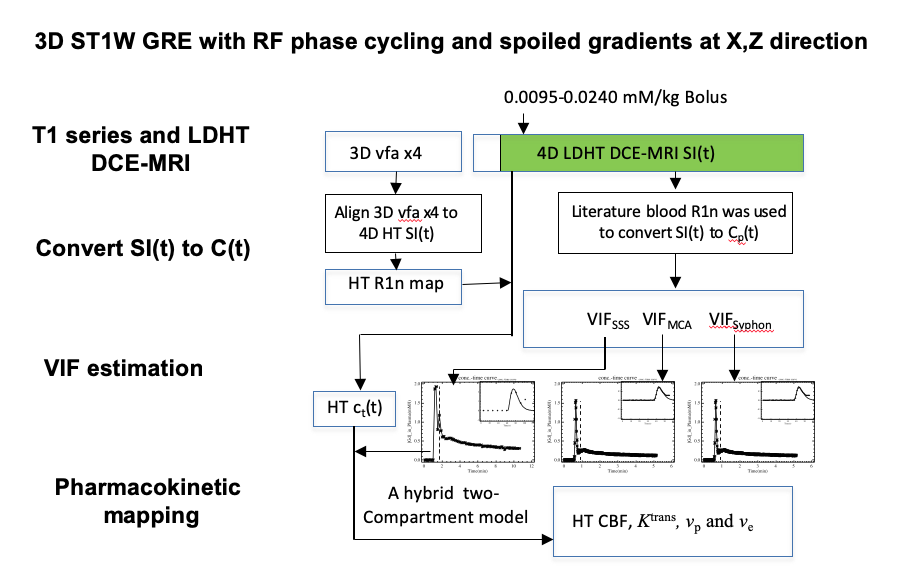
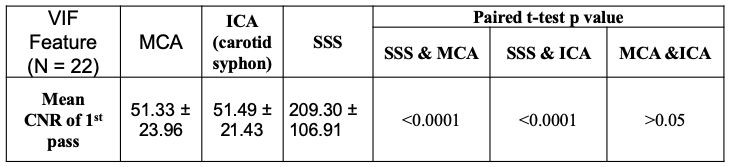
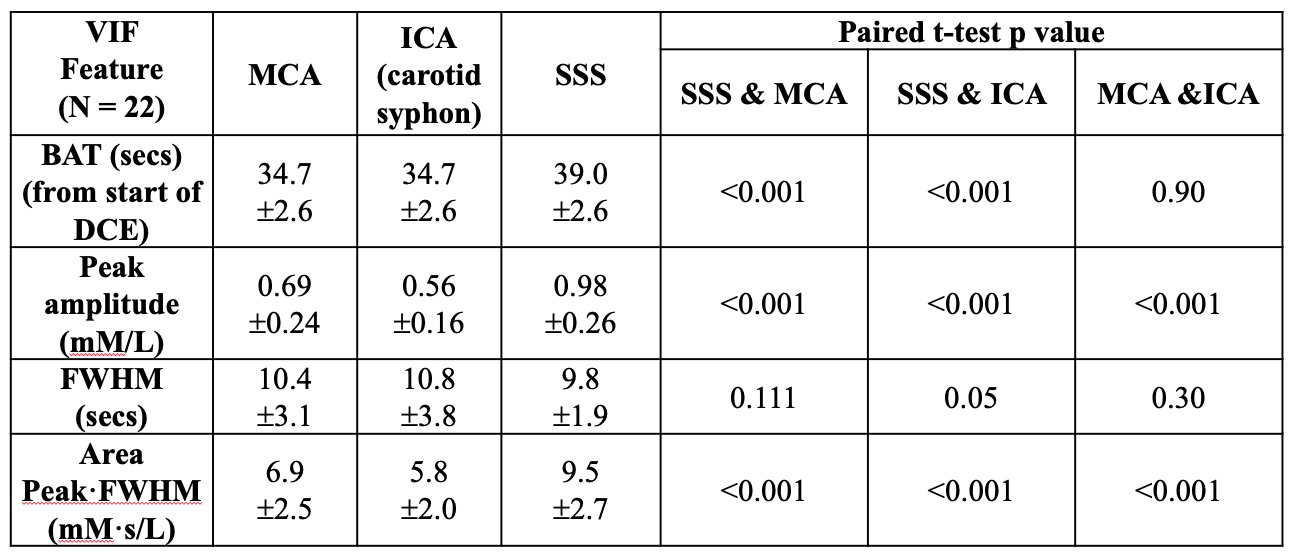
Twenty-two patients with vestibular schwannoma (VS) participated in this study and ethical approval (NHS Health Research Authority, UK) was in place. Data were acquired at 1.5T (Philips Achieva, Philips Medical System, NL) using a previously described dual-injection, dual temporal resolution (DTR) DCE-MRI technique8. Following injection of a low-dose, fixed-volume GBCA pre-bolus a high temporal resolution (LDHT, Δt=1.03 secs) DCE-MRI sequence was performed for VIF estimation. Three patients received a pre-bolus volume of 3 ml and nineteen patients received 2 ml. For each patient the pre-bolus was administered by power injector over one second, followed by a chaser of 20 ml of 0.9% saline administered at the same rate. Plasma GBCA concentration time curves, Cp(t), during the 1st-pass (FP) of the bolus from the LDHT DCE series were subsequently used to extract VIFs at three different sites: 1) vertical segment of the SSS, VIFSSS; 2) vertical segment of the ICA i.e carotid syphon, VIFICA: and 3) horizontal segment of the middle cerebral artery (MCA), VIFMCA. Each VIF was fitted to a gamma variate function to exclude recirculation effects (Figure 1) and the contrast-to-noise ratio (CNR), bolus arrival time (BAT), bolus peak-amplitude, and area (= peak∙FWHM: full-width at half-maximum) of each extracted VIF was derived and compared using paired t-tests. The relationship between extracted VIF features and administered GBCA dose was also assessed using linear regression.RESULTS
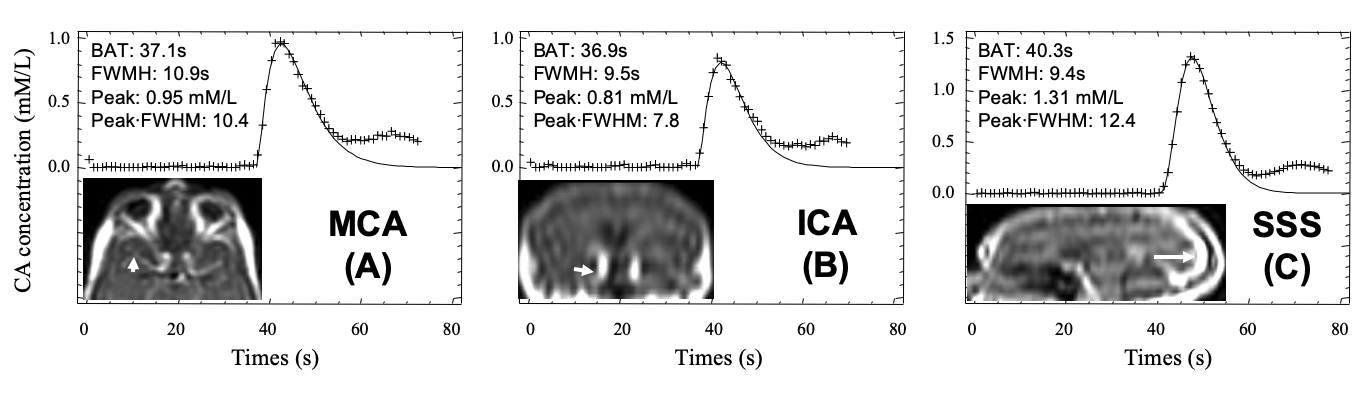
Administered GBCA dose for the pre-bolus ranged from 0.0095 - 0.023 mM/kg (Mean: 0.014±0.004 mM/kg). The CNR of the VIF extracted from the SSS (209.30 ± 106.91) was significantly higher than either the VIFICA (51.49 ± 21.43, p < 0.0001) or VIFMCA (51.33 ± 23.96, p<0.0001, paired t-test, Table 1).Compared to either the VIFICA or VIFMCA, VIFSSS displayed significantly longer BAT (p<0.001), higher peak (p<0.001) and larger area (p<0.001) and a non-significantly narrower FWHM (p>0.05, paired t-test, Table 2). Whilst VIFMCA displayed higher peak (p<0.001) and larger area (p<0.001) than extracted VIFICA, there was no significant difference in BAT between VIFICA and VIFMCA (p>0.05, paired t-test). Representative fitted Cp(t) from the SSS, ICA and MCA in a patient following a low-dose (0.023 mM/kg) injection are shown in Figure 2 and demonstrate the typically taller, narrower and higher CNR VIF extracted from the SSS.
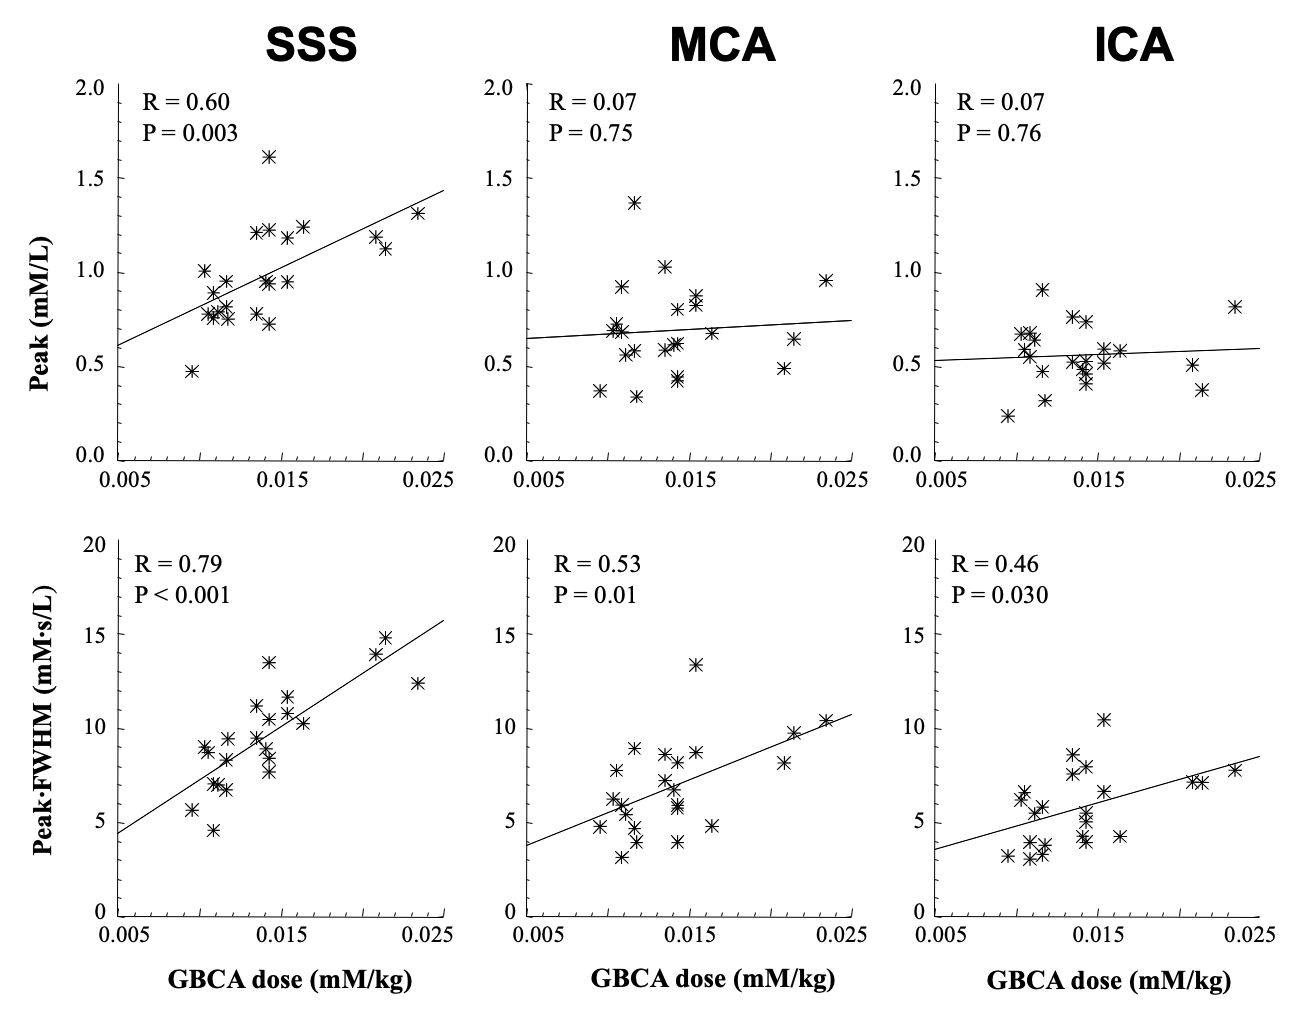
Administered GBCA dose correlated with the peak of VIFSSS (R=0.60, p=0.003). No significant correlation was seen with the peak values of either VIFICA or VIFMCA (P>0.05, Figure 3). The area or peak·FWHM of all three VIF groups correlated closely with dose, with peak·FWHMSSS demonstrating the strongest association with administered GBCA dose variation (R=0.80, P<0.001).
DISCUSSION
Through a study design incorporating a variable contrast-agent dose, we have demonstrated that compared to large intracranial arteries (ICA, MCA) the SSS is able to provide a superior global VIF with higher CNR, higher peak and demonstrably greater sensitivity to inter-individual changes in plasma gadolinium based contrast-agent (GBCA) concentration. Whilst previous authors have raised concerns about dispersion7 of the first pass GBCA bolus and subsequent VIF widening when using the veins, our data suggests such dispersion is minimal, with VIFSSS demonstrating both higher area and a non-significantly narrower peak than the VIF measured from the ICA and MCA respectively. Previous studies have suggested the cerebral cortex drains almost exclusively into the SSS9–11, and our data suggest that following GBCA bolus transit through the brain vascular network there is subsequent reconstitution of the first pass GBCA bolus shape within the distal SSS. It can be hypothesized that the larger cross sectional area of the SSS relative to feeding arteries may also serve to reduce partial volume effects and contribute to the shorter, more compact GBCA bolus measured within the SSS. In addition reduced ‘in flow’ effects secondary to lower flow velocities within the SSS11–14 and the reported presence of less turbulent, more laminar flow within the SSS15 relative to that seen in more torturous proximal large feeding arteries such as the ICA and MCA may also serve to explain the greater CNR within the SSS relative to that seen in the large arteries.CONCLUSION
In this study we have demonstrated the robustness of utilizing the SSS as a global VIF in the pharmacokinetic analysis of brain DCE-MRI data, demonstrating higher CNR and greater sensitivity to inter-individual changes in plasma contrast-agent concentration compared to VIF estimates measured from other large intracranial vessels.Acknowledgements
No acknowledgement found.References
1. Keil VC, Mädler B, Gieseke J, et al. Effects of arterial input function selection on kinetic parameters in brain dynamic contrast-enhanced MRI. Magn. Reson. Imaging 2017;40:83–90 doi: 10.1016/J.MRI.2017. 04.006.
2. Haroon HA, Buckley DL, Patankar TA, et al. A Comparison of Ktrans Measurements Obtained with Conventional and First Pass Pharmacokinetic Models in Human Gliomas. J. Magn. Reson. Imaging 2004;19:527–536 doi: 10.1002/jmri.20045.
3. Gowland P, Mansfield P, Bullock P, Stehling M, Worthington B, Firth J. Dynamic studies of gadolinium uptake in brain tumors using inversion-recovery echo-planar imaging. Magn. Reson. Med. 1992;26:241–258 doi: 10.1002/mrm.1910260206.
4. GREITZ T. A radiologic study of the brain circulation by rapid serial angiography of the carotid artery. Acta Radiol. Suppl. 1956:1–123.
5. Yankeelov T, Gore J. Dynamic Contrast Enhanced Magnetic Resonance Imaging in Oncology:Theory, Data Acquisition,Analysis, and Examples. Curr. Med. Imaging Rev. 2007;3:91–107 doi: 10.2174/157340507780619179.
6. Li KL, Lewis D, Jackson A, Zhao S, Zhu X. Low-dose T1W DCE-MRI for early time points perfusion measurement in patients with intracranial tumors: A pilot study applying the microsphere model to measure absolute cerebral blood flow. J. Magn. Reson. Imaging 2018;48:543–557 doi: 10.1002/jmri.25979.
7. Calamante F. Bolus dispersion issues related to the quantification of perfusion MRI data. J. Magn. Reson. Imaging 2005;22:718–722 doi: 10.1002/jmri.20454.
8. Li K-L, Buonaccorsi G, Thompson G, et al. An improved coverage and spatial resolution-using dual injection dynamic contrast-enhanced (ICE-DICE) MRI: A novel dynamic contrast-enhanced technique for cerebral tumors. Magn. Reson. Med. 2012;68:452–462 doi: 10.1002/mrm.23252.
9. Hirabuki N, Watanabe Y, Mano T, et al. Quantitation of flow in the superior sagittal sinus performed with cine phase-contrast MR imaging of healthy and achondroplastic children. AJNR. Am. J. Neuroradiol. 2000;21:1497–1501.
10. Mattle H, Edelman RR, Reis MA, Atkinson DJ. Flow quantification in the superior sagittal sinus using magnetic resonance. Neurology 1990;40:813–815 doi: 10.1212/wnl.40.5.813.
11. Inao S, Kuchiwaki H, Yoshida J, Furuse M. Magnetic resonance imaging quantitation of superior sagittal sinus flow: correlation to cerebral blood flow measured by xenon-enhanced computed tomography. Neurol. Res. 1997;19:35–40 doi:10.1080/01616412.1997.11740769.
12. Blackshear WM, Phillips DJ, Chikos PM, Harley JD, Thiele BL, Strandness DEJ. Carotid artery velocity patterns in normal and stenotic vessels. Stroke 1980;11:67–71 doi: 10.1161/01.str.11.1.67.
13. Singer JR, Crooks LE. Nuclear magnetic resonance blood flow measurements in the human brain. Science 1983;221:654–656 doi: 10.1126/science.6867733.
14. Feinberg DA, Crooks L, Hoenninger J 3rd, Arakawa M, Watts J. Pulsatile blood velocity in human arteries displayed by magnetic resonance imaging. Radiology 1984;153:177–180 doi: 10.1148/radiology.153.1.6473779.
15. Schuchardt F, Hennemuth A, Schroeder L, et al. Acute Cerebral Venous Thrombosis: Three-Dimensional Visualization and Quantification of Hemodynamic Alterations Using 4-Dimensional Flow Magnetic Resonance Imaging. Stroke 2017;48:671–677 doi: 10.1161/STROKEAHA.116.015102.
Figures