3911
Strategy to overcome the spectral overlap between the 2-hydroxyglutarate and lipid resonances at 2.25 ppm1University of Texas Southwestern Medical Center, Dallas, TX, United States
Synopsis
In proton MRS, the 2.25 ppm resonance of 2-hydroxyglutarate (2HG), which gives the largest signal in many acquisition methods, is overlapped with the lipid resonance at 2.25 ppm, complicating evaluation of 2HG in necrotic tumors with elevated lipids. We propose a novel approach for separation of the 2HG and lipid overlapped signals in spectral fitting. We developed new lipid basis sets and tested on proton MRS (PRESS TE 97ms at 3T) data from 43 glioma patients. LCModel fitting using the new lipid basis sets resulted in complete distinction between IDH mutation and wildtype (accuracy, sensitivity, and specificity all unity).
Introduction
Accurate noninvasive evaluation of 2-hydroxyglutarate (2HG) abundance in brain tumor patients is crucial for identifying the IDH (isocitrate dehydrogenase) mutational status and managing IDH-mutant glioma patients. In proton MRS, the 2.25ppm resonance of 2HG, which gives the largest signal in many acquisition methods, is overlapped with a lipid resonance at 2.25ppm,1-3 complicating evaluation of 2HG in tumors with elevated lipids4,5. The effect of this spectral overlap on 2HG estimation has not been fully studied to date. In spectral fitting by LCModel, for instance, the lipid 2.25ppm signal strength is determined, using a soft constraint, relative to the major lipid signal at 1.3ppm, whose signal strength depends on unknown number of CH2 chains in tumors. We propose a novel fitting approach, in which the lipid 2.25ppm signal is determined according to the lipid 0.9ppm signal given that the signals are attributed to a CH2 group and a CH3 group per molecule, respectively, irrespective of fat types.2,3Methods
Proton MRS (TE 97ms PRESS6) was acquired from 43 glioma patients at 3T (age 47±17 years) (24 IDH mutated and 19 IDH wildtype), using Philips 3T MR scanners. Spectral fitting was performed, with LCModel7, using an in-house metabolite basis set6. The macromolecule resonances were excluded in the fitting. Metabolites were quantified with reference to water. Spectral fitting was conducted using two fitting methods:Fitting method-1: The LCModel built-in lipid basis set was used. The lipid basis set included Lip09, Lip20, Lip13a, and Lip13b. Lip09 had a resonance at 0.9ppm with amplitude of 3. Lip20 had three resonances at 2.0, 2.25, and 2.8ppm with amplitudes of 1.33, 0.67, and 0.87, respectively. Lip13a and Lip13b both had a 1.3ppm resonance with amplitude of 2.
Fitting method-2: Two new lipid bases, LipNew1 and LipNew2, replaced Lip09 and Lip20. LipNew1 had 0.9 and 2.25ppm resonances, with amplitudes of 3 and 1.8, respectively. LipNew2 had three resonances at 1.6, 2.0, and 2.8ppm, with amplitudes of 1.5, 1.7, and 0.6, respectively. The amplitudes of the new Lip basis sets at 97ms TE were determined according to published fat T2 values.2,3
Results and Discussion
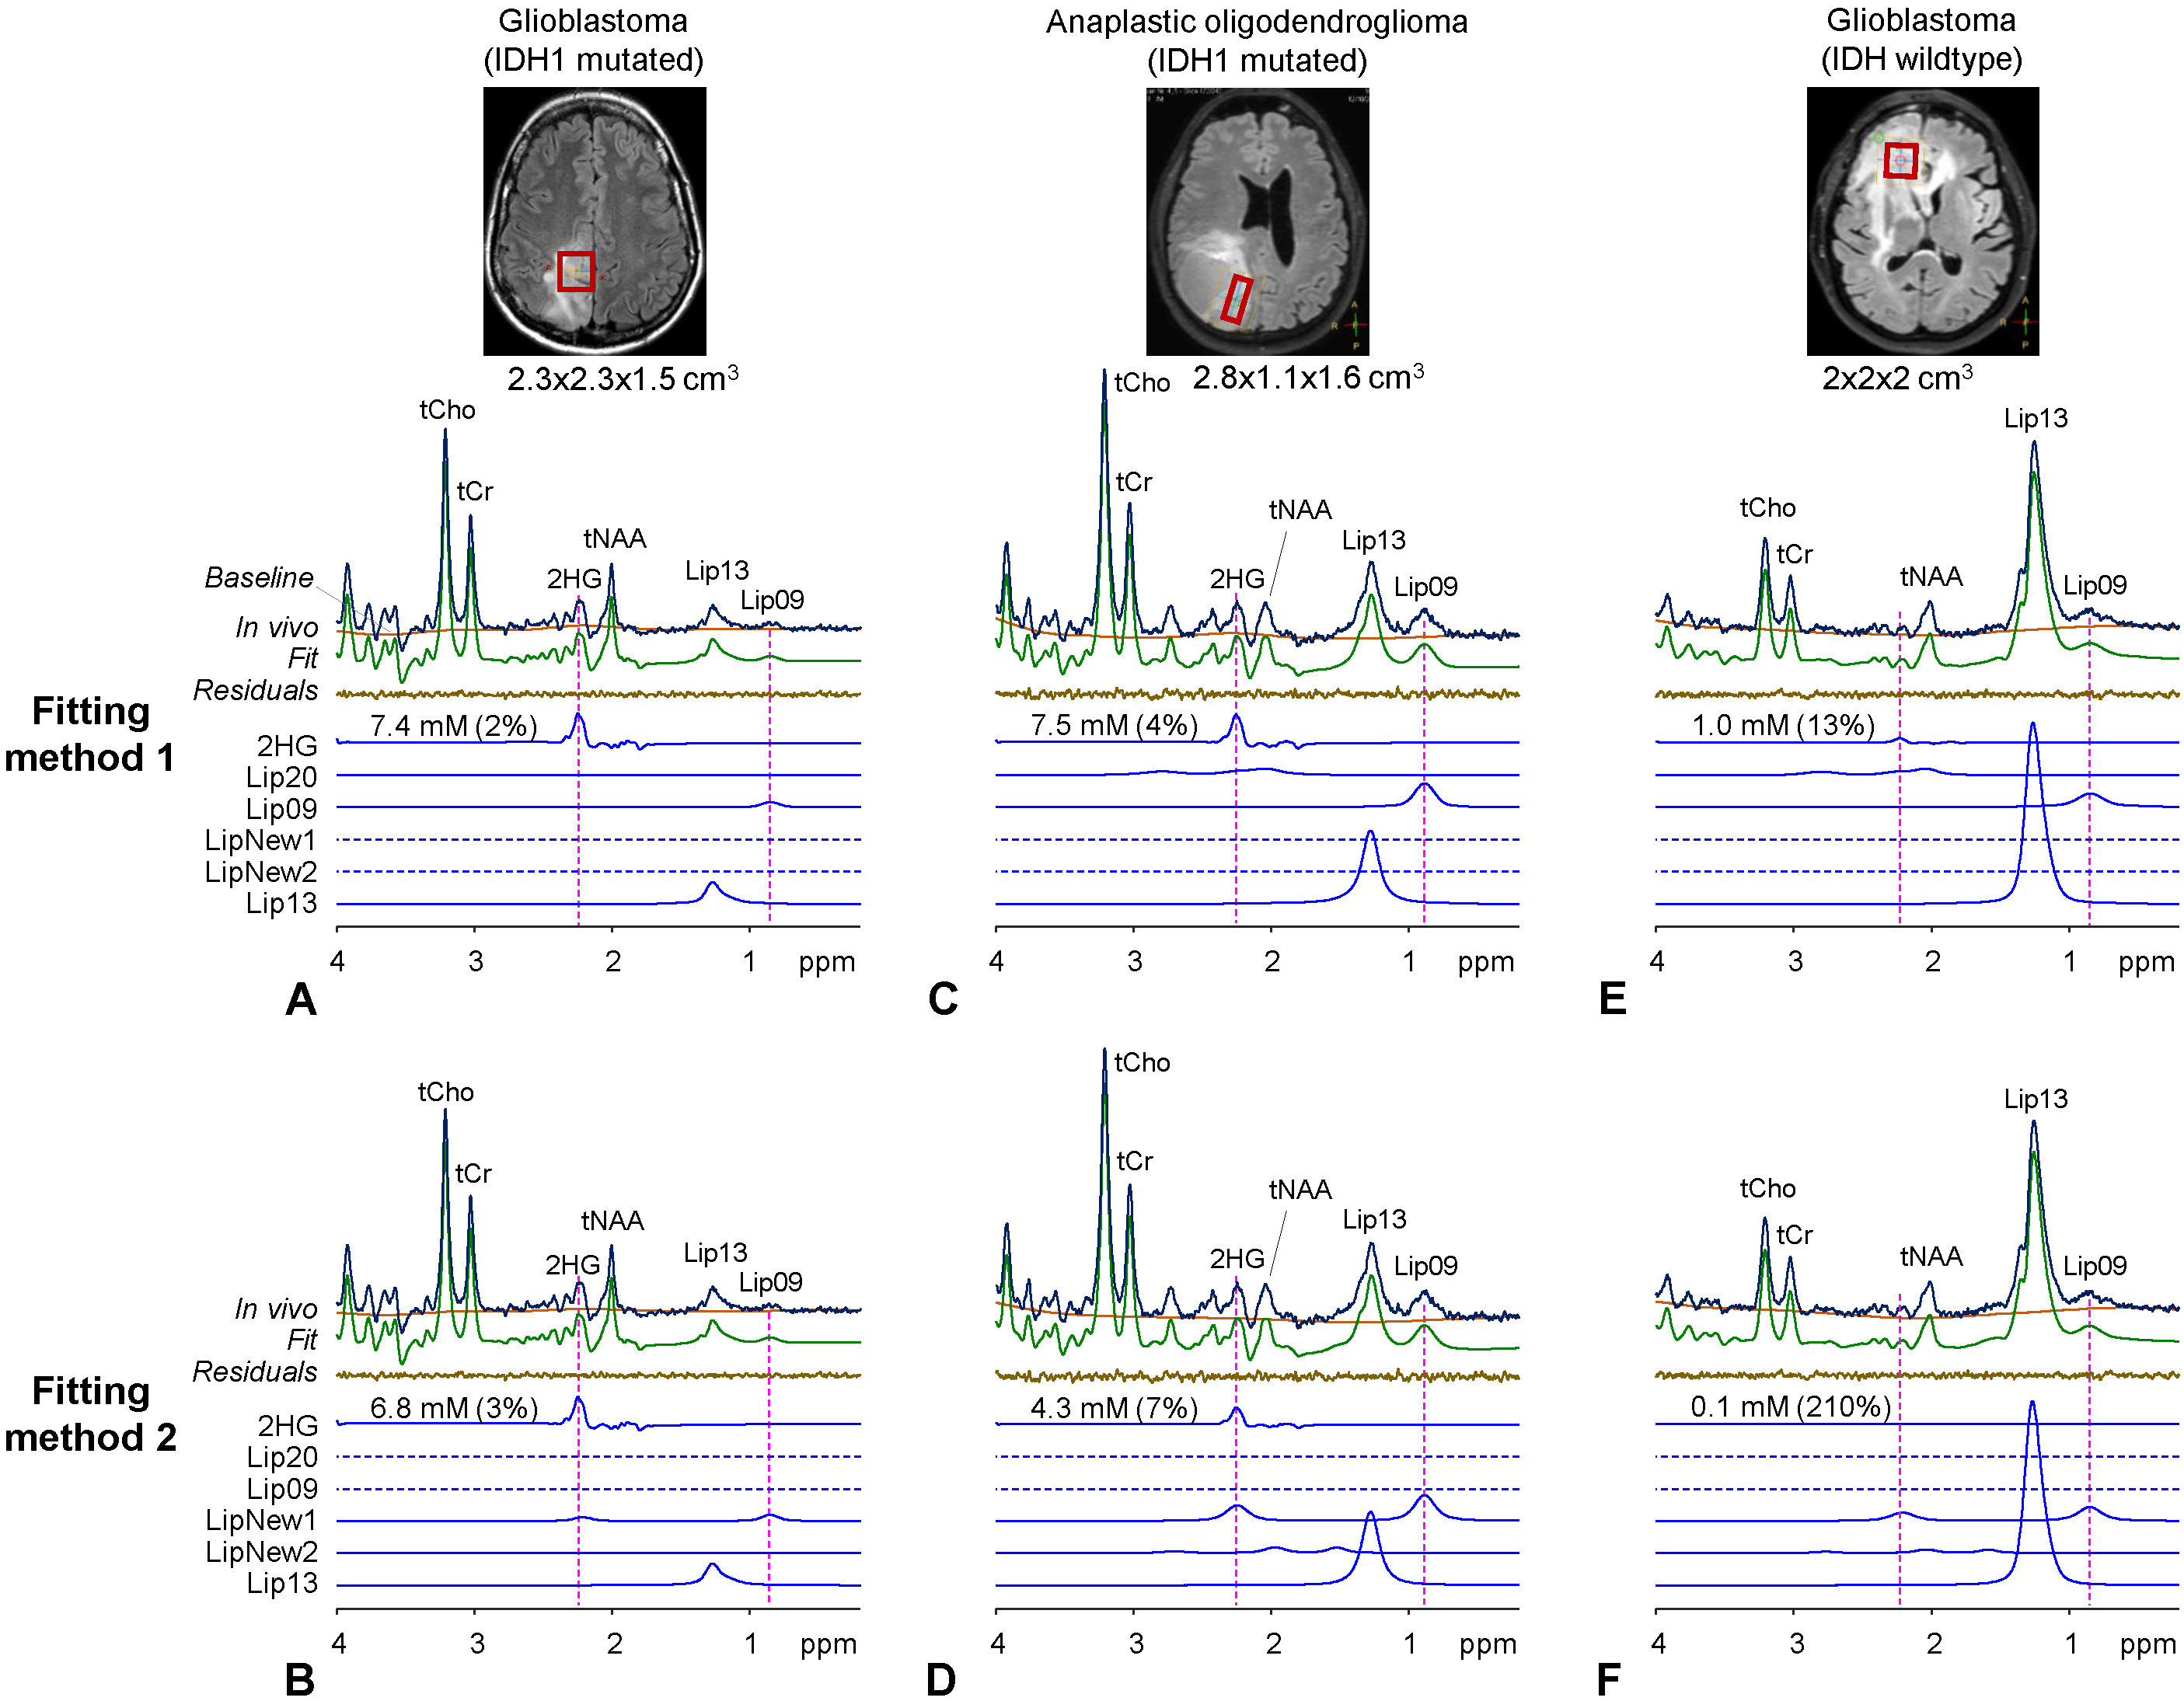
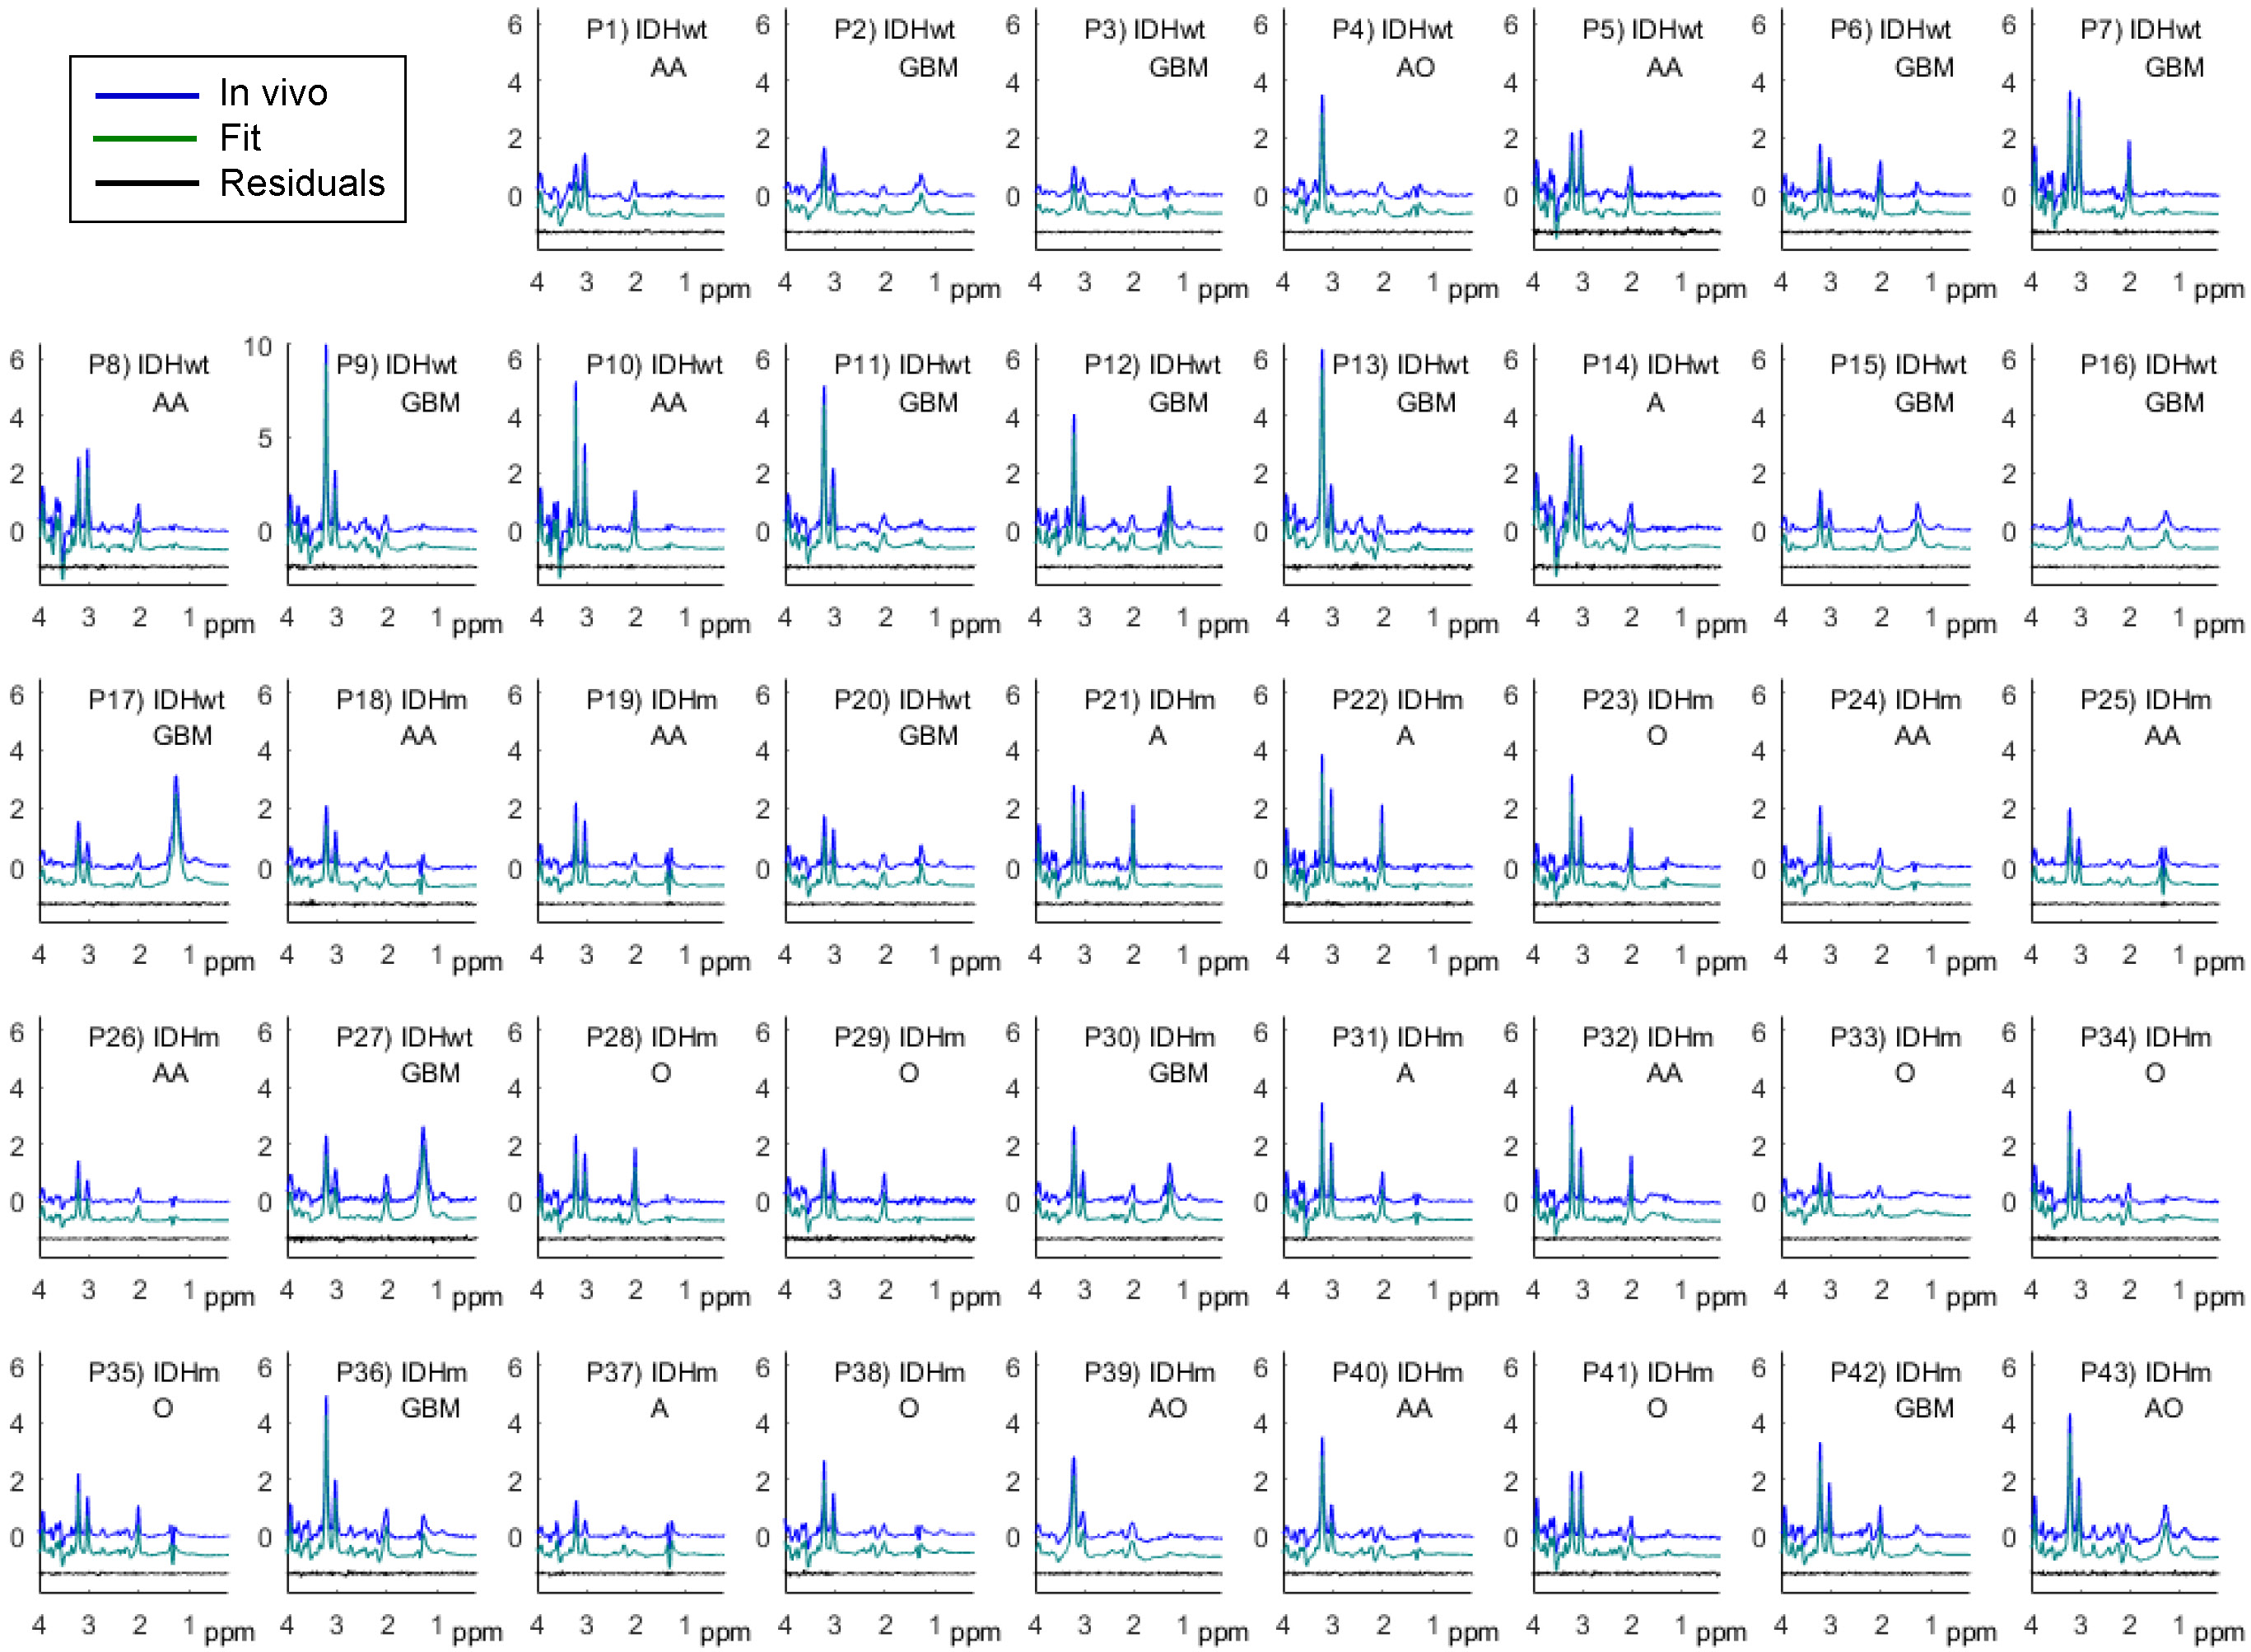
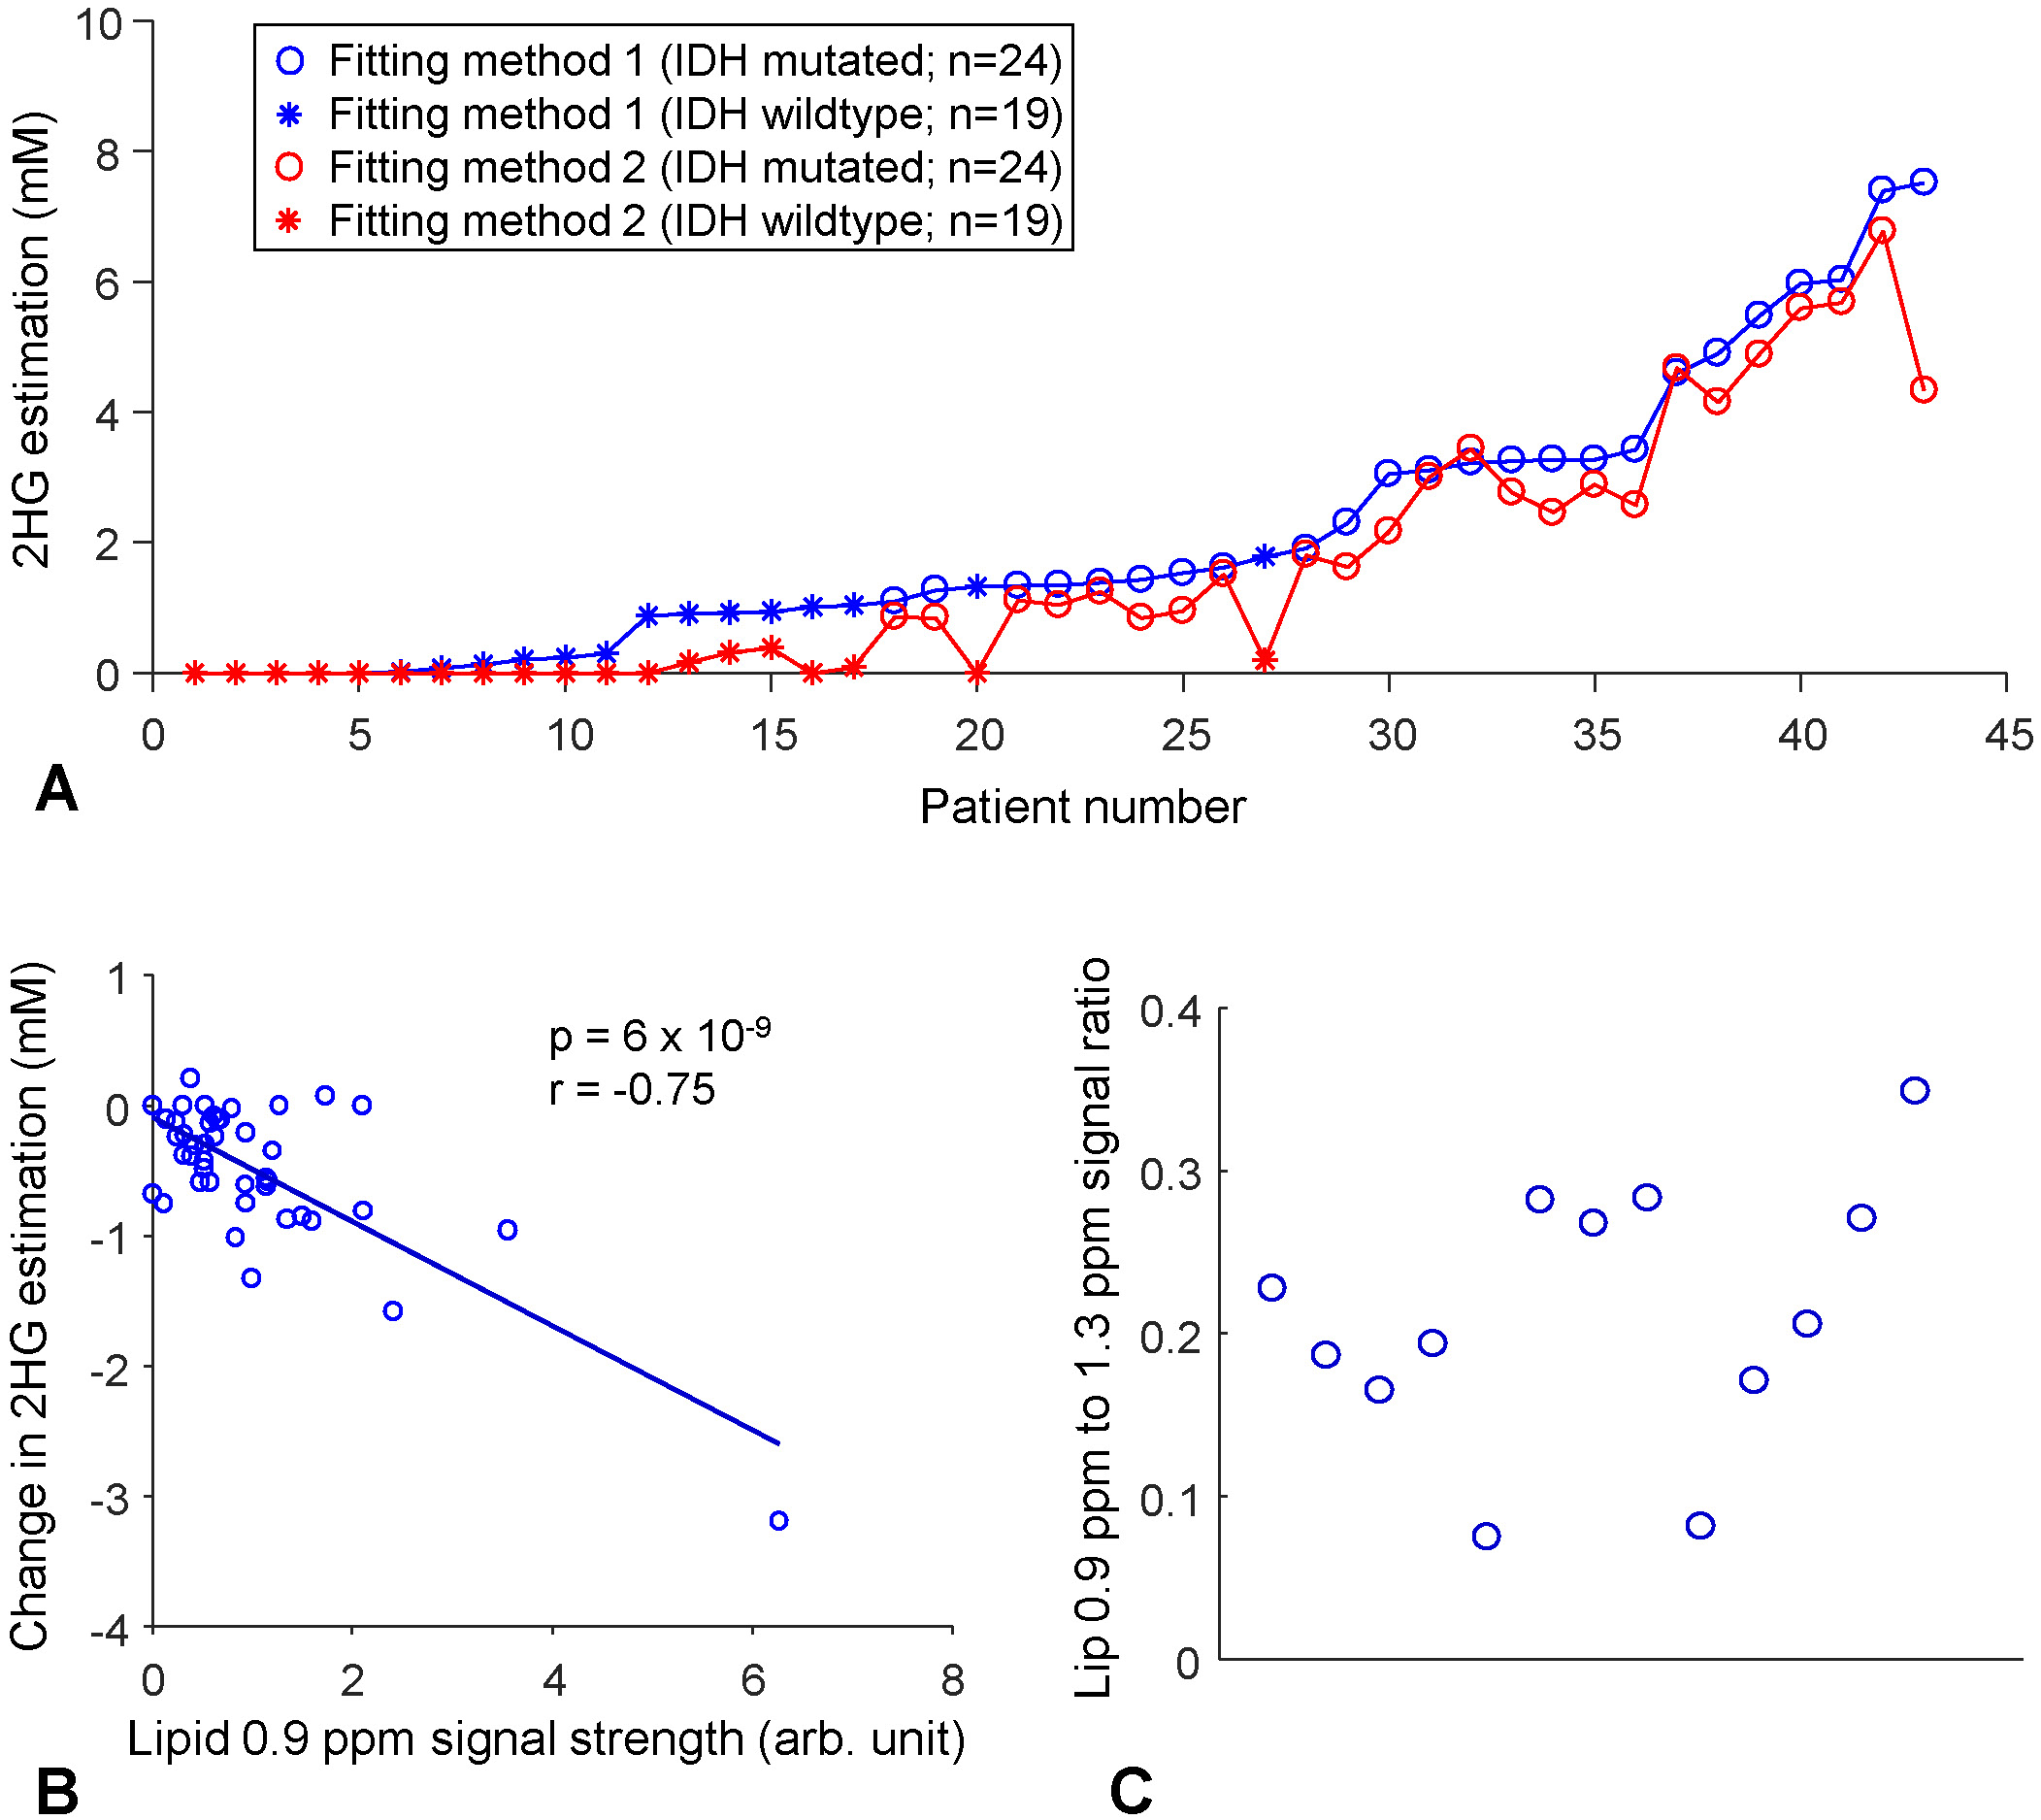
An IDH1-mutated glioblastoma patient showed a large signal at 2.25ppm and small lipid signals at 1.3 and 0.9ppm (Lip13 and Lip09) (Figure 1A). Fitting method-1 resulted in 7.4mM 2HG. The LCModel-returned Lip20 signal was essentially null. Fitting method-2 resulted in slightly lower 2HG (6.8mM) (Figure 1B). The amplitude of LipNew1 at 2.25ppm was 11% relative to the 2HG signal. The lipid 0.9ppm-to-1.3ppm signal ratio was 28%. A patient with an IDH1-mutated anaplastic oligodendroglioma also showed a large signal at 2.25ppm (Figure 1C). Fitting method-1 resulted in 7.5mM 2HG. The lipid 1.3 and 0.9ppm signals were both fourfold larger in this oligodendroglioma than in the aforementioned glioblastoma. The lipid 0.9ppm-to-1.3ppm signal ratio was 34%. The ratio of the Lip20 signal at 2.25ppm with respect to the 2HG peak was high (15%). Fitting method-2 resulted in substantially reduced 2HG level (4.3mM), most likely due to the presence of a large lipid signal at 2.25ppm (Figure 1D). The LipNew1 peak at 2.25ppm was as high as the LCModel-returned 2HG peak (95%), suggesting that the 7.5mM 2HG from Fitting method-1 was likely an overestimation due to suboptimal differentiation between 2HG and lipid signals at 2.25ppm. An IDH-wildtype glioblastoma showed a very high lipid signal at 1.3ppm and a small peak at 0.9ppm (Figure 1E). The lipid 0.9ppm-to-1.3ppm signal ratio was as small as 7% in this glioblastoma, fourfold smaller compared with the two aforementioned tumors. Fitting methods 1 and 2 resulted in 1.0mM and 0.1mM respectively (Figure 1E,F). A considerable lipid 2.25ppm signal was returned (LipNew1), which was likely assigned to 2HG in Fitting method-1.For 43 patients, the tCho linewidth and SNR were 6.1±1.6Hz and 107±44, respectively (Figure 2). Overall, Fitting method-2 resulted in a decrease of 2HG estimation compared with Fitting method-1 (Figure 3A). The change in 2HG estimation by Fitting method-2 ranged from ‒3.2mM to 0.2mM, depending on the lipid signals. Regression analysis showed that the reduction in 2HG estimation was significantly associated with the lipid 0.9ppm signal strength (p=6x10‒9) (Figure 3B). For 13 spectra with well-discernible lipid 0.9ppm signals (SNR>4), the lipid 0.9ppm-to-1.3ppm signal ratio differed substantially between the tumors (8% - 35%) (Figure 3C).
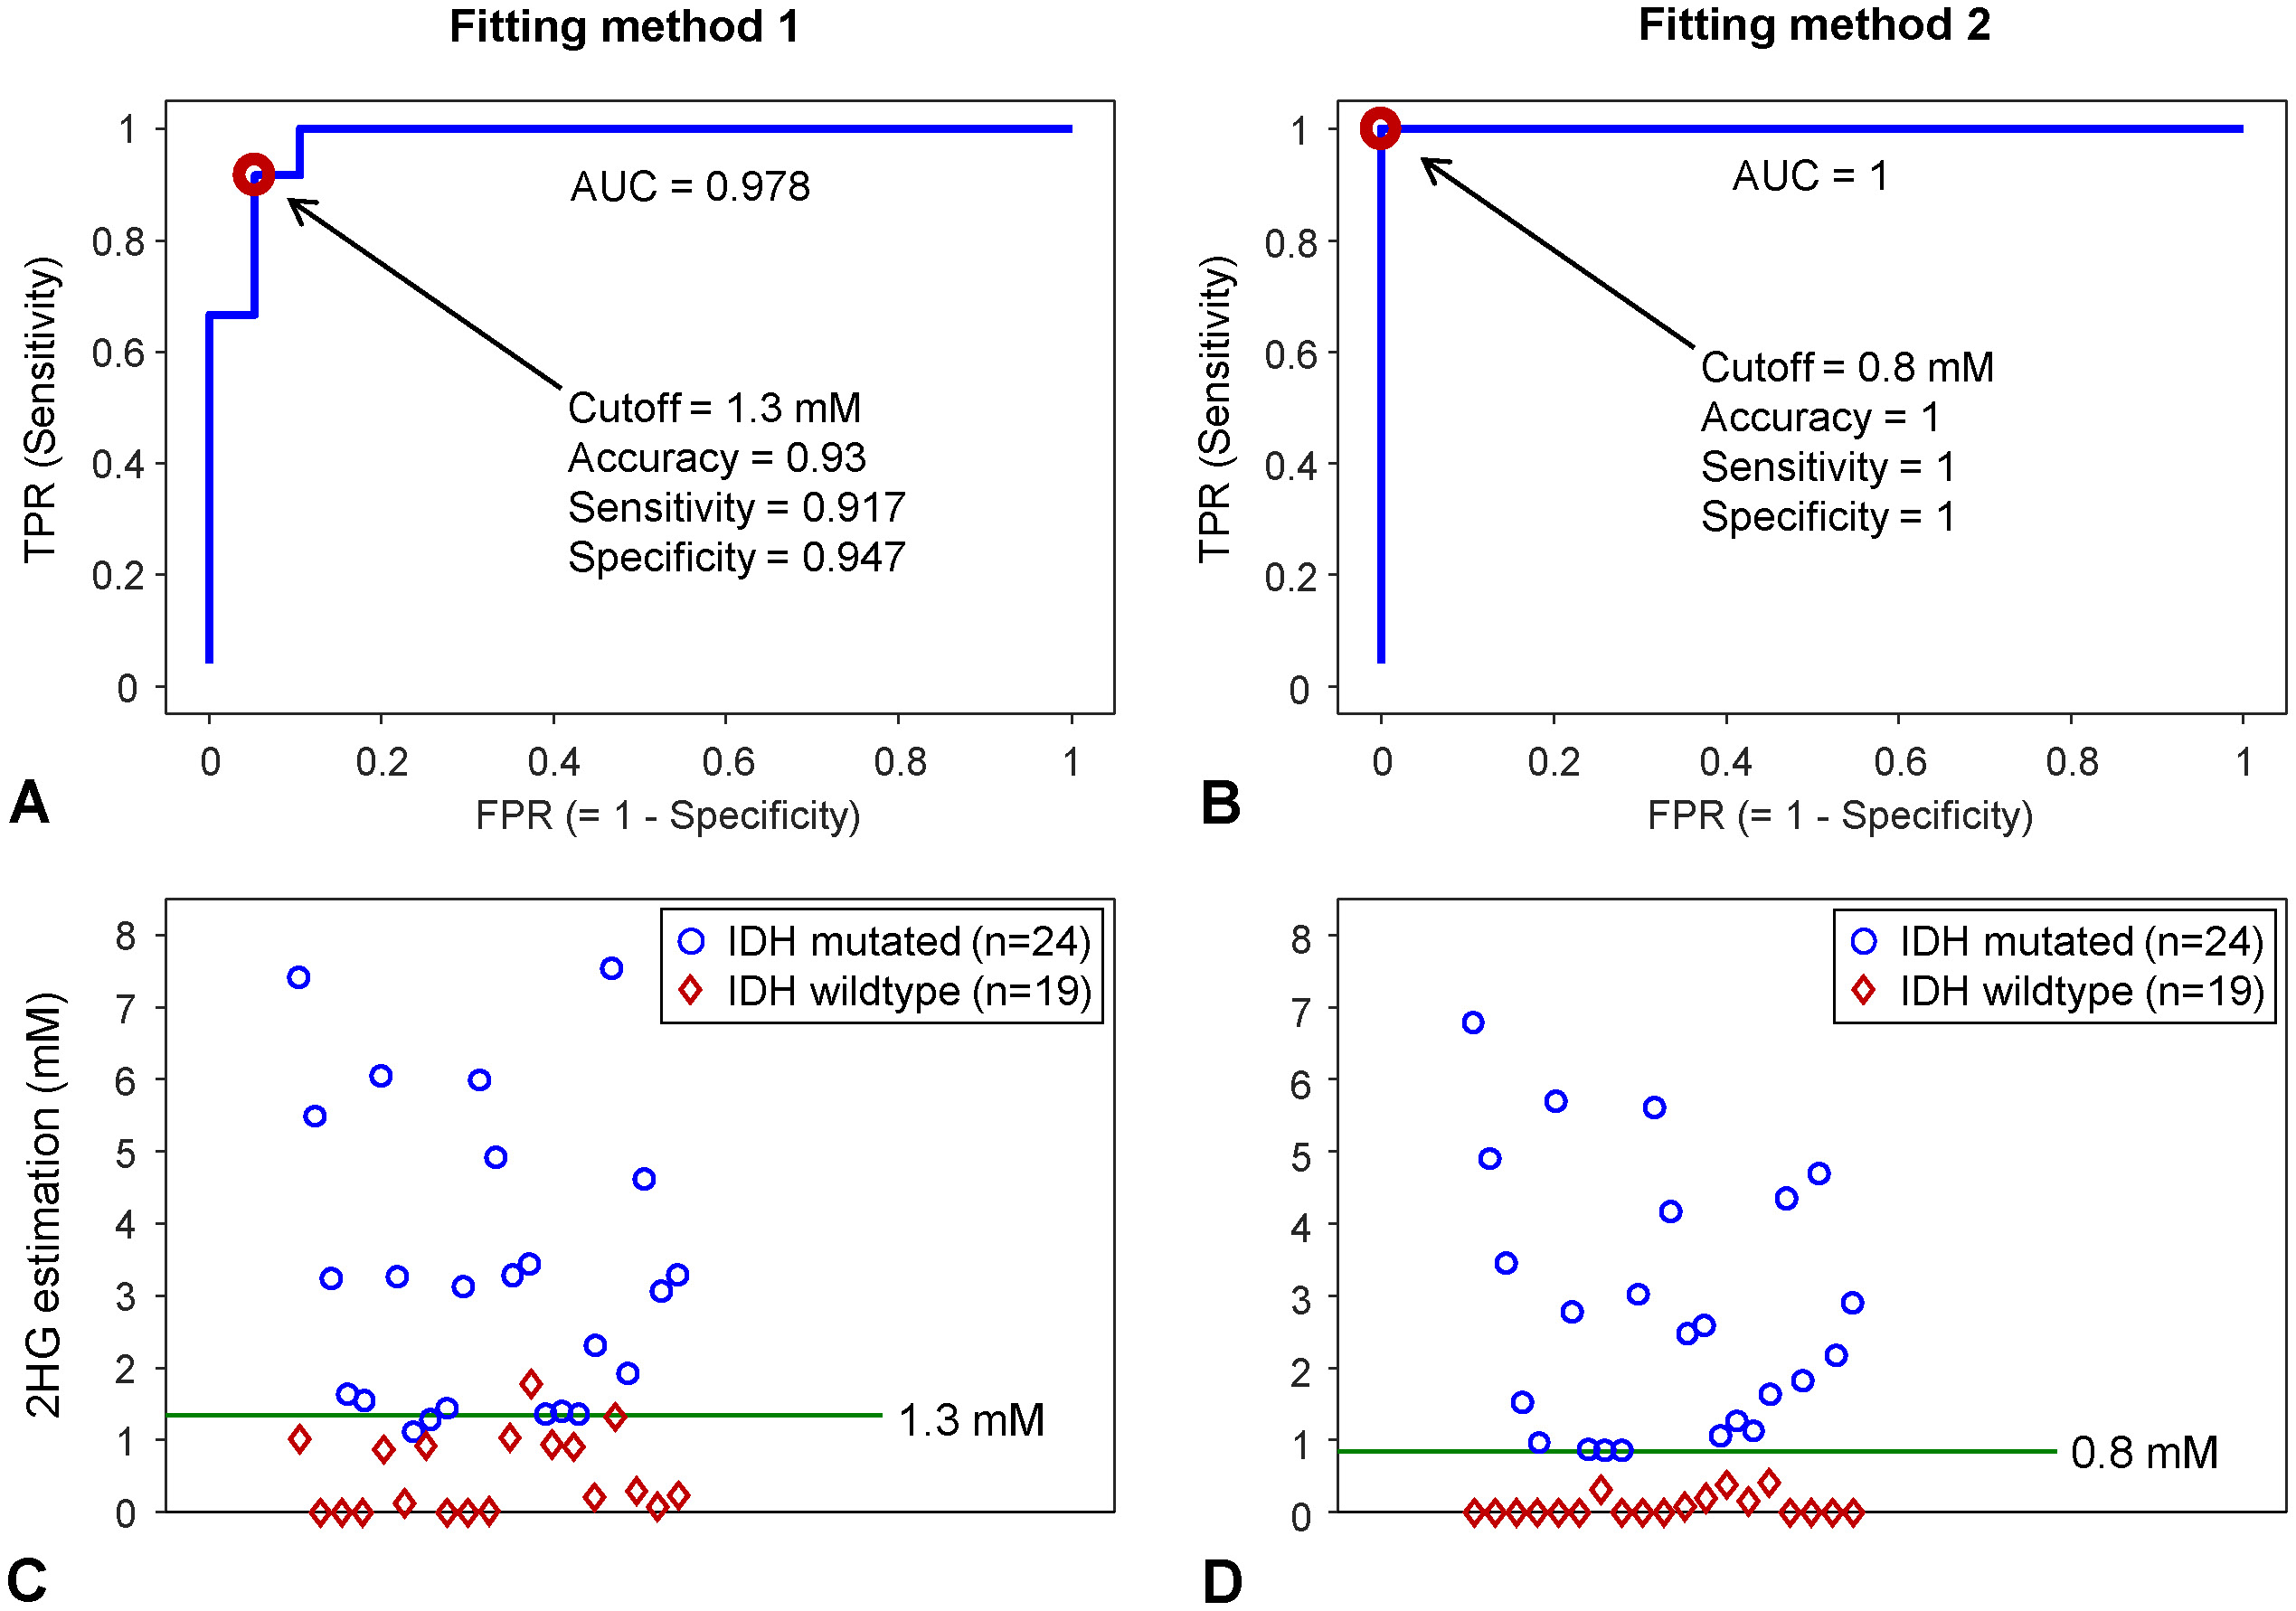
ROC (receiver operating characteristic) analysis was performed with the 2HG estimates from the two fitting methods (Figure 4A,B). For Fitting method-1, AUC (area under the ROC curve) was 0.978. A 2HG cutoff corresponding to the point with the smallest distance to the upper-left corner of the ROC curve was obtained as 1.3mM. Accuracy, sensitivity and specificity were calculated as 0.93, 0.917, and 0.947, respectively. For Fitting method-2, AUC was unity. A 2HG cutoff of 0.8mM provided a complete distinction between IDH mutation and IDH wildtype (accuracy, sensitivity, and specificity were all unity) (Figure 4D).
Conclusion
The data suggest that the spectral overlap between the lipid and 2HG signals at 2.25ppm can be reliably resolved by setting the lipid 2.25ppm signal according to the lipid 0.9ppm signal intensity. Incorporating our new lipid bases in the spectral fitting may improve MRS identification of IDH mutational status in brain tumors, particularly in necrotic tumors with elevated lipids.Acknowledgements
This study was supported by a National Institutes of Health award R01CA184584 and a Cancer Prevention Research Institute of Texas grant (CPRIT) RP200456.References
1. Tugnoli V, Tosi MR, Tinti A, et al. Characterization of lipids from human brain tissues by multinuclear magnetic resonance spectroscopy. Biopolymers. 2001;62:297-306.
2. Dimitrov IE, Douglas D, Ren J, et al. In vivo determination of human breast fat composition by 1H magnetic resonance spectroscopy at 7 T. Magn Reson Med. 2012;67:20-26.
3. Ren J, Dimitrov I, Sherry AD, et al. Composition of adipose tissue and marrow fat in humans by 1H NMR at 7 Tesla. J Lipid Res. 2008;49:2055-2062.
4. Tietze A, Choi C, Mickey B, et al. Noninvasive assessment of isocitrate dehydrogenase mutation status in cerebral gliomas by magnetic resonance spectroscopy in a clinical setting. J Neurosurg. 2018;128:391-398.
5. Suh CH, Kim HS, Paik W, et al. False-Positive Measurement at 2-Hydroxyglutarate MR Spectroscopy in Isocitrate Dehydrogenase Wild-Type Glioblastoma: A Multifactorial Analysis. Radiology. 2019;291:752-762.
6. Choi C, Ganji S, Hulsey K, et al. A comparative study of short- and long-TE 1H MRS at 3 T for in vivo detection of 2-hydroxyglutarate in brain tumors. NMR Biomed. 2013;26:1242-1250.
7. Provencher, SW. Estimation of metabolite concentrations from localized in vivo proton NMR spectra. Magn Reson Med. 1993;30:672-679.
Figures