3909
Predictive Role of the ADC measurements and MRI Morphologic Features on Isocitrate Dehydrogenase Status in Patients with Diffuse Glioma.1Radiology, Chinese PLA general hospital, BeiJing, China, 2radiology, the sixth center of Chinese PLA general hospital, BeiJing, China
Synopsis
The IDH status has been reported as major prognostic factors for glioma behavior. Thus, noninvasively detecting molecular subtypes before surgery is important for predicting the outcome and choosing therapy. In this study, using machine-learning algorithms, the accurate prediction of IDH subtype was achieved for diffuse gliomas via noninvasive MR imaging, including ADC values and tumor morphologic features, and it is worth mentioning ADC measurements applied are available in clinical workstations. Furthermore, to our knowledge, no previous attempts have been made to use different machine-learning methods to build a suitable model to predict the IDH status for WHO grade II-IV gliomas.
Purpose
To develop a predictive model of isocitrate dehydrogenase (IDH) status in clinically diagnosed grade II~IV glioma patients using the 2016 World Health Organization (WHO) classification based on available MRI parameters.Methods
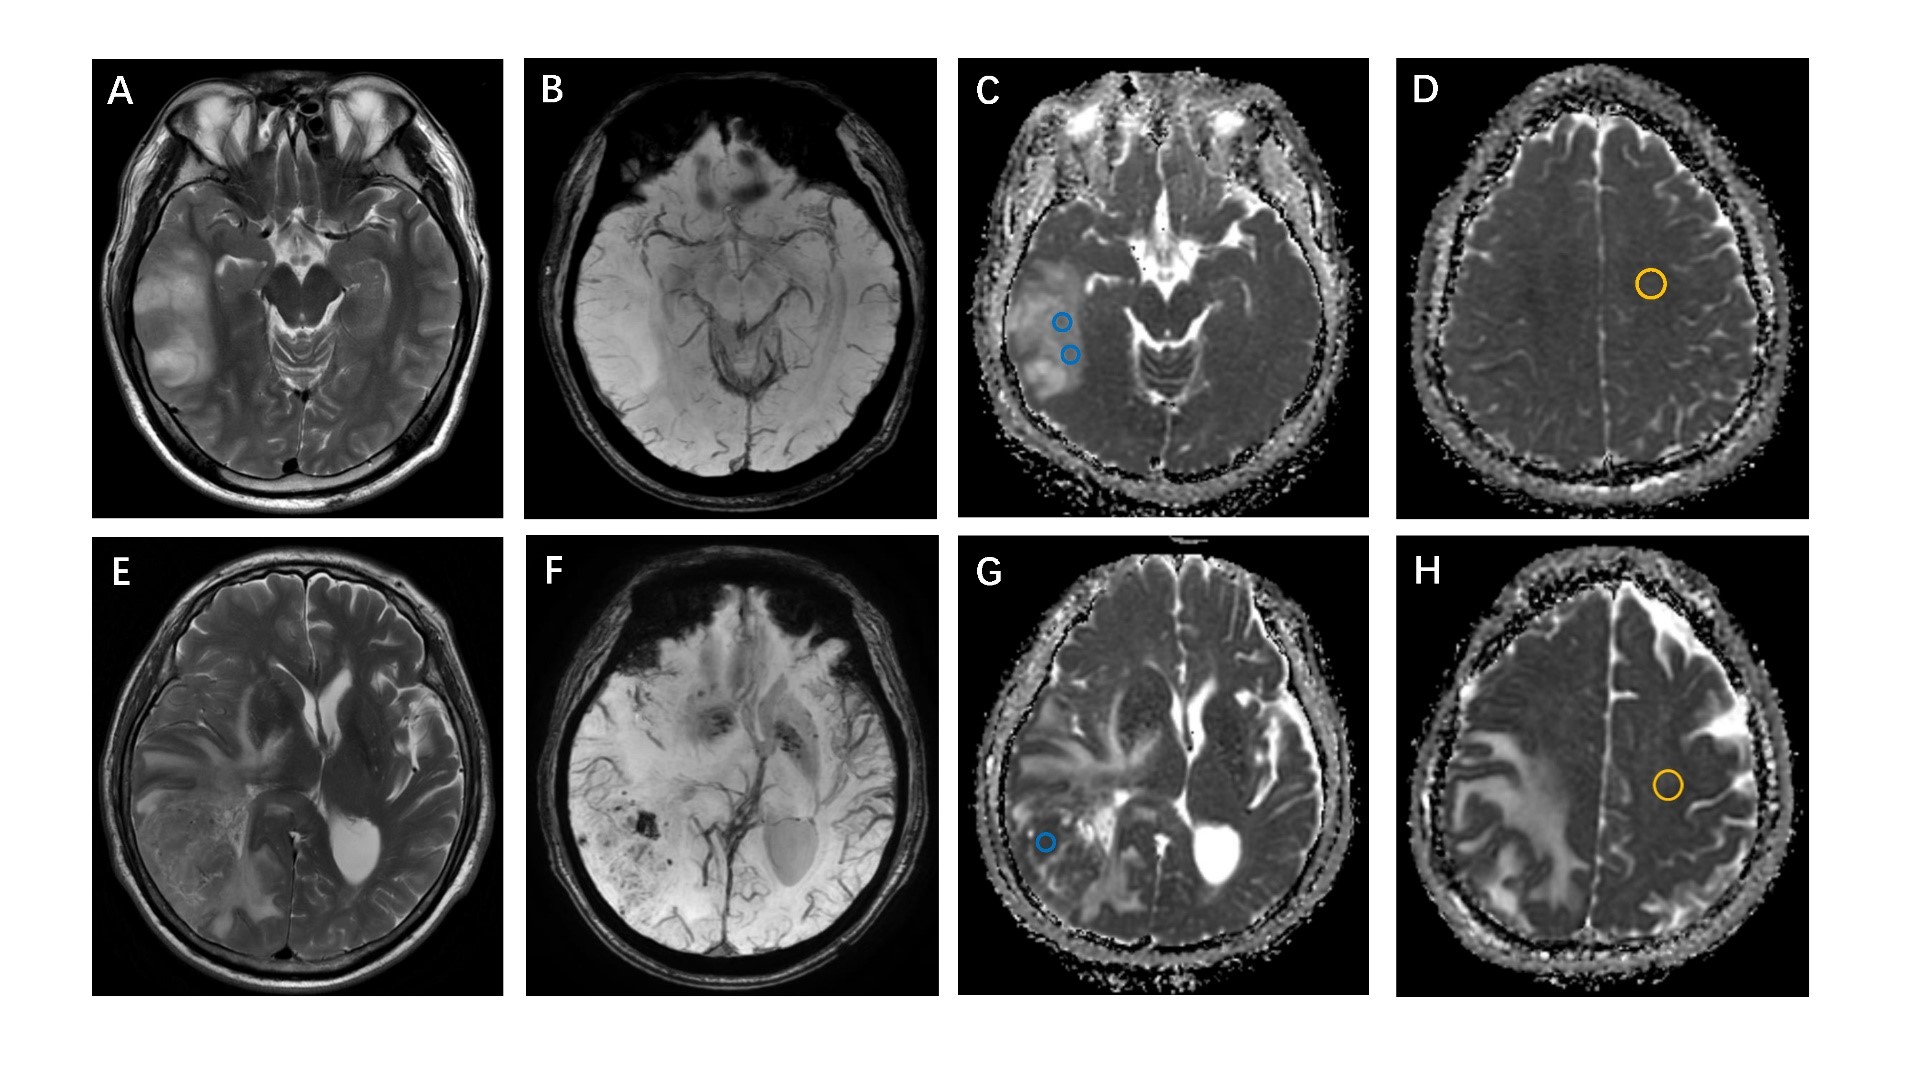
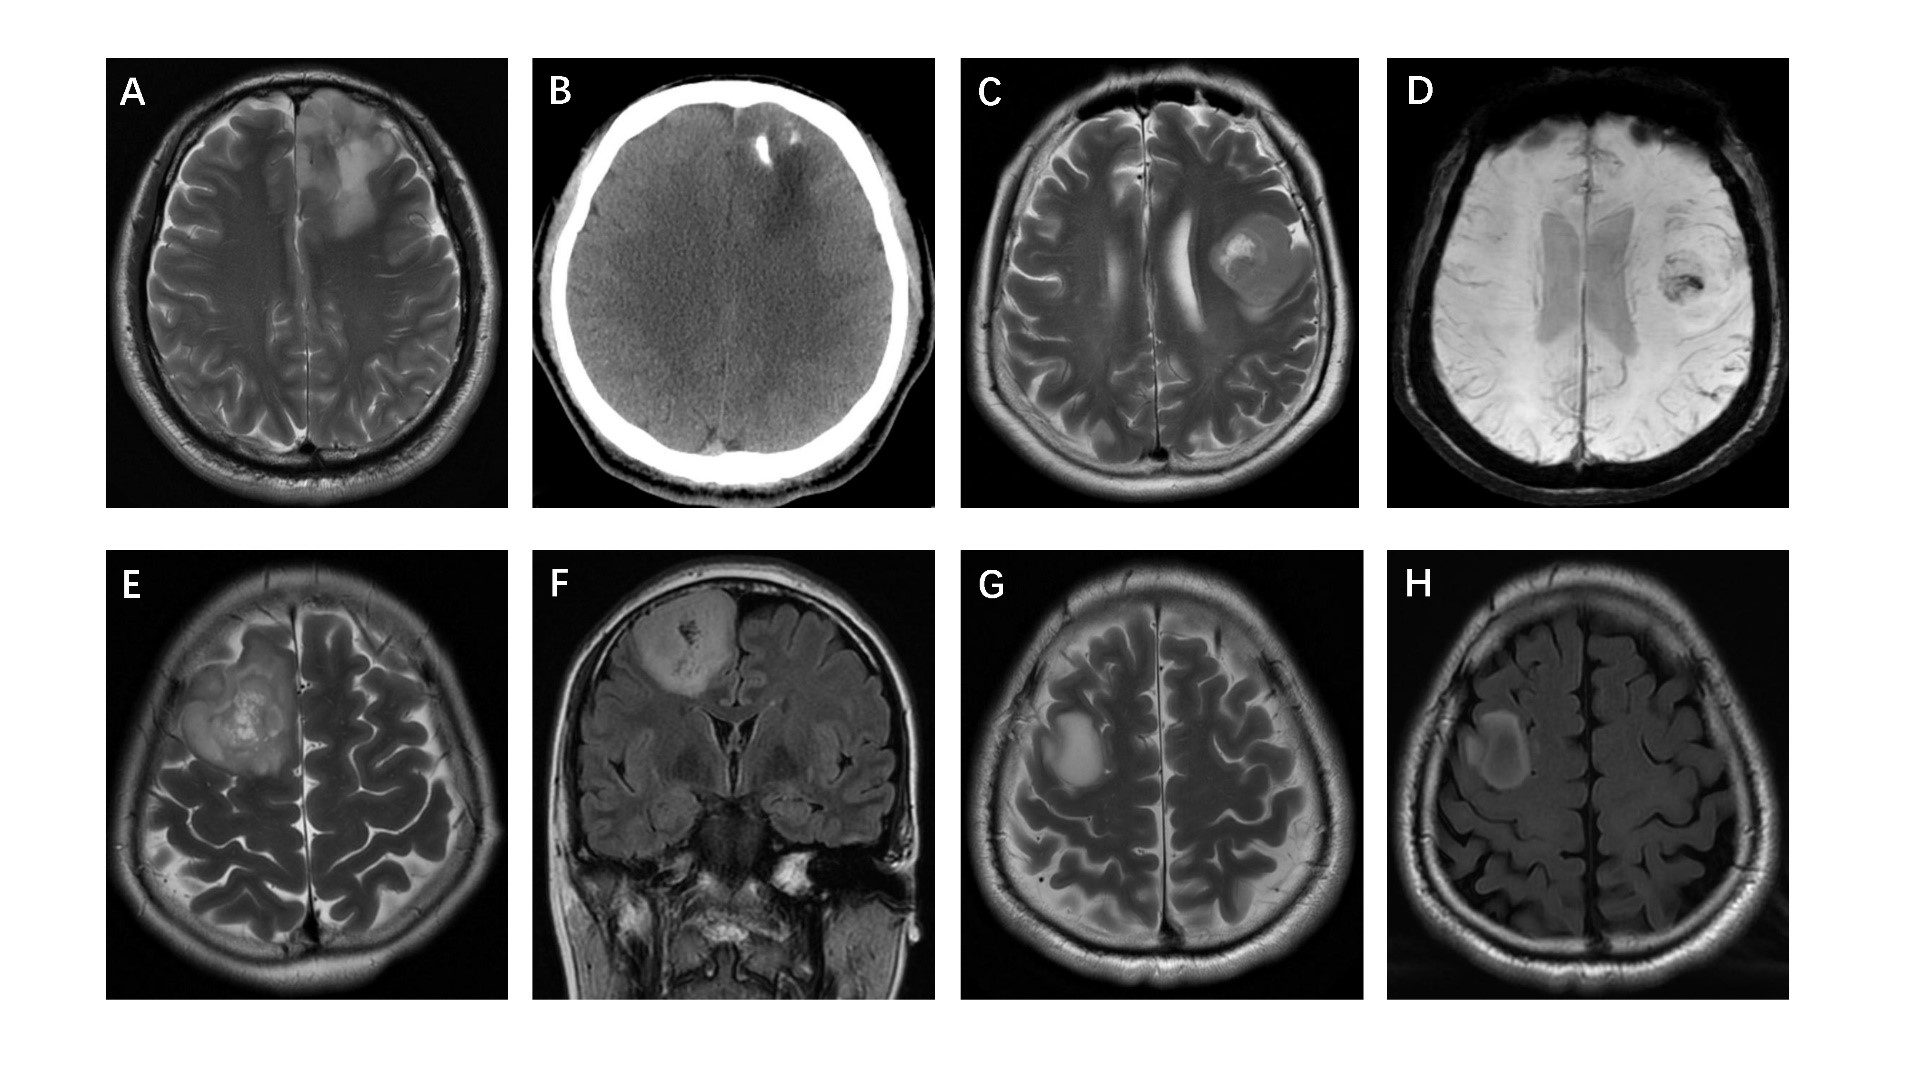
From August 2015 to July 2020, through the local picture archiving and communication system (PACS), two radiologists (Z.J. and P.H., with 10 and 13 years of experience, respectively), continuously collated patients with WHO grade II~IV glioma who underwent brain MRI. All recruited patients underwent 3.0 T MRI. The MRI protocols included axial T2-weighted, axial or coronal T2-weighted FLAIR, axial T1-weighted, fat-suppressed contrast-enhanced T1-weighted (including axial, coronal and sagittal) sequences and diffusion-weighted imaging. DWI was performed with b values of 0 s/mm2 and 1000 s/mm2 and used to derive the ADC maps. Three different ROIs (30-40 mm2) were placed into the visually perceived lowest portions inside the tumors on the ADC maps, excluding hemorrhagic, cystic, and necrotic portions and calcifications that might influence the measured results without overlapping the ROIs(Figure 1, right). Then, the minimum ADC was defined as the average value of the ROIs with the lowest ADC values as in Maynard1 et al and Xing2 et al. Subsequently, following the same method, an ROI was delineated by selecting the contralateral normal white matter and defining the ADC value within it as ADCn. Thus, there were four ROIs per patient. Finally, the rADC (ADCmin to ADCn ratio) was calculated. The selection and evaluation of the tumor morphology were performed according to previous publications. (a) Tumor location, which was specified by the center of the lesion, was divided into 4 groups: frontal lobe, other lobes (including parietal lobe, temporal lobe and occipital lobe), thalamus or brainstem, and cerebellum. (b) The tumor margin was described on T2-weighted images, FLAIR images and contrast-enhanced T1-weighted images. (c) Contrast enhancement was categorized into 3 groups: nonenhancement, patchy enhancement, and rim enhancement. (d) Calcification and hemorrhage were observed and evaluated on T1-weighted imaging, susceptibility-weighted imaging, and CT, as available. (e) Cystic changes and central necrosis were defined as a free-liquid intensity with a nonenhanced portion(Figure 2, right). Intraclass correlation coefficient (ICC) analysis was carried out to evaluate interobserver and intraobserver agreement for the ADC measurements. Interobserver agreement for the morphologic categories was evaluated by Cohen's kappa analysis. The nonparametric Kruskal-Wallis test was used to determine whether the ADC measurements and glioma subtypes were related. In the univariable analysis, if the differences in a variable were significant (P<0.05) or an image feature had high consistency (ICC >0.8; κ >0.6), then it was chosen as a predictor variable. The performance of the area under the receiver operating characteristic curve (AUC) was evaluated using several machine learning models, including logistic regression, support vector machine (SVM), Naive Bayes and Ensemble. The best machine learning model was developed as the final model to evaluate the IDH subtype probability for previously unseen patients with grade II~IV glioma in the subsequent test set.Results
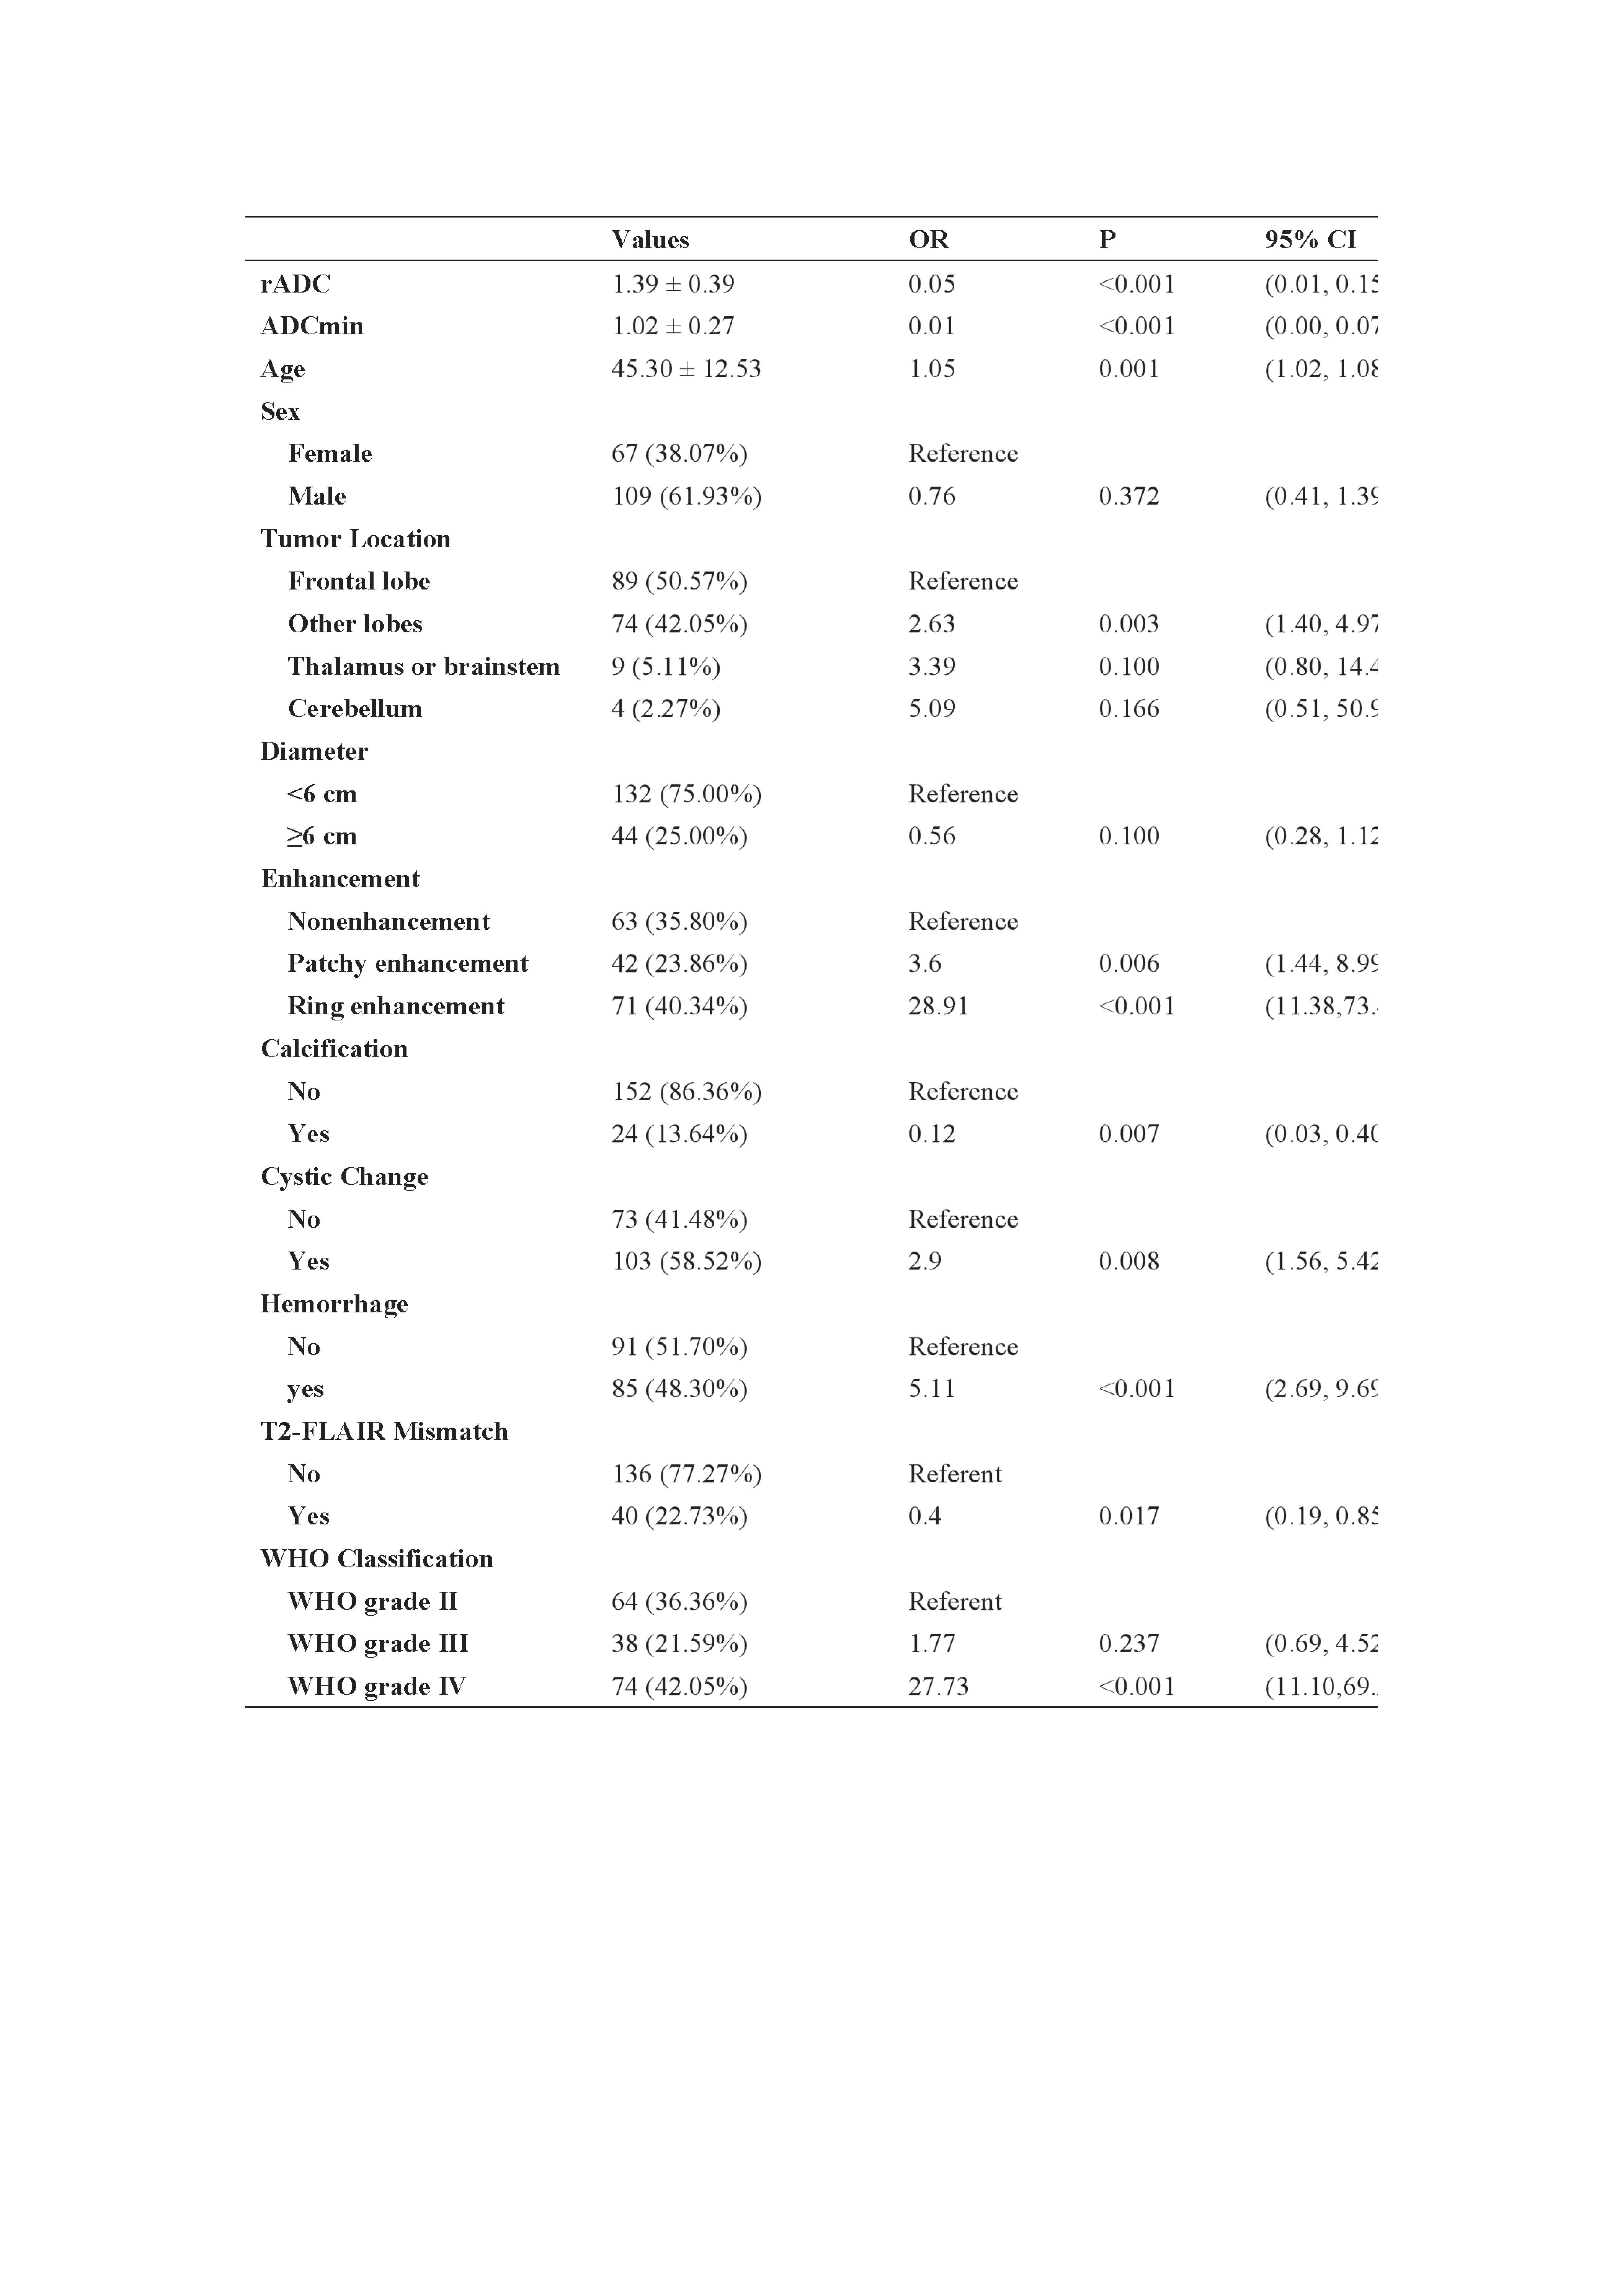
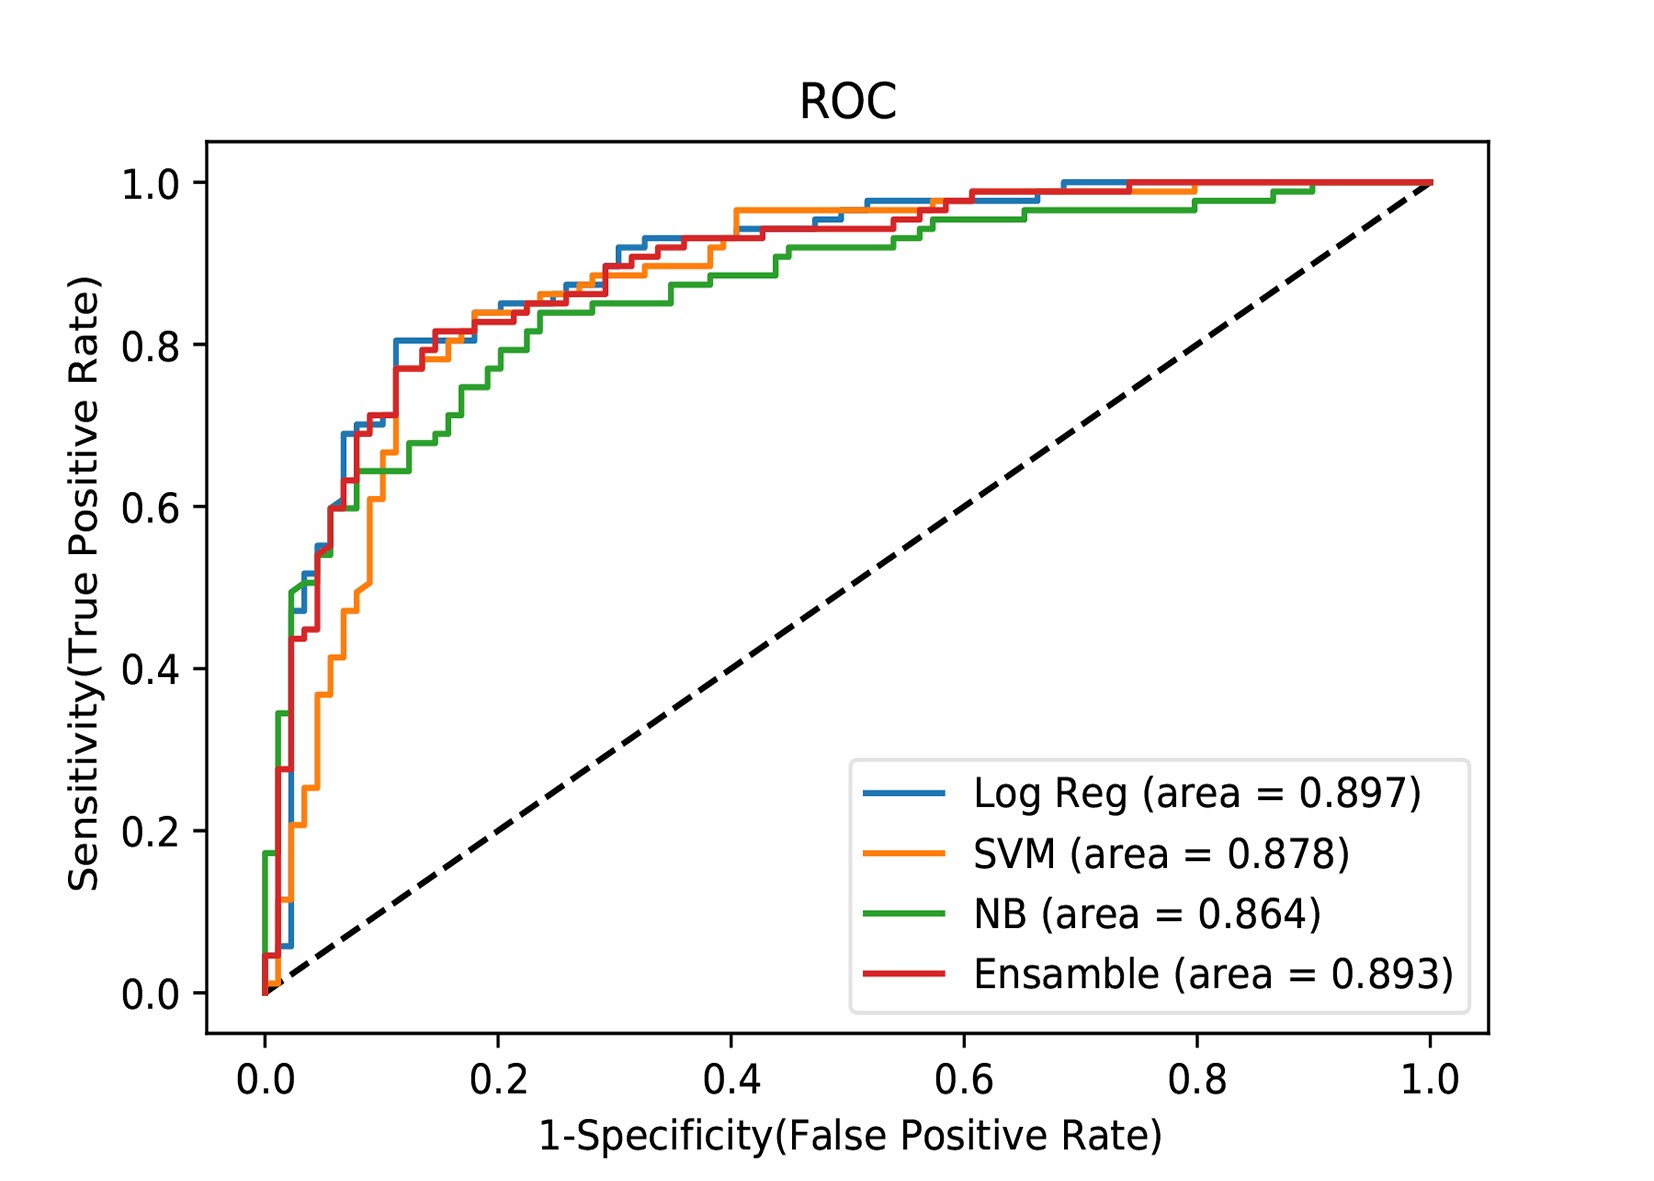
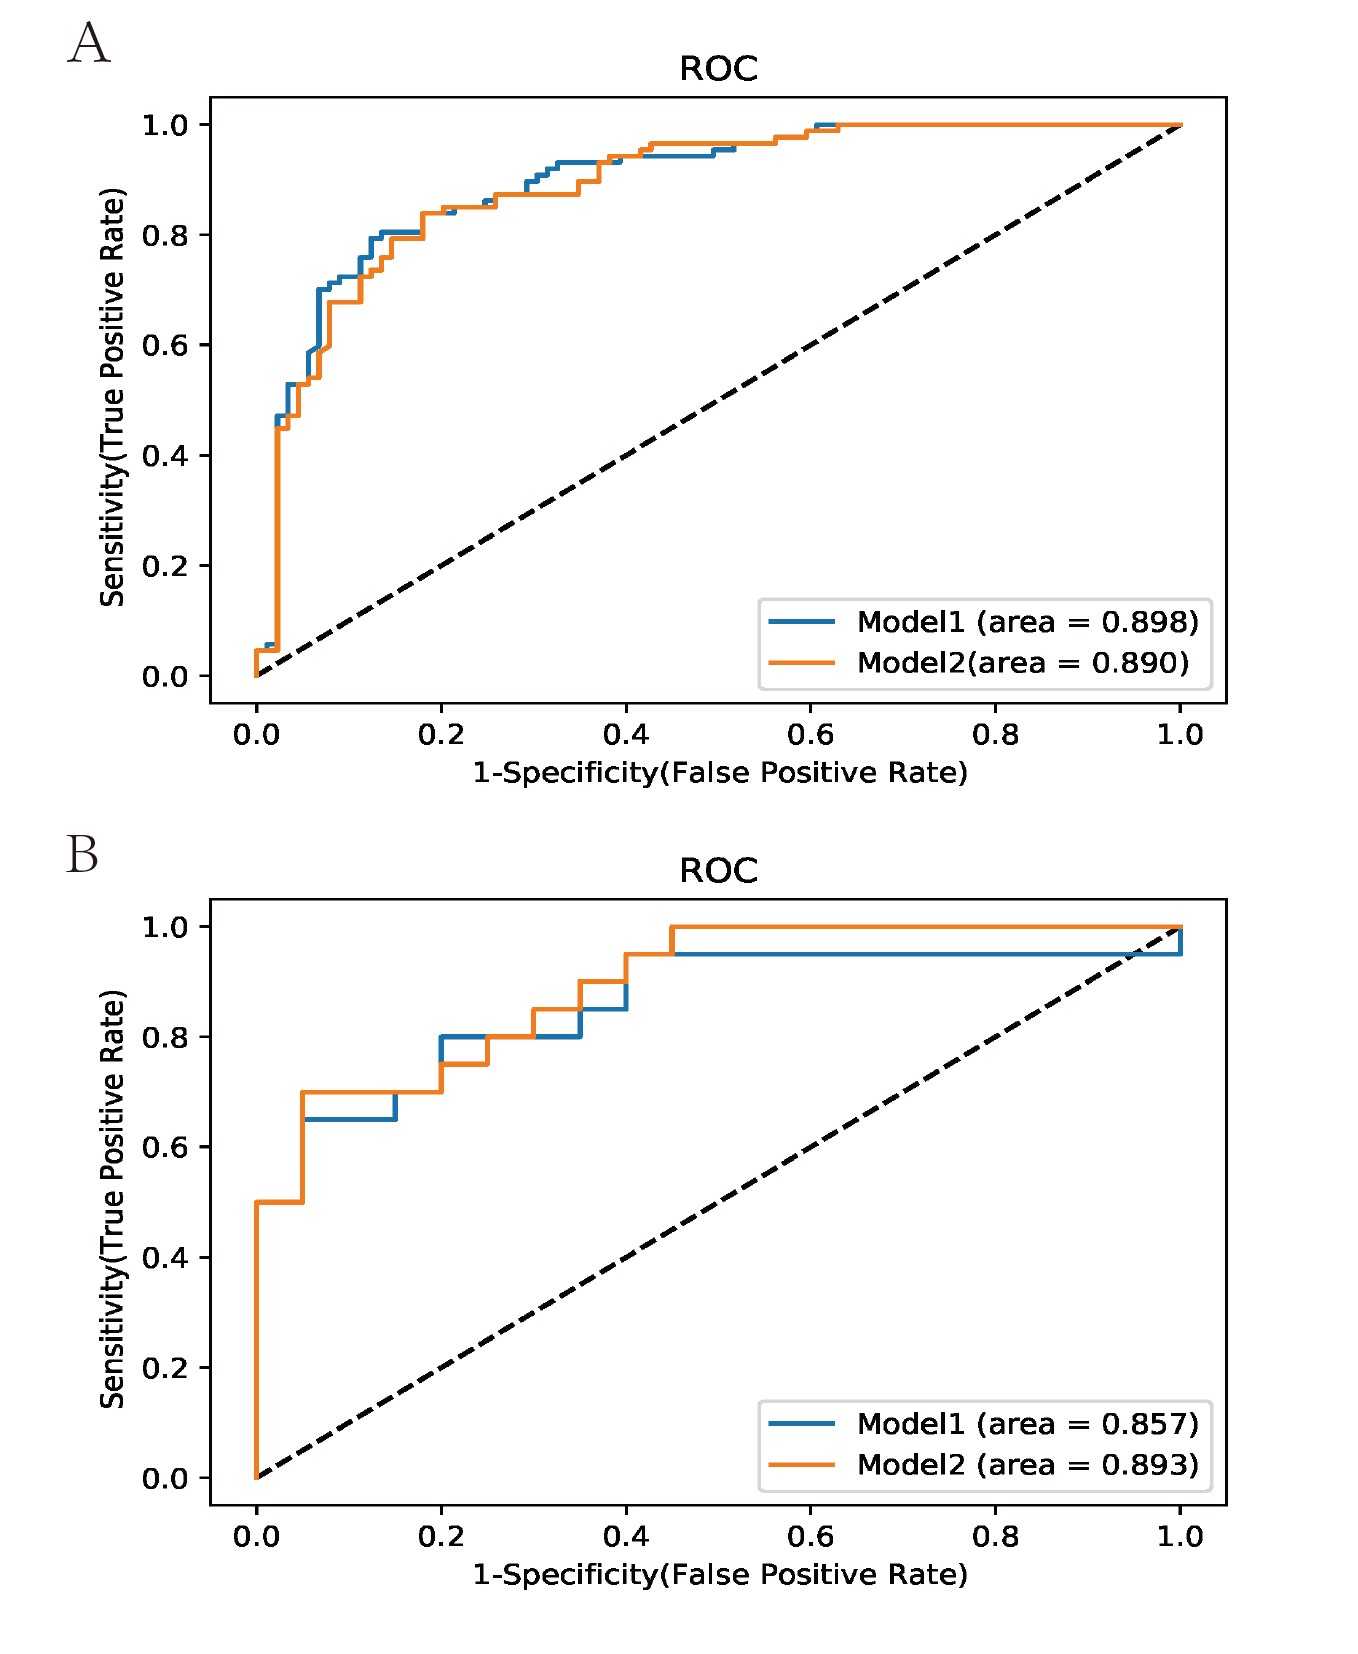
A total of 176 patients (109 male and 67 female patients; median age: 46.5 years; interquartile range: 35.0-54.0 years), consisting of 89 with an IDH mutation and 87 with wild-type IDH, were included. After univariable analysis selection, including features with substantial agreement (k >0.6), six measured variables were included in the machine learning model, including rADC, age, enhancement, calcification, hemorrhage, and cystic change(Figure 3, right). Logistic regression demonstrated the largest area under the curve among the single model prediction models (AUC= 0.897) (Figure 4, right).. Two predictive models, model 1 (including all predictor variables) and model 2 (which excluded the calcification result), correctly classified IDH status with areas under the receiver operating characteristic curve of 0.89 and 0.90, respectively. In the test set of 40 glioma patients (mutant IDH and 87 wild-type IDH), the areas under the receiver operating characteristic curve were 0.89 for model 1 and 0.90 for model 2. (Figure 5, right).Conclusion
Through the use of machine-learning algorithms, the accurate prediction of mutant-IDH tumors versus wild-type–IDH tumors was achieved for adult diffuse gliomas via noninvasive MR imaging characteristics, including ADC values and tumor morphologic features, which are considered widely available from most clinical workstations.Acknowledgements
The authors thank Yu-Lin Wang, Hua-Feng Xiao, Hong Peng and Yuan-Yuan Cui for patient recruitment and acquired clinical and MRI information. The authors also thank Xiang-Bing Bian and De-Kang Zhang conducted the quality assurance of image quality.References
1. Maynard J, Okuchi S, Wastling S, et al. World Health Organization Grade II/III Glioma Molecular Status: Prediction by MRI Morphologic Features and Apparent Diffusion Coefficient. RADIOLOGY 2020;296(1):111-21.
2. Xing Z, Yang X, She D, et al. Noninvasive Assessment of IDH Mutational Status in World Health Organization Grade II and III Astrocytomas Using DWI and DSC-PWI Combined with Conventional MR Imaging. AM J NEURORADIOL 2017;38(6):1138-44.
Figures