3907
Deep learning super-resolution MR spectroscopic imaging to map tumor metabolism in mutant IDH glioma patients1Radiology, Massachusetts General Hospital, Charlestown, MA, United States, 2IBM Watson Health, Boston, MA, United States, 3Neurosurgery, Massachusetts General Hospital, Boston, MA, United States, 4Massachusetts General Hospital, Boston, MA, United States, 5Heidelberg University Hospital, Boston, MA, United States, 6Heidelberg University Hospital, Heidelberg, Germany, 7Massachusetts General Hospital,, Charlestown, MA, United States
Synopsis
We developed deep learning super-resolution MR spectroscopic imaging (MRSI) to map tumor metabolism in patients with mutant IDH glioma. A generative adversarial network (GAN) architecture comprised of a UNet neural network as the generator network and a discriminator network for adversarial training was employed to upsample MR spectroscopic imaging data with a factor of four. The preliminary results on simulated and in vivo data indicate that the proposed deep learning method is effective in enhancing the spatial resolution of metabolite maps which may better guide treatment in mutant IDH glioma patients.
INTRODUCTION
As a noninvasive imaging method, MRSI is able to provide complimentary information, such as the metabolic activity occurring in the tumor, with respect to conventional magnetic resonance imaging (MRI). It can measure non-invasively about twenty metabolites in the human brain, and provide metabolic information about disease mechanisms, which are not available from structural MRI. Due to the difference between the spatial extent of metabolic alterations and anatomical lesions, alternative information can be obtained to assess disease severity, and metabolic imaging can map spatially abnormal molecular pathways with higher specificity for cancer compared to anatomical imaging. However, acquiring high resolution metabolic maps similar to anatomical MRI is challenging in patients due to low metabolite concentrations, and alternative approaches that increase resolution by post-acquisition image processing can mitigate this limitation. We developed deep learning super-resolution MR spectroscopic imaging (MRSI) to map tumor metabolism in patients with mutant IDH glioma.METHODS
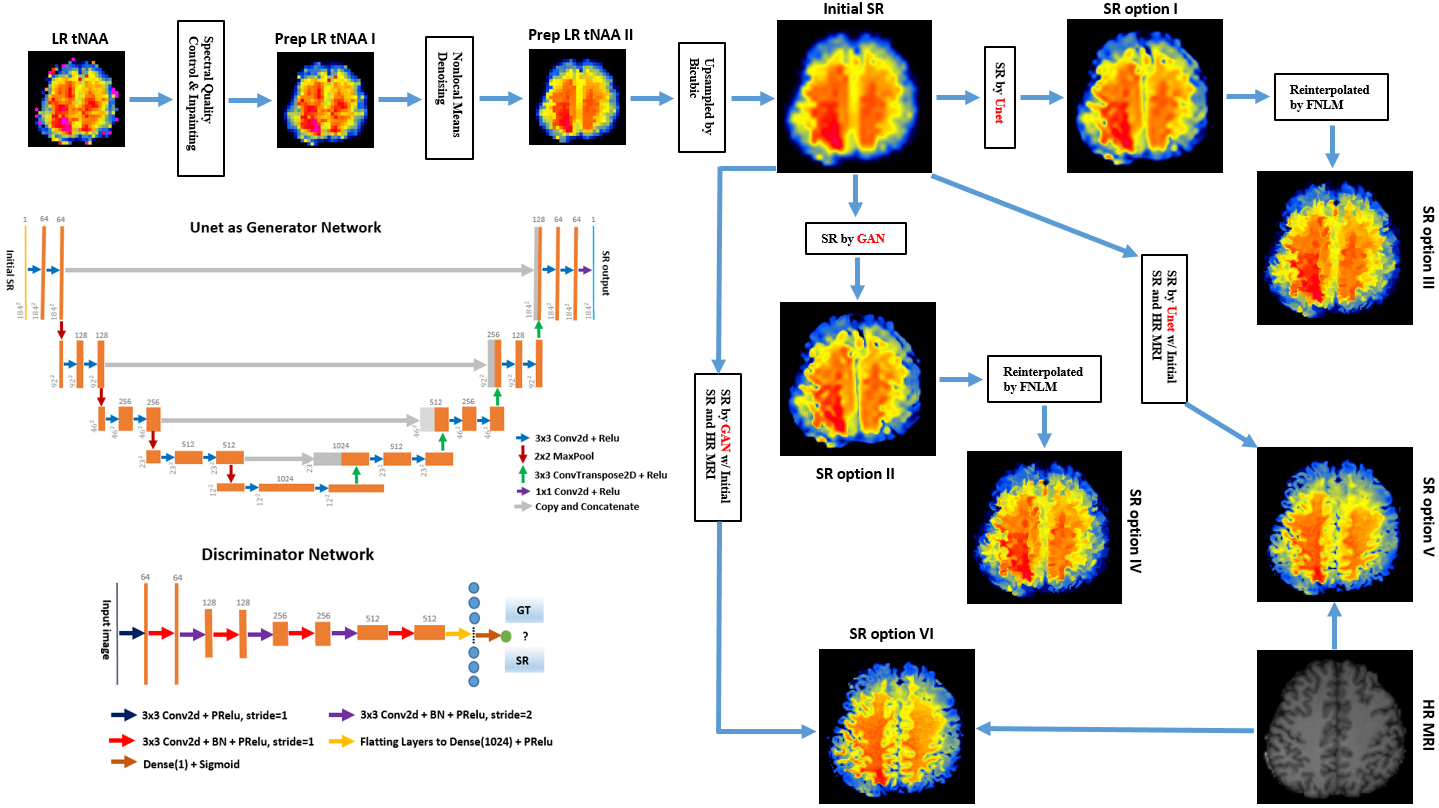
We employed a generative adversarial network (GAN) architecture comprised of a UNet neural network as the generator network and a discriminator network for adversarial training to upsample MR spectroscopic imaging data with a factor of four, which increased the pixel size of the metabolic maps from 5.2 x 5.2 mm2 to 1.3 x 1.3 mm2. To further enhance the resolution of the upsampled metabolic maps and inspired by the work1,2 , we investigate two scenarios by the aid of high resolution (HR) anatomical images: 1) interpolating the super-resolution (SR) metabolic maps obtained either by Unet or GAN iteratively using the weights learned from the SR metabolic maps and HR image prior; 2) inputting an initialized SR metabolic map by conventional interpolation methods such as Bicubic, along with the HR image prior, to the proposed neural network architectures simultaneously. For initial training we simulated a large data set of 9600 images with realistic quality for acquired MRSI to effectively train the deep learning model. The employed neural network architecture and the block diagram was shown in Fig.1. The low resolution MRSI data were obtained at 3T with and adiabatic spin echo spiral sequence3 using: TR/TE=1800/97, k-space matrix 46x46x10, FOV = 240x240x120 mm3 weighted averages, acquisition time of 18:22 min. T1 weighed structural MRI was acquired with 1mm isotropic resolution using MEMPRAGE sequence TI/TR/TE1/TE2/TE3/TE4/ = 1200/2530/1.64/3.5/5.36/7.22 ms, 256×256×176 matrix, FOV 256×256×176 mm3, 5:56 acquisition time. Two types of training have been performed: 1) using only the MRSI data, and 2) using MRSI and prior information from anatomical MRI to further enhance structural details of metabolic maps. The performance of super-resolution methods was evaluated by peak SNR (PSNR), structure similarity index (SSIM), feature similarity index (FSIM), and mean opinion score (MOS). First we present the approach to generating the simulated training dataset to train the employed deep neural network. Simulated metabolic maps are generated using both FLAIR and MEMPRAGE from 75 patients.RESULTS
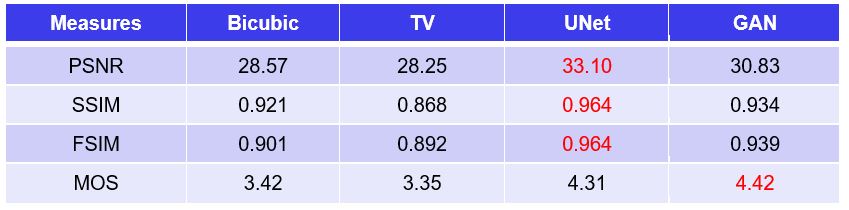
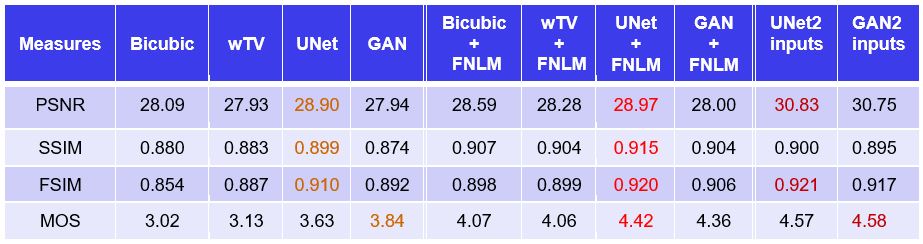
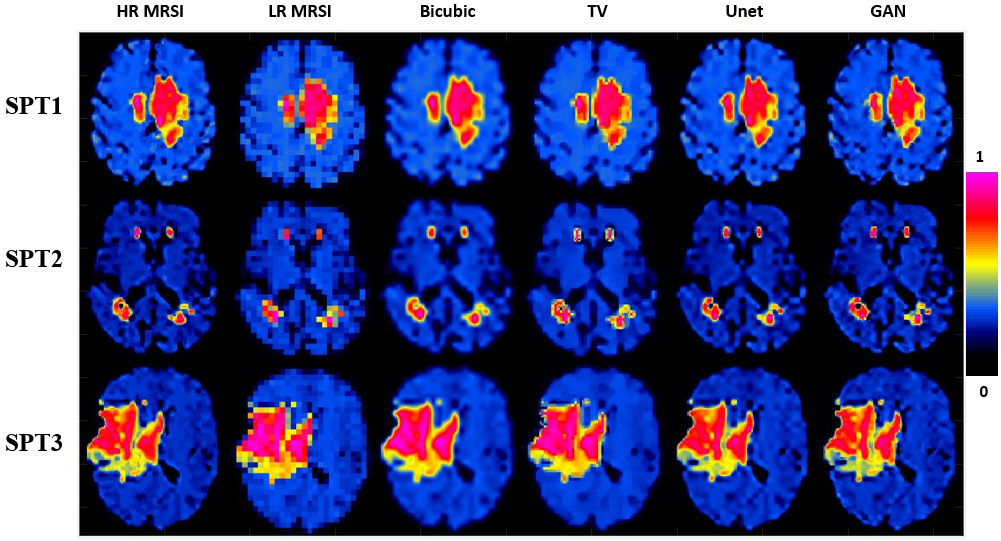
1) Simulated Metabolic MapsTo verify the performance of our SR approaches, we also simulated the testing datasets in the same manner as the training data set that consists of metabolic maps with size 184×184 for two scenarios: 1) metabolic maps with less features; 2) metabolic maps with more features. For each of these two scenarios, we used 80 simulated patient TCN maps as the ground truth in testing data from 20 patients, and each contributes to 4 images to compare the performance of the comparing methods. It should be noted that there is no image prior available for the first scenario, hence for which, we only compare the performance of Bicubic, TV, Unet and GAN. Quantitative estimates of the performance of those methods and their SR maps are shown in Table 1, 2 and Figure 2, 3 respectively.
2) Metabolic Maps from in vivo Human Data
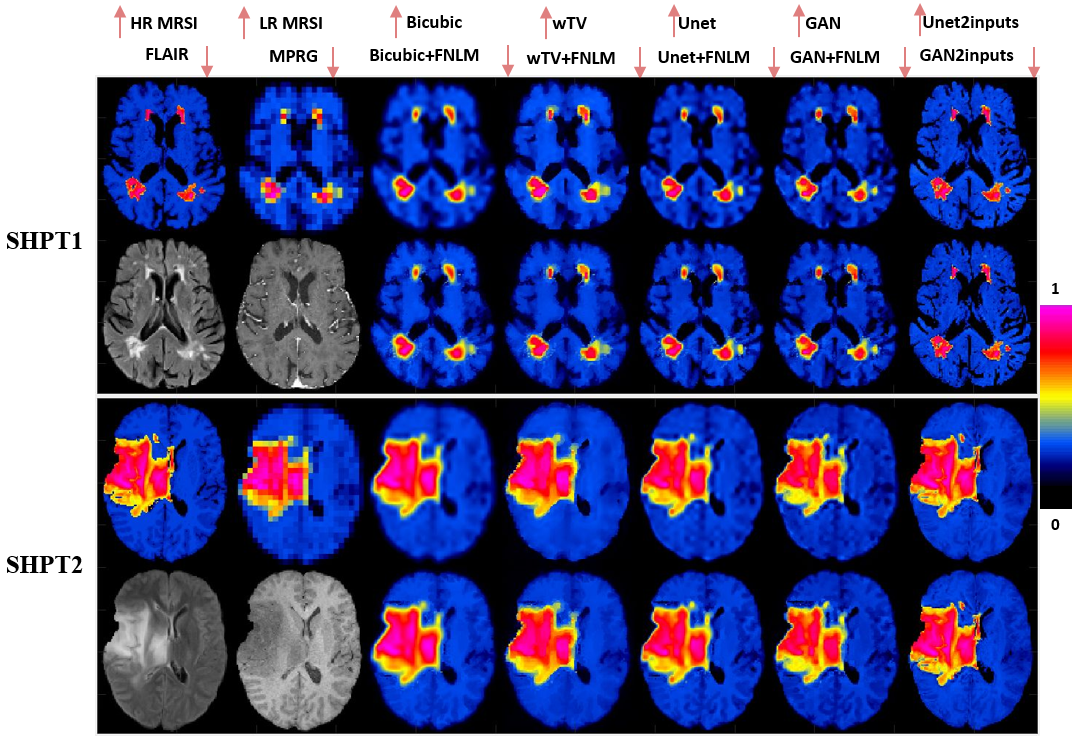
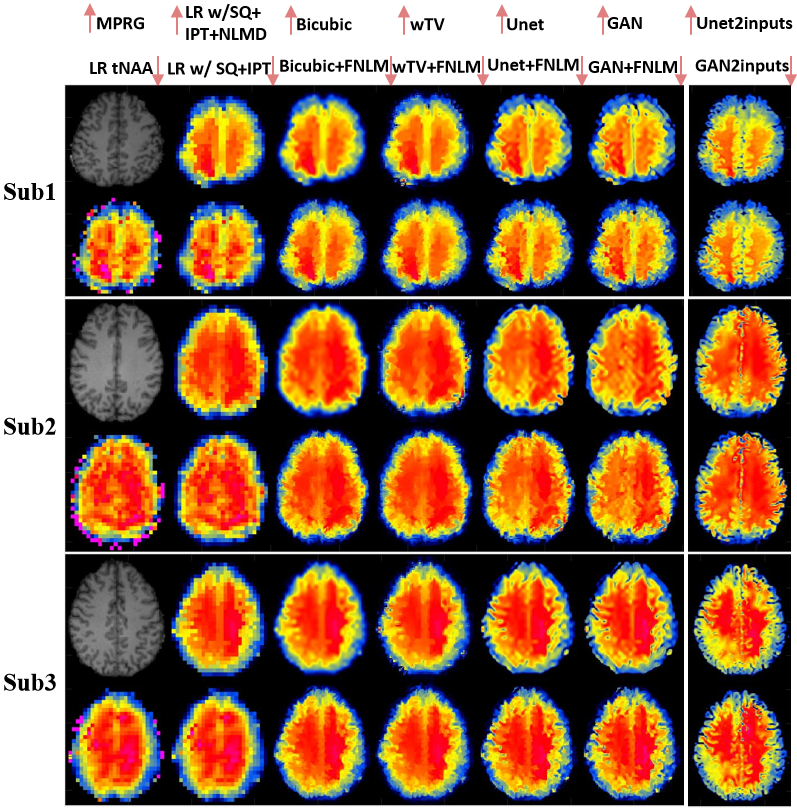
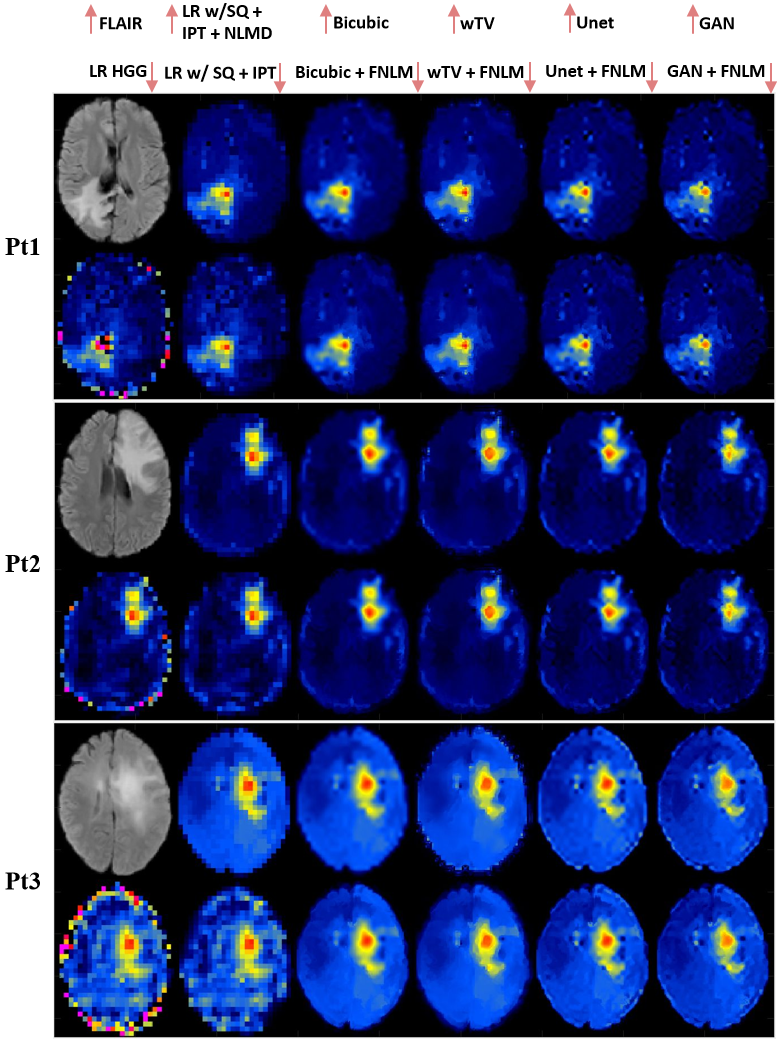
The entire SR framework of Fig. 1 was applied on the data measured in human subjects. tNAA maps from three healthy subjects are shown in Fig. 4. Metabolic ratio maps combining 2HG, Glu and Gln metabolites in three participants with IDH-mutated glioma are shown in Fig. 5.
DISCUSSION/CONCLUSION
Our results indicate that the proposed deep learning methods are promising for enhancing the spatial resolution of metabolite maps, which can be further improved by the aid of high-resolution MR images. Their performance for recovering structural information and tissue contrast is superior to conventional upsampling methods. The results from in vivo data further indicate that the proposed methods have great potential for clinically neuroimaging applications in subjects with both normal anatomy and lesions such as brain tumors. Further validation and verification is underway.Acknowledgements
No acknowledgement found.References
1. Li, X., et.al., Super-Resolution Whole-Brain 3D MR Spectroscopic Imaging for Mapping D-2-Hydroxyglutarate and Tumor Metabolism in Isocitrate Dehydrogenase 1–mutated Human Gliomas. Radiology, 2020.
2. Iqbal, Z., et.al., Super-Resolution 1H Magnetic Resonance Spectroscopic Imaging Utilizing Deep Learning. Front. Oncol., 2019.
3. Esmaeili, M., T. F. Bathen, B. R. Rosen, and O. C. Andronesi, Three-dimensional MR spectroscopic imaging using adiabatic spin echo and hypergeometric dual-band suppression for metabolic mapping over the entire brain, Magn Reson Med, 2016.
Figures