3904
A comparison study of the value of Diffusion Kurtosis Imaging and Amide Proton Transfer imaging in the evaluation of prostate cancer1MR, the First Affiliated Hospital of Xinxiang Medical University, Xinxiang, China, 2MR Research China,GE Healthcare, Xinxiang, China
Synopsis
This study explored the diagnostic value of APT and DKI in prostate cancer(PCa) and benign prostatic hyperplasia(BPH), and compared the diagnostic advantages of the two techniques and their relationship with the risk of prostate cancer. Our study have shown that APT and DKI both can differentiate PCa and BPH, but DKI has higher diagnostic value, and have strong correlation with Gleason score.They all have the potential to be used in routine clinical practice as new indicators to evaluate the risk of PCa, and to help early diagnosis and personalized diagnosis and treatment of PCa.
Introduction
Prostate cancer (PCa) is the second most common cancer in men and the second leading cause of cancer death [1], with its incidence continuing to rise [2]. PCa often occurs simultaneously with benign prostatic hyperplasia and has similar clinical symptoms. Most patients are already in advanced stage of PCa at the time of treatment.Therefore, early accurate diagnosis and evaluation of the aggressiveness of PCa is of great significance. Amide proton transfer (APT) imaging and Diffusion kurtosis imaging(DKI) are two new MRI techniques. APT[3] can detect the content of amino protons and polypeptides in the tissue noninvasively. DKI[4] uses non Gaussian diffusion model to detect the kurtosis information MK and diffusion information MD of tumor molecules. Prostate cancerr(PCa) has a high morbidity and mortality. This study was aim to evaluate and compare the diagnostic value of DKI and APT in PCa, and their correlation with Gleason score(GS).Materials and methods
DKI and APT images of 49 patients with PCa and 51 patients with benign prostatic hyperplasia (BPH) were collected and analyzed, respectively.According to the GS, the patients with PCa were divided into high-risk, intermediate-risk and low-risk groups. The mean kurtosis (MK), mean diffusion(MD) and magnetization transfer ratio asymmetry (MTRasym, 3.5ppm)values among PCa, BPH, and different GS groups of PCa were compared and analyzed respectively. The diagnostic accuracy of each parameter was evaluated by using the receiver operating characteristic (ROC) curve. The correlation between each parameter and GS was analyzed by using Spearman’s rank correlation.Results
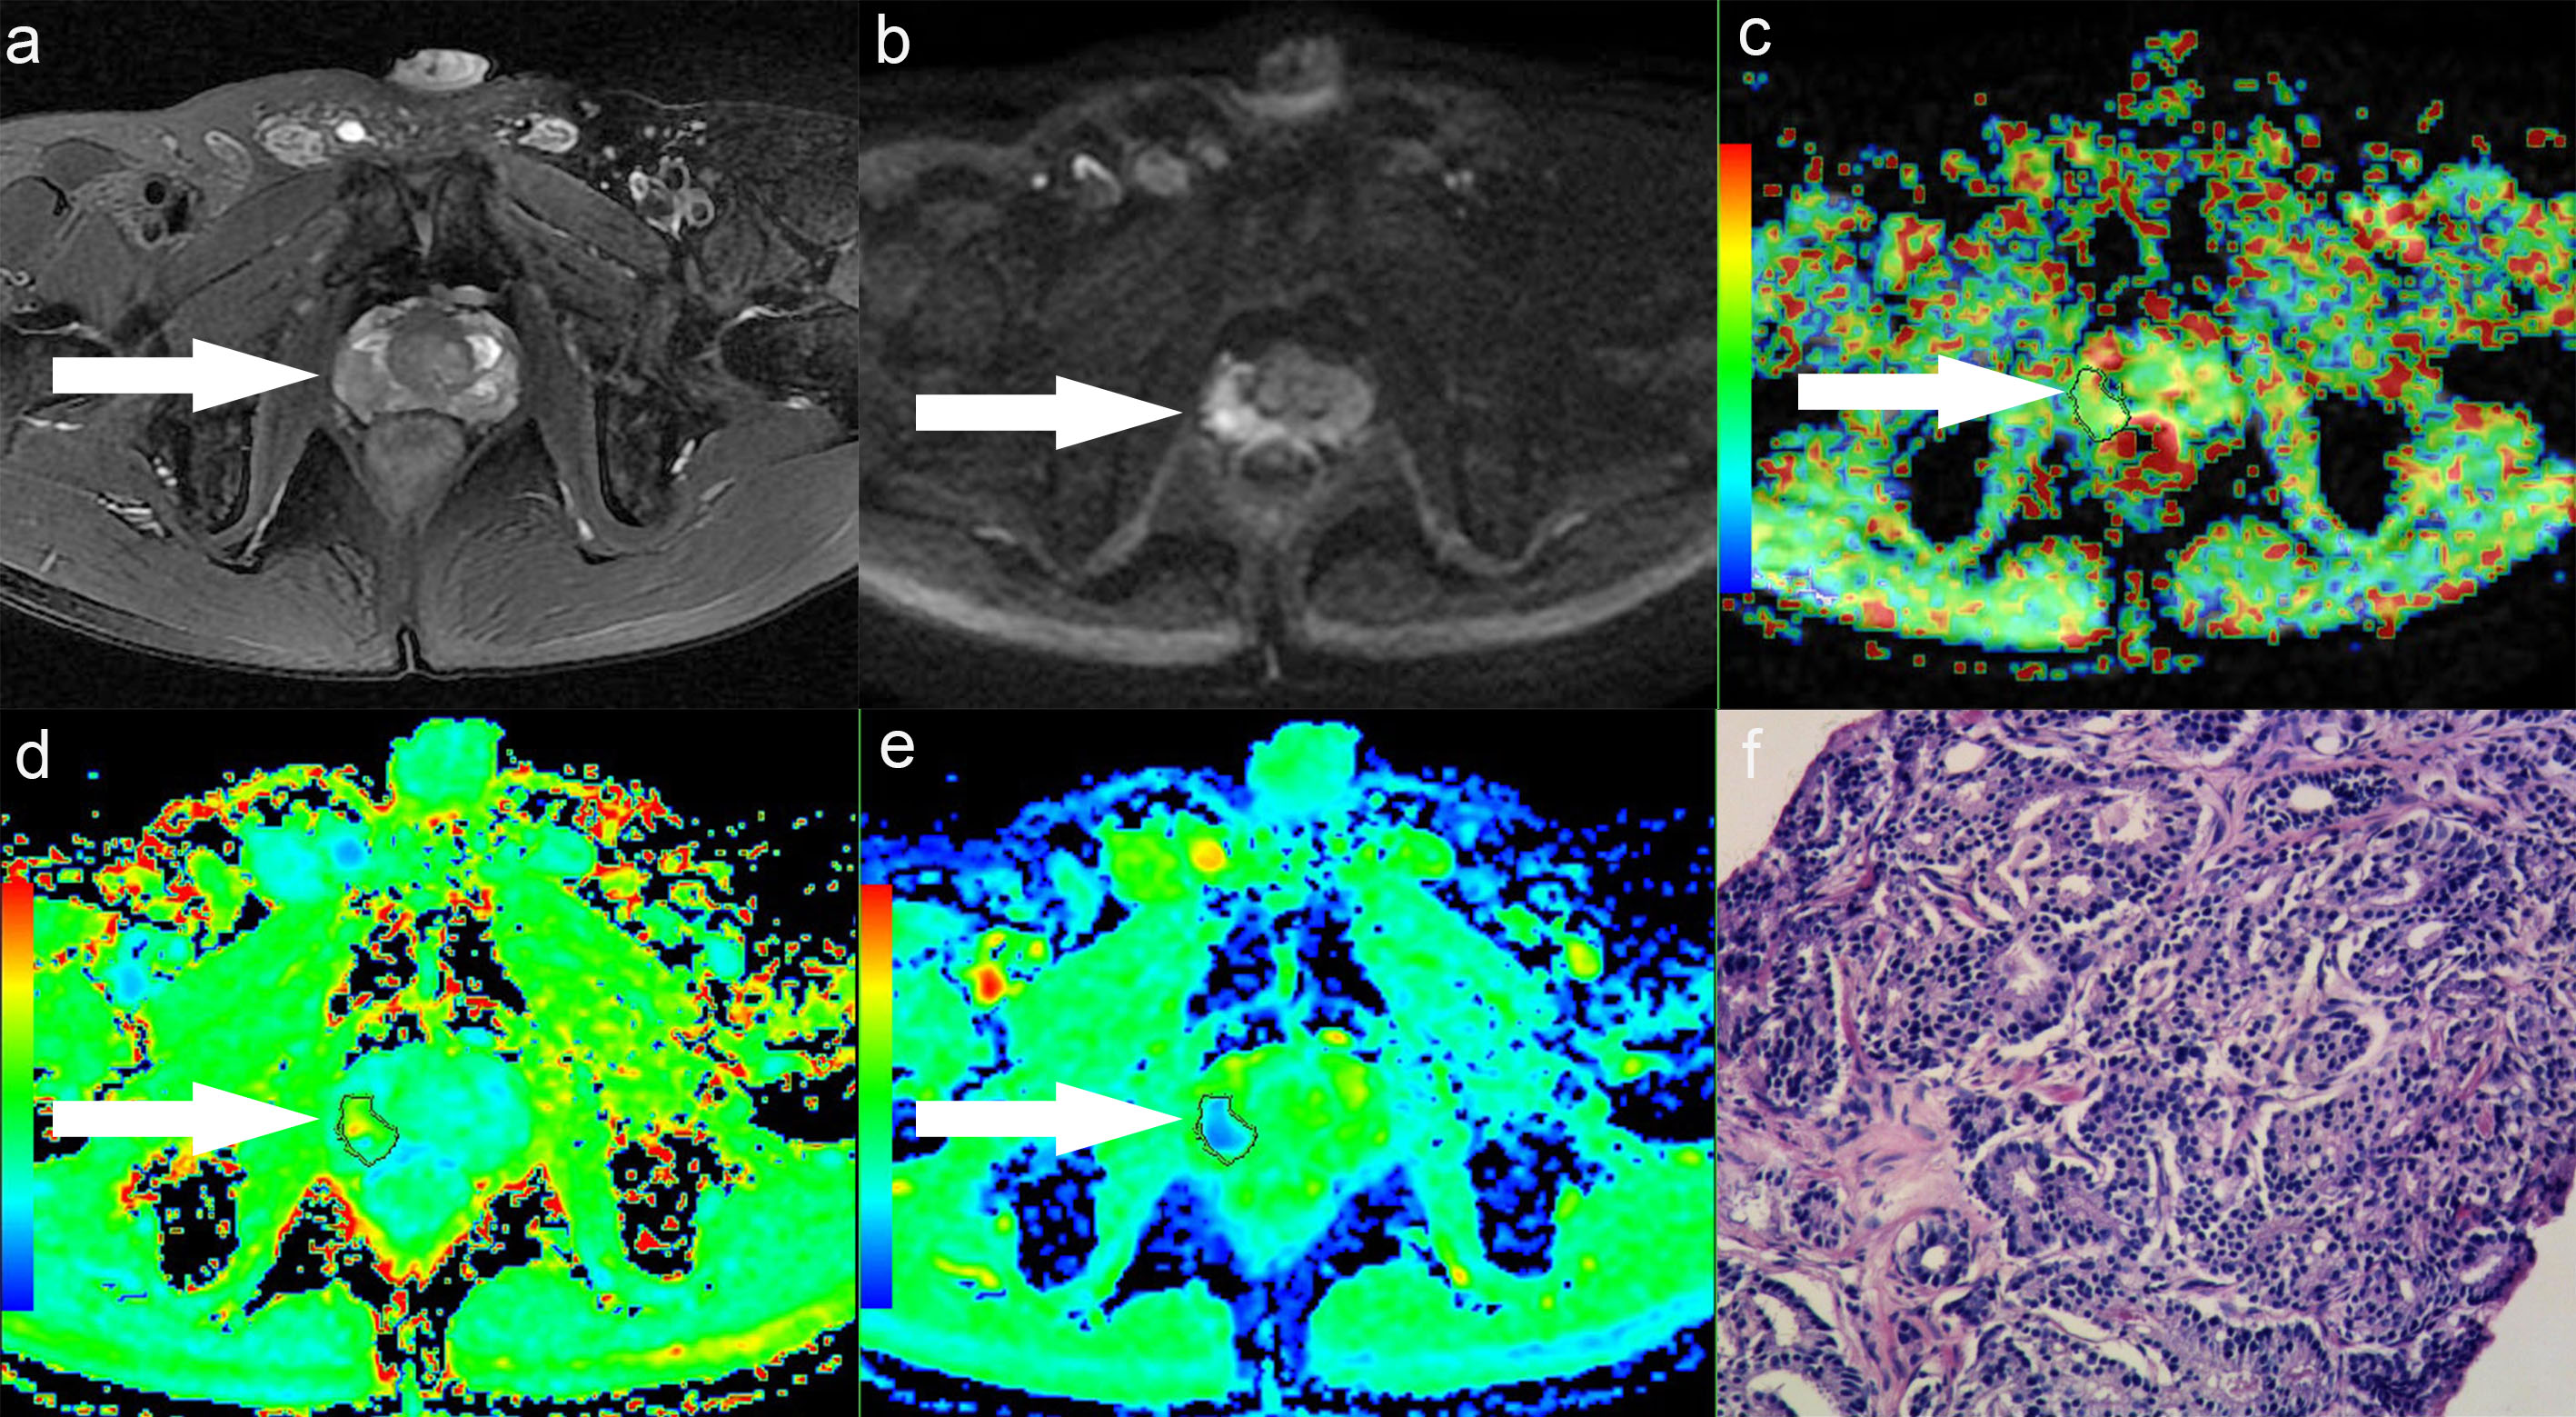
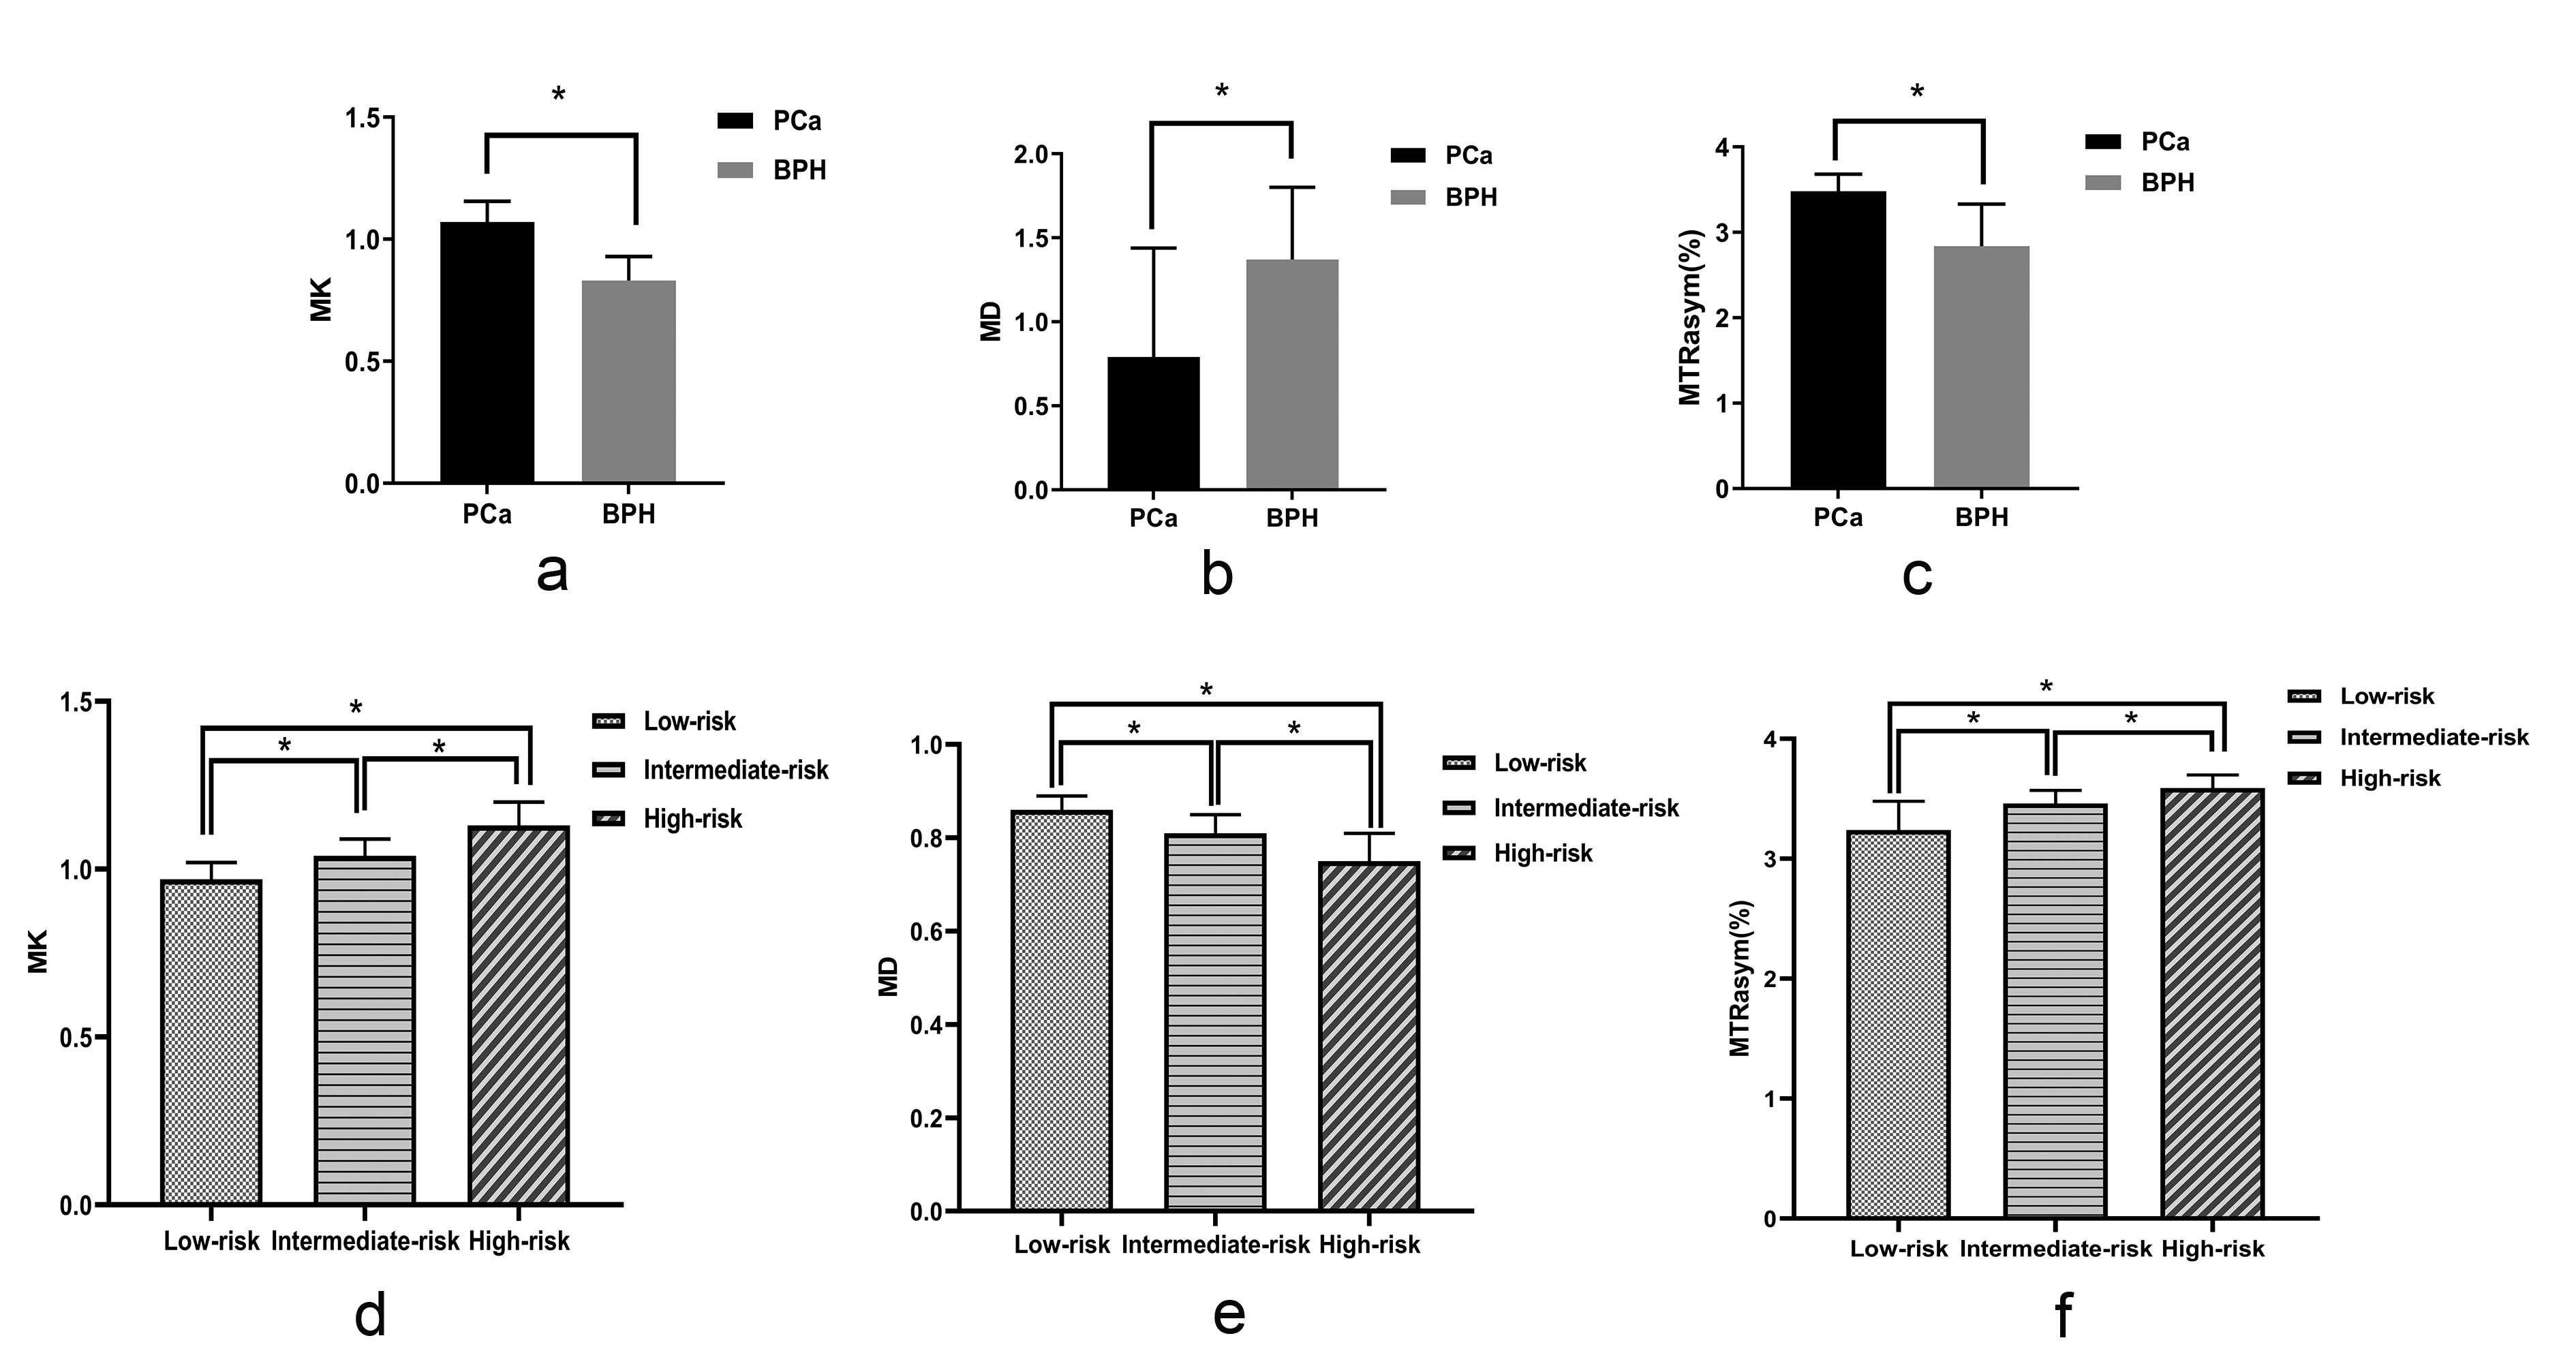
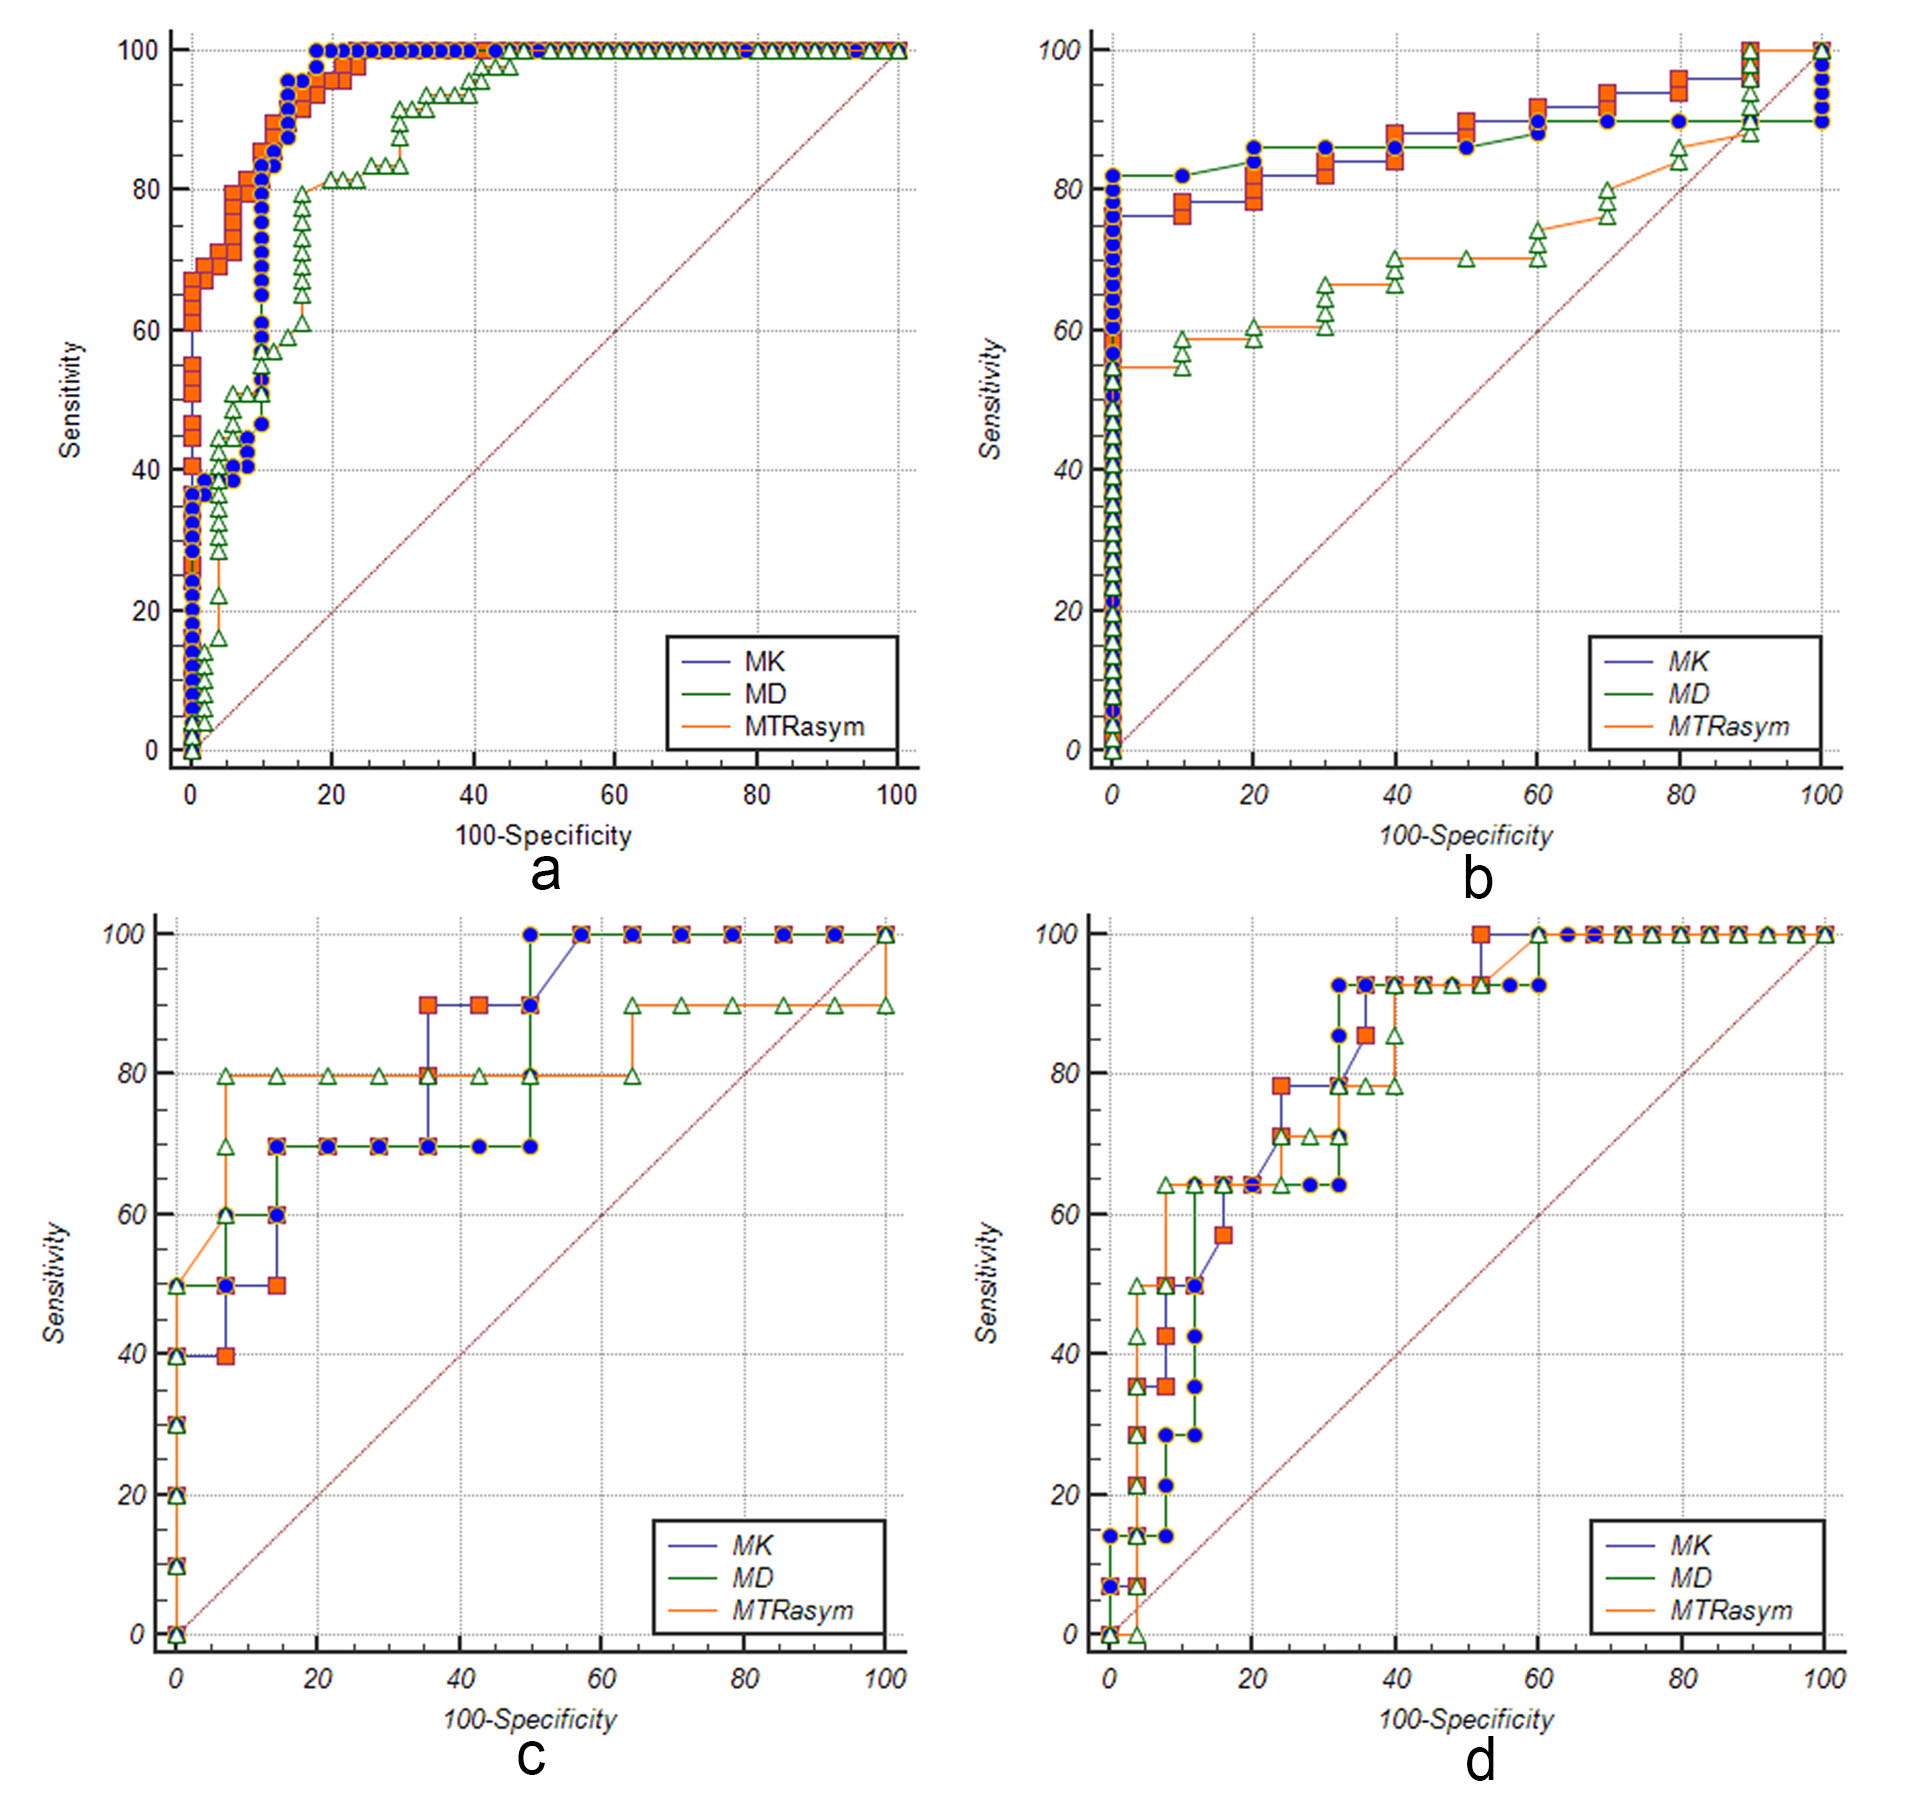
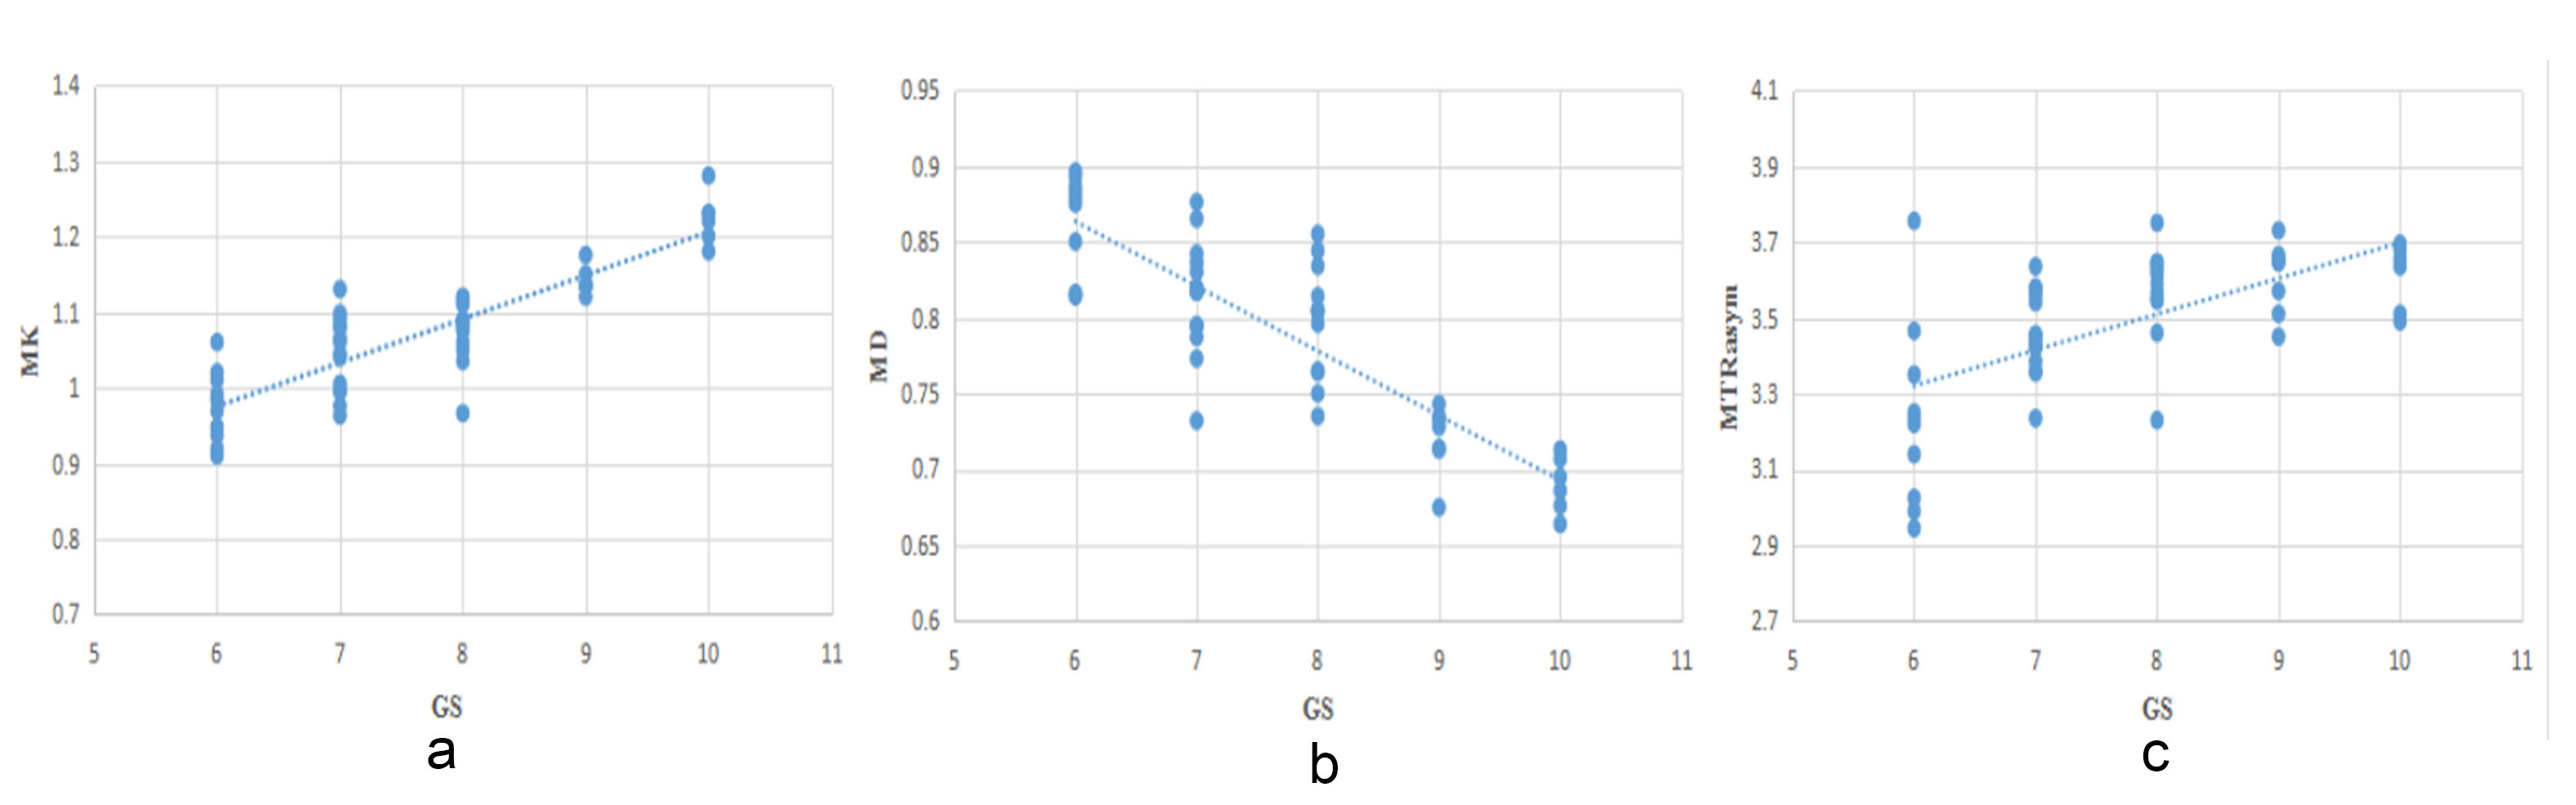
The images of PCa are shown in Fig.1.The MK and MTRasym(3.5ppm) values were significantly higher in PCa group than in BPH group, while the MD value was significantly lower than in BPH group. The differences of MK/MD/MTRasym (3.5ppm) between each two of the low-risk, intermediate-risk, and high-risk groups were all statistically significant(p < 0.05, Fig. 2). The MK value showed the highest diagnostic accuracy in differentiating PCa and BPH, BPH and low-risk, low-risk and intermediate-risk, intermediate-risk and high-risk (AUC=0.965, 0.882, 0.839, 0.836, Fig.3). The MK/MD/MTRasym(3.5ppm) values showed extremely and moderately strong correlation with GS ( r=0.844, -0.811, 0.640, p < 0.05, Fig 4), respectively.Conclusion
DKI shows better performance in the differentiation diagnosis of PCa and BPH and risk assesment than APT. They all are valuable in the diagnosis of PCa and demonstrate correlation with GS.Acknowledgements
We acknowledge the support received from the Henan Medical Science and Technology Research Program.References
1. Siegel RL, Miller KD, Jemal A. Cancer statistics, 2018 [J]. CA Cancer J Clin, 2018, 68: 7-30.
2. Jemal A, Bray F, Center MM,et al. Global cancer statistics. CA Cancer J Clin. 2011 Mar-Apr;61(2):69-90.
3. Zhou J, Payen JF, Wilson DA,et al. Using the amide proton signals of intracellular proteins and peptides to detect pH effects in MRI. Nat Med. 2003 Aug;9(8):1085-1090.
4. Jensen JH, Helpern JA, Ramani A, et al. Diffusional kurtosis imaging: The quantification of non-Gaussian water diffusion by means of magnetic resonance imaging. Magn Reson Med 2005;53:1432-1440.
Figures