3903
23Na MRI in Patients with suspected Prostate Cancer: External and Internal References for Quantification of Tissue Sodium Concentration1Computer Assisted Clinical Medicine, Medical Faculty Mannheim, Heidelberg University, Mannheim, Germany, 2Department of Radiology and Nuclear Medicine, Medical Faculty Mannheim, Heidelberg University, Mannheim, Germany, 3Department of Urology and Urosurgery, Medical Faculty Mannheim, Heidelberg University, Mannheim, Germany, 4Department of Radiology, Kantonspital Baden, Baden, Switzerland, 5Mannheim Institute for Intelligent System in Medicine, Medical Faculty Mannheim, Heidelberg University, Mannheim, Germany
Synopsis
Prostate cancer is the most common tumor in men. 23Na-MRI provides complementary information to multiparametric-MRI. Tissue sodium concentration (TSC) quantification depends on sodium references-usually external phantoms.
This study investigates TSC-quantification based on internal references (iliac-artery).
23Na-MRI of 19 male patients with suspected PCa was included. TSC in the prostate was quantified based on external reference vials and based on the iliac artery.
Three patients showed a PI-RADs-5 lesion and had an elevated TSC which is in alignment with prvious studies. No significant differences between both methods were found in the whole prostate.
Internal references for TSC quantification could simplify 23Na-MRI.
Introduction
Prostate cancer (PCa) is the most commonly diagnosed tumor and second leading cancer-related cause of death in men worldwide[1-3]. Multiparametric-MRI (mpMRI) according to the established PI-RADS guidelines is of high value for the PCa detection[4]. On T2-weighted MRI, PCa is commonly depicted as low-signal-intensity region[5,6]. Combining different MRI techniques leads to higher accuracy for the PCa detection[7-9]. However, diagnostic accuracy is affected by benign diseases and cancer-mimics such as prostatitis or atypical BPH nodules which may express similar appearances on MRIs[10].Quantitative 23Na-MRI and the resulting tissue sodium concentration (TSC) can provide information about cell vitality and activity[11,12]. Previous studies have shown an increase in TSC within various tumors and correlations between TSC and tumor malignancies[13-15]. Therefore, 23Na-MRI has the potential to become a biomarker for prostate cancer diagnosis and characterization of tumor aggressiveness providing complementary information to existing mpMRI[10,16-18].
To achieve this, precise TSC quantification is crucial and requires references with a known sodium concentration. Positioning of reference phantoms within the field of view (FoV) is well established but quantification accuracy decreases with an increasing distance to the region of interest (ROI) such as the prostate. Thus, internal 23Na references are warranted. TSC within the human blood shows little individual variation[19,20] and is around 85mM which points towards the usage of periprostatic blood vessels as references located close to the ROI.
The study compares two different methods for TSC quantification within the prostatic tissue based on external (method1) and internal (method2) references.
Methods
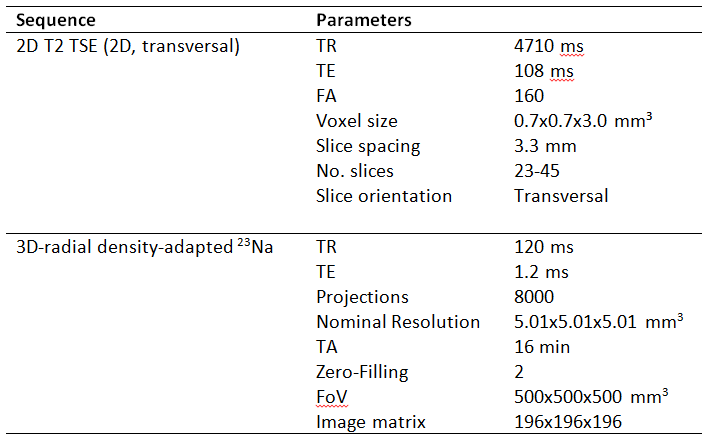
We prospectively included 22 male patients with clinically suspected PCa. Data acquisition was successful for 19 patients (66.1±7.0 years).Each patient underwent a standard mpMRI of the prostate according to the ACR PI-RADS guidelines[21] at 3T (Magnetom Skyra, Siemens Healthcare GmbH, Erlangen, Germany). In addition, the coil was changed to a dual-tuned-1H/23Na 16-channel body-coil (Rapid Biomedical, Rimpar, Germany) and the study protocol followed comprising a 23Na 3D-radial density-adapted sequence[22] (Table1). The reference amplitude was optimized for each patient individually based on calibrations performed prior to the sequence. A 1H-2D-Turbo-Spin-Echo (TSE) (Table 1) was acquired with the dual-tuned coil for optimal image co-registration. During the measurements, four reference phantoms (2x50mM, 2x100mM NaCl, 4% Agarose each, ∅=25mm) were positioned on both sides of the patient.
The acquired 23Na-MRI was reconstructed offline in MATLAB 2018a (Mathworks Inc., Natick, MA, USA). The B1-inhomogeneities were corrected with a scan of a homogenous phantom filled with a saline solution resulting in a correction factor for each image voxel within the phantom region.
Image co-registration of the 23Na-MRI to the T2w-MRI was performed in MATLAB by resampling the 23Na-MRI to the T2w resolution and slice positioning alignment. Segmentation of the prostate into its transitional zone (TZ) and peripheral zone (PZ) was performed in MITK (German Cancer Research Center, Heidelberg, Germany) by a radiologist on the T2w-MRI (Figure 1-A).
Two different methods for the TSC quantification were applied:
1.Quantification based on the external reference phantoms
2.Quantification based on internal reference (iliac arteries).
For both methods, volumes of interest (VOIs) were defined within the 23Na-MRI and a linear fit was performed based on its mean signal-intensity. For the first method, quantification was performed on the original 23Na-MRI after the B1-correction (Figure 1-B). The second quantification method was performed after B1-correction and image co-registration to the T2w-TSE for a more precise view of the iliac vessels (Figure 1-C).
Results
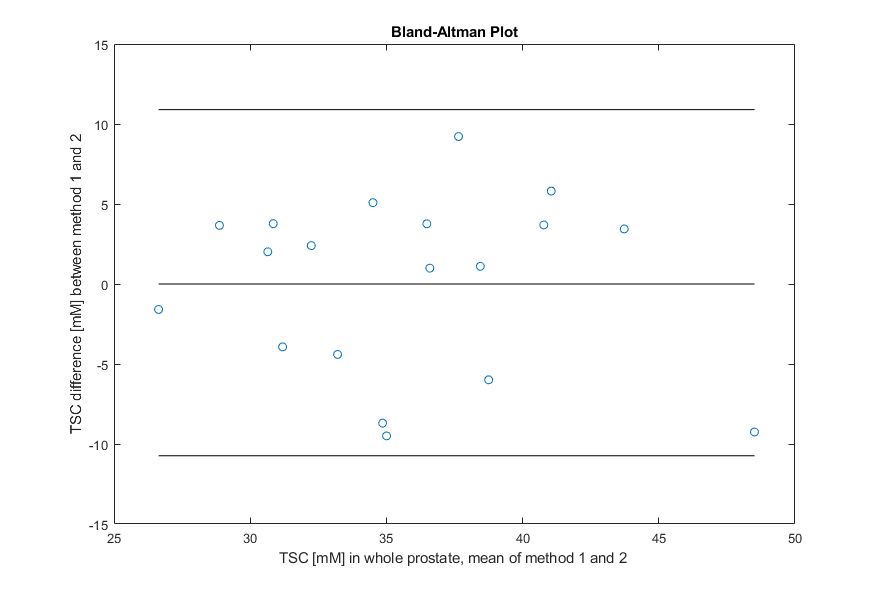
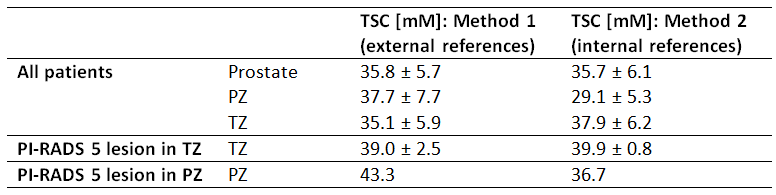
All 19 patients showed a mean TSC of 35.8±5.7mM (method1) versus 35.7±6.1mM (method2) in the whole prostate and mean difference between both quantification methods was 4.6±2.7mM, with no statistically significant difference (p=0.95); Table 2. Figure 2 depicts the Bland Altman plot comparing both methods.Two of the examined patients had a PI-RADS 5 lesion in the TZ with a mean TSC of 40.8mM and 37.3mM (method1) and 40.5mM and 39.3mM (method2). One patient showed a PI-RADS 5 lesion within the PZ (43.3±10.4mM and 36.7±7.5mM). The remaining 16 patients had no lesions or lower rated ones. TSC in patients with PCa was higher than mean TSC of all patients within the method and anatomical region, Figure 3.
Discussion
In this study we investigated whether 23Na quantification in the human prostate is affected by the choice of an internal (e.g. iliac arteries) versus the commonly used external references. The mean TSC difference within the whole prostate is below 5mM between both quantification methods, which is within the standard deviation of the study population.The results of both methods are in alignment with previously published results from Barrett et al.[16,17].
Particularly the results within the patients with PI-RADS 5 lesion are promising, considering the fact that an elevated TSC was found within the affected region with both methods pointing towards an elevated TSC within malignant lesions.
The internal reference could be used as an alternative to external vials. However, correlations with the individuals‘ blood sodium concentrations could facilitate the validation of sodium levels in future investigations.
Conclusion
The study shows that using internal references for TSC quantification in the human prostate is feasible and results are similar to those of external references and literature. This might simplify the application of 23Na-MRI in future clinical research as correct positioning of external references would become obsolete.Acknowledgements
This research project is partly supported of the Research Campus M2OLIE funded by the German Federal Ministry of Education and Research (BMBF) within the Framework “Forschungscampus: public-private partnership for Innovations” under the funding code 13GW0388A.References
[1] Jennings, D., et al., Early response of prostate carcinoma xenografts to docetaxel chemotherapy monitored with diffusion MRI. Neoplasia, 2002. 4(3): p. 255-262.
[2] Murphy, G., et al., The expanding role of MRI in prostate cancer. American Journal of Roentgenology, 2013. 201(6): p. 1229-1238.
[3] Siegel, R.L., K.D. Miller, and A. Jemal, Cancer statistics, 2019. CA: a cancer journal for clinicians, 2019. 69(1): p. 7-34.
[4] Dickinson, L., et al., Magnetic resonance imaging for the detection, localisation, and characterisation of prostate cancer: recommendations from a European consensus meeting. European urology, 2011. 59(4): p. 477-494.
[5] Schiebler, M.L., et al., Current role of MR imaging in the staging of adenocarcinoma of the prostate. Radiology, 1993. 189(2): p. 339-352.
[6] De Visschere, P.J., et al., Role of MRI in follow-up after focal therapy for prostate carcinoma. American Journal of Roentgenology, 2010. 194(6): p. 1427-1433.
[7] Nowak, J., et al., The value of ADC, T2 signal intensity, and a combination of both parameters to assess Gleason score and primary Gleason grades in patients with known prostate cancer. Acta Radiologica, 2016. 57(1): p. 107-114.
[8] Lantis, J.S., K.J. Kille, and M. Krain, The state of the active teaching and learning literature, in Oxford Research Encyclopedia of International Studies. 2010.
[9] Gupta, R.T., et al., Multiparametric prostate MRI: focus on T2-weighted imaging and role in staging of prostate cancer. Abdominal Radiology, 2016. 41(5): p. 831-843.
[10] Hausmann, D., et al., Apparent diffusion coefficient and sodium concentration measurements in human prostate tissue via Hydrogen-1 and Sodium-23 magnetic resonance imaging in a clinical setting at 3 T. Investigative radiology, 2012. 47(12): p. 677-682.
[11] Thulborn, K.R., Quantitative sodium MR imaging: A review of its evolving role in medicine. Neuroimage, 2018. 168: p. 250-268.
[12] Boada, F.E., et al., Quantitative in vivo tissue sodium concentration maps: The effects of biexponential relaxation. Magnetic Resonance in Medicine, 1994. 32(2): p. 219-223.
[13] Ouwerkerk, R., et al., Elevated tissue sodium concentration in malignant breast lesions detected with non-invasive 23Na MRI. Breast Cancer Res Treat, 2007. 106(2): p. 151-60.
[14] Thulborn, K.R., et al., Quantitative tissue sodium concentration mapping of the growth of focal cerebral tumors with sodium magnetic resonance imaging. Magnetic Resonance in Medicine: An Official Journal of the International Society for Magnetic Resonance in Medicine, 1999. 41(2): p. 351-359.
[15] Poku, L.O., et al., 23Na‐MRI as a Noninvasive Biomarker for Cancer Diagnosis and Prognosis. Journal of Magnetic Resonance Imaging, 2020.
[16] Barrett, T., et al., Molecular imaging of the prostate: Comparing total sodium concentration quantification in prostate cancer and normal tissue using dedicated 13C and 23Na endorectal coils. Journal of Magnetic Resonance Imaging, 2020. 51(1): p. 90-97.
[17] Barrett, T., et al., Quantification of total and intracellular sodium concentration in primary prostate cancer and adjacent normal prostate tissue with magnetic resonance imaging. Investigative Radiology, 2018. 53(8): p. 450-456.
[18] Broeke, N.C., et al., Characterization of clinical human prostate cancer lesions using 3.0‐T sodium MRI registered to Gleason‐graded whole‐mount histopathology. Journal of Magnetic Resonance Imaging, 2019. 49(5): p. 1409-1419.
[19] Lott, J., et al., Corrections of myocardial tissue sodium concentration measurements in human cardiac 23Na MRI at 7 Tesla. Magnetic resonance in medicine, 2019. 82(1): p. 159-173.
[20] Ouwerkerk, R., R.G. Weiss, and P.A. Bottomley, Measuring human cardiac tissue sodium concentrations using surface coils, adiabatic excitation, and twisted projection imaging with minimal T2 losses. Journal of Magnetic Resonance Imaging: An Official Journal of the International Society for Magnetic Resonance in Medicine, 2005. 21(5): p. 546-555.
[21] CommitteeOnPI-RADS. Prostate Imaging – Reporting and Data System 2019 Version 2.1; Available from: https://www.acr.org/-/media/ACR/Files/RADS/PI-RADS/PIRADS-V2-1.pdf.
[22] Nagel, A.M., et al., Sodium MRI using a density-adapted 3D radial acquisition technique. Magn Reson Med, 2009. 62(6): p. 1565-73.
Figures
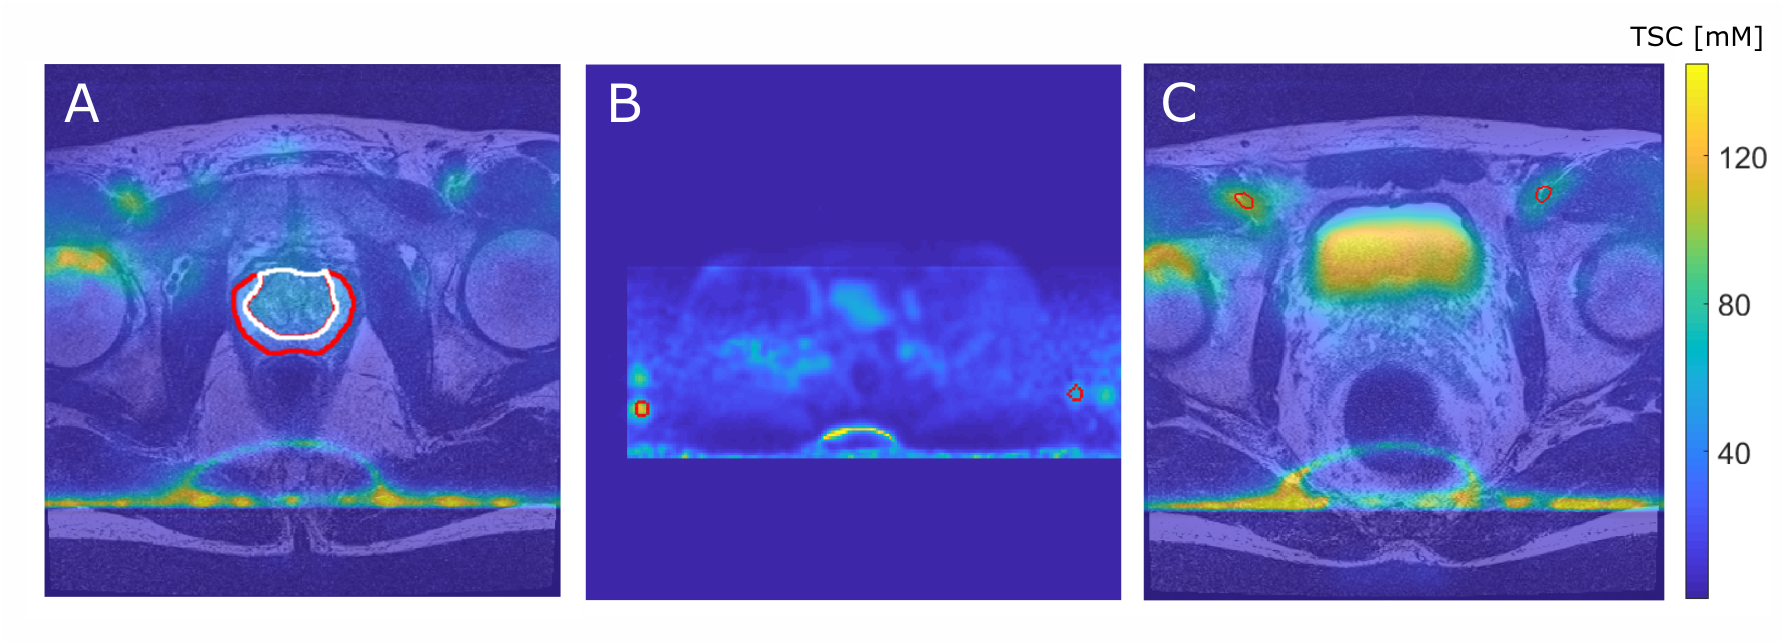
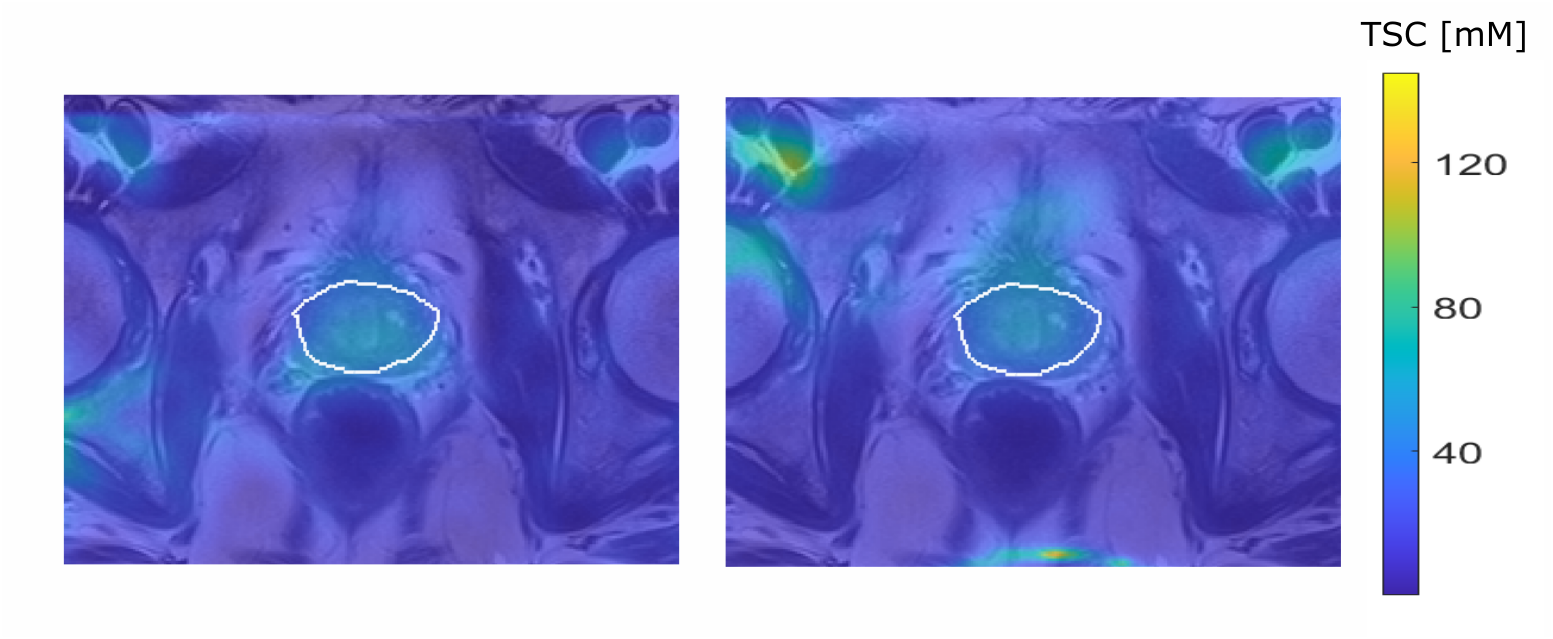
Figure 1:
A: T2w and coregistered 23Na MRI illustrated as overlay with the TZ (white) and the PZ (red).
B: TSC quantification based on reference vials prior to image co-registration (method 1, vials encirecled in red).
C: Quantification based on VOIs within the iliac artery after image co-registration to the T2w image (method 2, iliac arteries encircled in red).
For all three images a slice was chosen that best depicts the corresponding ROI. Images show high intensity lines at the bottom which are artifacts that were caused by the B1-corrections.