3902
Effectiveness of split dose of gadoterate meglumine injection using 30% and 70% of standard dose to detect prostate cancer using ultrafast DCE-MRI1Radiology, The University of Chicago, Chicago, IL, United States, 2Pathology, The University of Chicago, Chicago, IL, United States
Synopsis
We evaluated dynamic contrast enhanced MRI with a split injection protocol for diagnosis of prostate-cancer. We injected 30% of the standard dose, followed after two mins by 70% of the standard dose of gadoterat-meglumine. A signal intensity form of the standard Tofts model was used to extract physiological parameters. On average cancer had larger Ktrans and smaller ve than normal tissue obtained from both doses. Receiver operating characteristic analysis showed that area under curve was 0.776 for a combination of all parameters from the 30% and 70% doses. The split injection protocol combined with quantitative analysis may increase diagnostic accuracy.
INTRODUCTION
Clinical use of MRI contrast media has not changed in 30 years [1-3] and is based on seminal papers demonstrating efficacy of a single bolus injection. This early work resulted in major improvements clinical imaging. However, since this early work there have been dramatic advances in MRI technology including significant increases in field strength and improvements in contrast agents. To take advantage of new MRI and contrast media technology, we propose innovative clinical applications of a split contrast media dose injection for dynamic contrast enhanced (DCE) MRI. Data acquired following the low dose provides an accurate arterial input function (AIF) and facilitates quantitative analysis. Comparison of the response to low and high doses may provide information about water exchange, which is a marker for cancer [4].This study evaluated a split dose injection of gadoterate meglumine (Dotarem, Guerbet LLC, Princeton NJ, USA). 30% of a standard dose of Dotarem was injected, and then after two minutes 70% of standard dose was injected. The signal intensity form of the Tofts pharmacokinetic model (SI-Tofts; [5]) was used to quantitatively analyze data from both the 30% and 70% doses. In addition, we combined information from the two doses using binary logistic regression to obtain novel diagnostic information.
METHODS
Thirteen patients with biopsy-confirmed prostate cancer were included in this IRB-approved study. MRI data were acquired on a Philips Achieva 3T-TX scanner without an endorectal coil. After T2-weighted and diffusion-weighted imaging, DCE 3D T1-FFE data were acquired pre- and post- DOTAREM injection of 0.03 mmol/kg (TR/TE=4.153/1.52 ms, FOV=200×200 mm2, matrix size=224×224, flip angle=10°, slice thickness=3 mm, number of slices=24, SENSE factor=1.5, half scan factor=0.675) for 95 dynamic scans with temporal resolution of 3.01 sec/image. Finally, the DCE 3D protocol was repeated pre- and post- DOTAREM injection of 0.07 mmol/kg (TR/TE=6.115/1.52 ms) for 150 dynamic scans with temporal resolution of 4.43 sec/image.Regions-of-interest (ROIs) for prostate cancer (n=22) and normal tissue (n=30) in different prostate zones were drawn on T2W images and transferred to DCE images. ROIs for blood vessels were manually traced on the iliac artery on a slice with cancer. Average signal intensity (S(t)) as function of time (t) was calculated for each ROI. To minimize noise effects, blood signal intensity ($$$S_{br}(t)=\frac{S_b(t)-S_b(0)}{S_b(0)}$$$) was fitted with an empirical mathematical model (EMM) [6]:
$$S_{br}(t)=\arctan(10t)\cdot[1+\sum_{n=1}^2A_n\exp(-(t-\tau_n)^2/2\sigma_n^2)]{\cdot}B\cdot\exp(-\beta{t}),-----(1)$$
where t is in minutes, An and B are scaling constants, τn and σn (n=1, 2) are the center and width of a Gaussian function, and β is the decay constant. Only one Gaussian function was used for 70% of standard dose. For cancer and tissue signal intensity ($$$S_{r}(t)=\frac{S(t)-S(0)}{S(0)}$$$ ), the physiological parameters (Ktrans and ve) were extracted by using SI-Tofts model as follows [5]:
$$S_{r}(t)=\lambda\frac{S_b(0)}{S(0)(1-Hct)}K^{trans}\int_{0}^{t} S_{br}(t)\exp(-\lambda(t-\tau){K^{trans}}/v_e)d\tau,-----(2)$$
where Hct=hematocrit (=0.42), 𝜆=T1(blood)/T1(tissue) with literature values of T1(blood)=1.70 sec and T1(prostate-tissue)=1.55 sec. Student’s T-test was performed to test differences in calculated parameters between cancer and normal tissue and between data from 30% and 70% of standard dose. Receiver operating characteristic (ROC) analysis was used to evaluate performance in differentiating cancer from normal tissue. Binary logistic regression was used to assess combinations of parameters from the 30% and 70% doses.
RESULTS
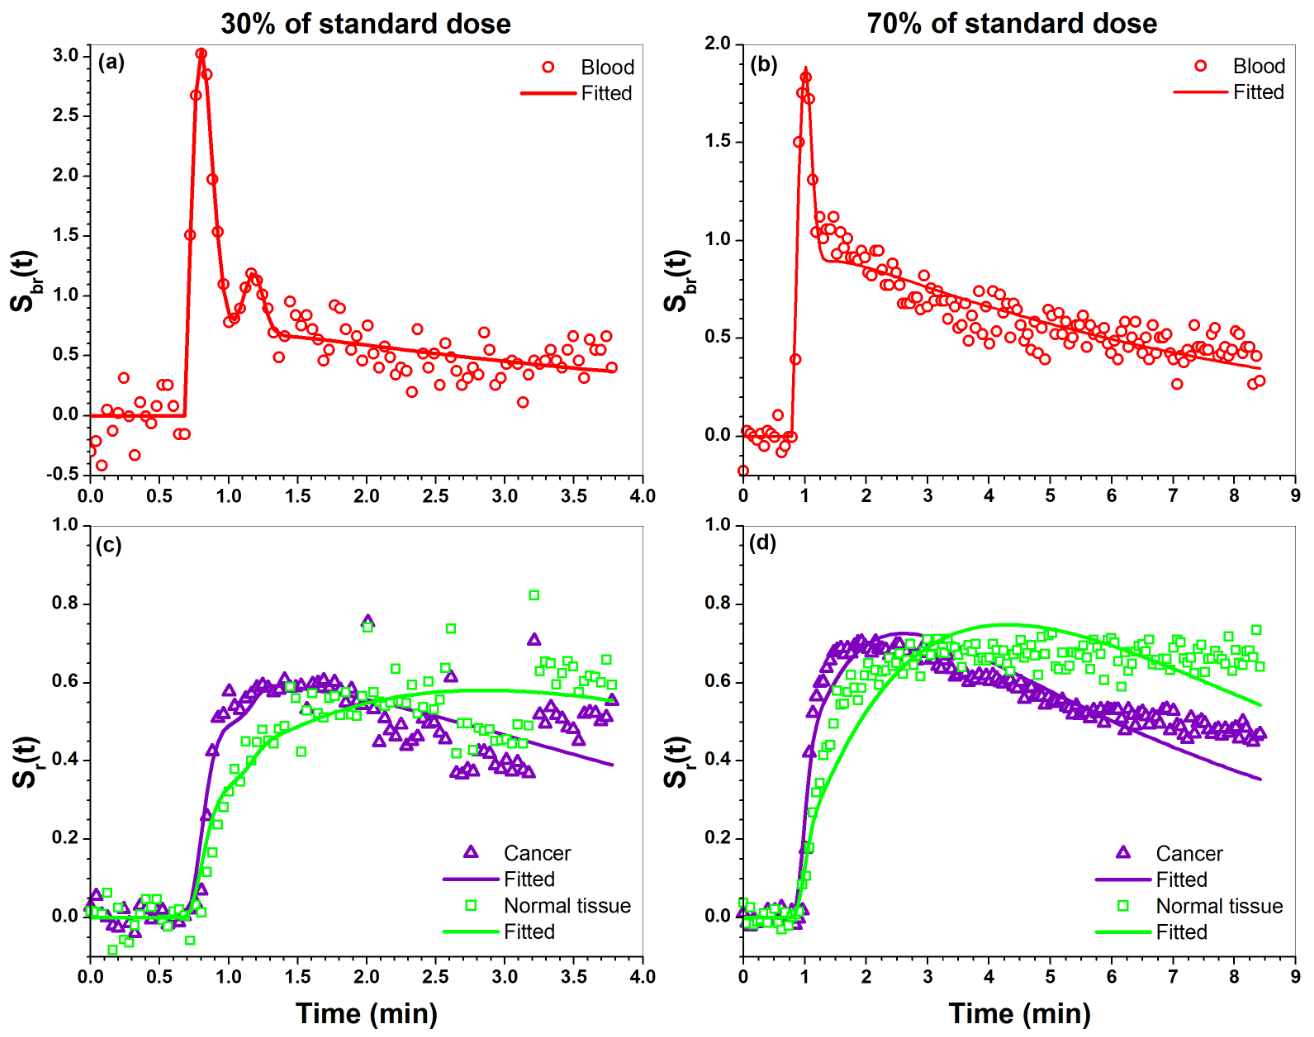
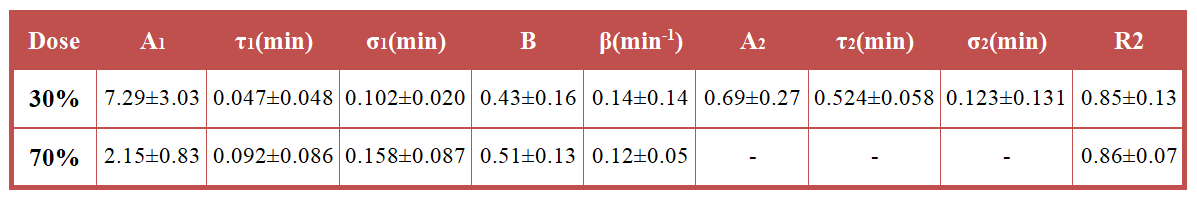
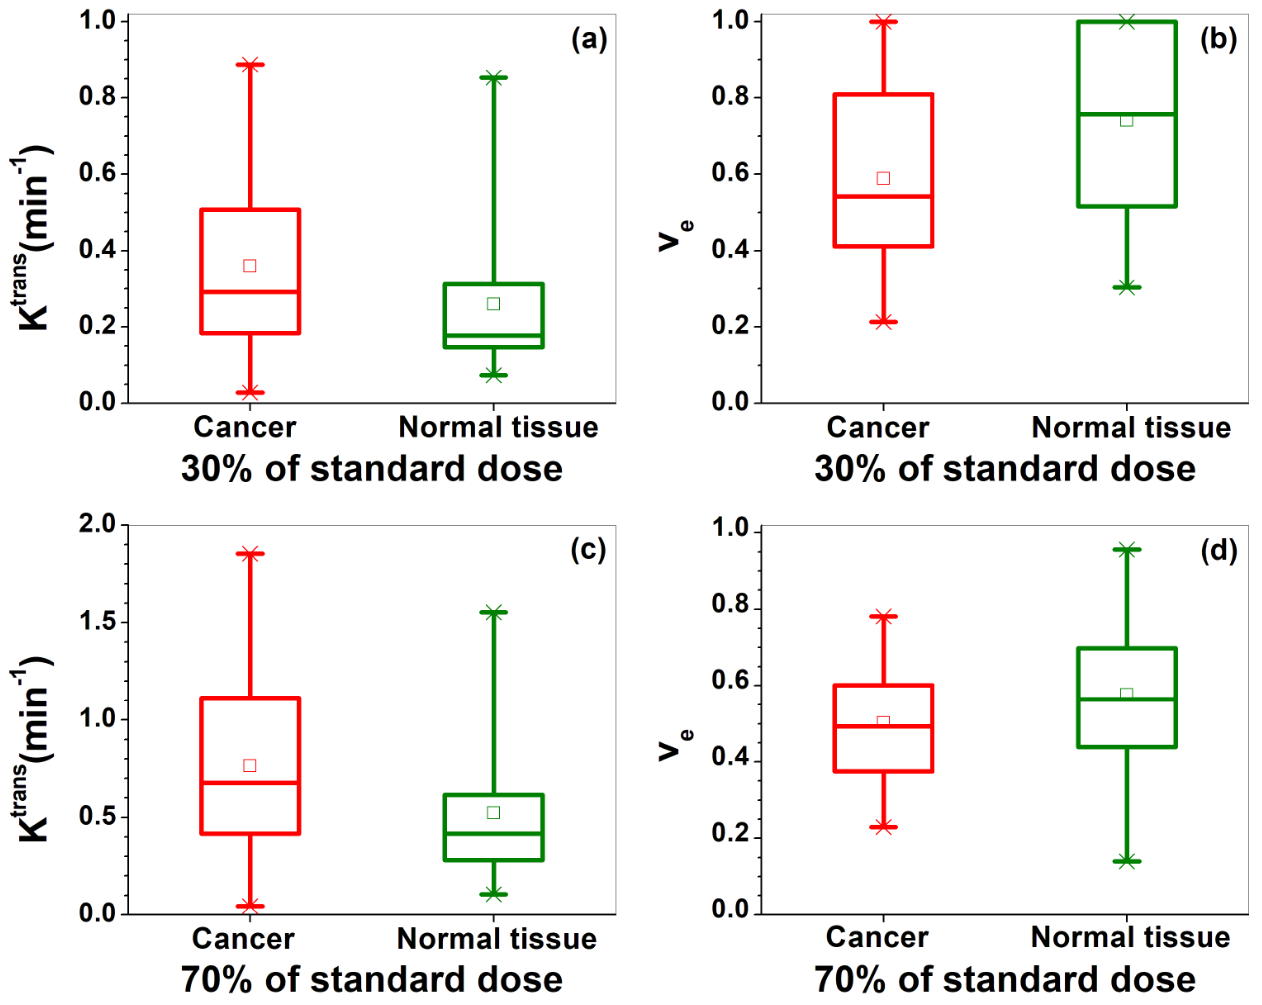
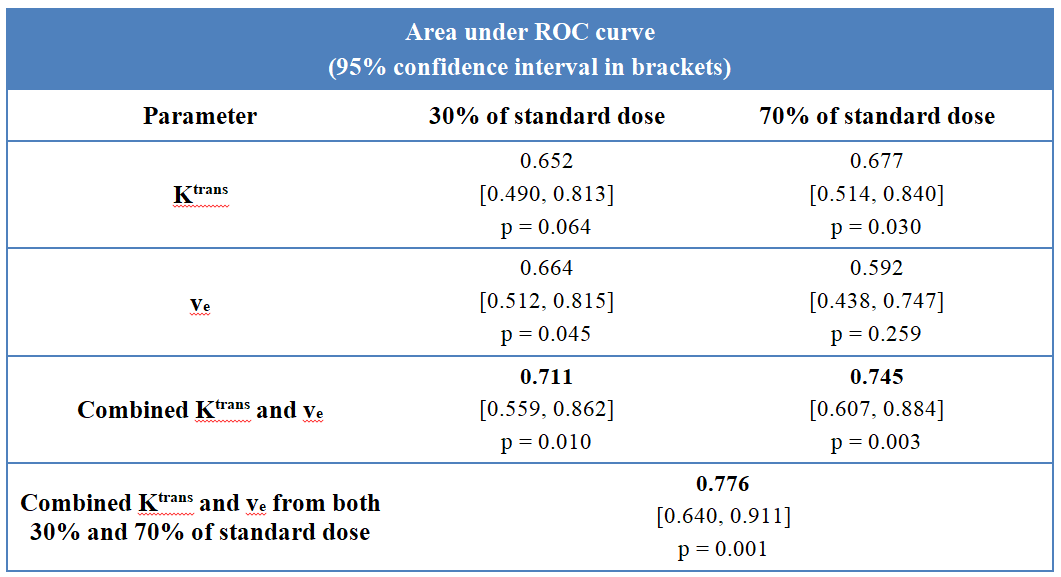
Figure 1 (a-b) shows an example of blood Sbr(t) measured from 67 years old patient for (a) 30% and (b) 70% of standard dose with corresponding EMM fits, and (c-d) shows cancer/tissue Sr(t) with corresponding the SI-Tofts model fits. The average EMM fitted parameters for Sbr(t) from thirteen patients are given in Table 1. The parameter A1 is significantly larger for 30% dose than 70% dose, which means the Sbr(t) had higher peak magnitude for 30% than 70% dose. Figure 2 compares physiological parameters (a, c) Ktrans and (b, d) ve between prostate cancers (red) and normal tissue (green) for 30% (top row) and 70% (bottom row) of standard dose. On average, cancer had larger Ktrans and smaller ve than normal tissue for both doses. The difference is significant for Ktrans from the 70% of dose. For combined Ktrans and ve, ROC analysis yielded area under the curve (AUC) of 0.711 and 0.745 for 30% and 70% of the standard dose, respectively. The AUC increased significantly to 0.776 when parameters from both injections were combined (Table 2).DISCUSSION
Dotarem 30%/70% split dose protocol with quantitative analysis using the SI-Tofts model differentiated cancer from normal tissue. Due to higher dose-normalized peak magnitude of Sbr(t) for 30% of standard dose, the corresponding Ktrans was significantly smaller than the Ktrans obtained from 70% of standard dose. In future work we will test use of the dose normalized AIF from the 30% dose to analyze data from the 70% dose. The blood Sbr(t) obtained from 30% of standard dose showed clear 1st and 2nd passes. The combination of parameters obtained from both doses increased diagnostic efficacy. This may be because the 30% dose provides a more accurate AIF, while the two doses combined provides information concerning water exchange rate – an important marker for cancer [4].CONCLUSION
The split dose protocol for injection of Dotarem could increase diagnostic accuracy using quantitative analysis with the SI-Tofts model. Combination of parameters from the two doses increases diagnostic accuracy, possibly due to sensitivity to water exchange.Acknowledgements
This research is supported by National Institutes of Health (R01 CA172801, R01CA218700, 1S10OD018448-01) and Guerbet LLC.References
[1] Larsson HB, Stubgaard M, Frederiksen JL, Jensen M, Henriksen O, Paulson OB. Quantitation of blood-brain barrier defect by magnetic resonance imaging and gadolinium-DTPA in patients with multiple sclerosis and brain tumors. Magn Reson Med. 1990;16(1):117-31.
[2] Kermode AG, Tofts PS, Thompson AJ, MacManus DG, Rudge P, Kendall BE, Kingsley DP, Moseley IF, du Boulay EP, McDonald WI. Heterogeneity of blood-brain barrier changes in multiple sclerosis: an MRI study with gadolinium-DTPA enhancement. Neurology. 1990;40(2):229-35.
[3] Tofts PS, Kermode AG. Measurement of the blood-brain barrier permeability and leakage space using dynamic MR imaging. 1. Fundamental concepts. Magn Reson Med. 1991;17(2):357-67.
[4] Li X, Priest RA, Woodward WJ, Siddiqui F, Beer TM, Garzotto MG, Rooney WD, Springer CS Jr. Cell membrane water exchange effects in prostate DCE-MRI. J Magn Reson. 2012;218:77-85.
[5] Fan X, Chatterjee A, Medved M, Oto A, Karczmar GS. Signal intensity form of the Tofts model for quantitative analysis of prostate dynamic contrast enhanced MRI data. Phys Med Biol. 2020 (in press).
[6] Wang S, Lu Z, Fan X, Medved M, Jiang X, Sammet S, Yousuf A, Pineda F, Oto A, Karczmar GS. Comparison of arterial input functions measured from ultra-fast dynamic contrast enhanced MRI and dynamic contrast enhanced computed tomography in prostate cancer patients. Phys Med Biol. 2018;63(3):03NT01.
Figures