3898
Two-stage classifier for detection of high-grade prostate cancer using quantitative MRI and radiomic features1Center for Magnetic Resonance Research, Minneapolis, MN, United States, 2School of Public Health, Division of Biostatistics, University of Minnesota, Minneapolis, MN, United States
Synopsis
It is important to not only identify prostate cancer (PCa) when it is present, but also to determine the aggressiveness of PCa. In this work, we developed a novel two-stage classification model for simultaneous detection of PCa on prostate MRI and localization of aggressive, high-grade PCa, using both quantitative MRI and radiomic features. The first-stage classifier was trained to detect cancer on a voxel-wise basis, and achieved an AUC of 0.818. The second-stage classifier was trained to predict the aggressiveness of candidate regions automatically derived from the voxel-wise predictions of the first stage, and achieved an AUC of 0.779.
Introduction
Numerous works have described approaches for computer-aided detection (CAD) of prostate cancer (PCa) with mpMRI data. However, few have addressed the problem of predicting the aggressiveness of detected cancer, which is of much higher clinical significance.We developed a novel two-stage classifier for simultaneous PCa detection and assessment of cancer aggressiveness. The first-stage voxel-wise classifier uses a combination of radiomic and quantitative MRI (qMRI) features for cancer detection. After generating candidate regions from voxel-wise predictions, the second-stage region-wise classifier categorizes derived regions as either high-grade (HG-PCa) or non-high-grade (nHG-PCa). Through this approach, candidate regions are identified automatically from voxel-wise predictions, minimizing bias. The usage of both radiomic and qMRI features was also found to improve performance of both voxel-wise and region-wise classifiers, compared to using either alone.
Methods
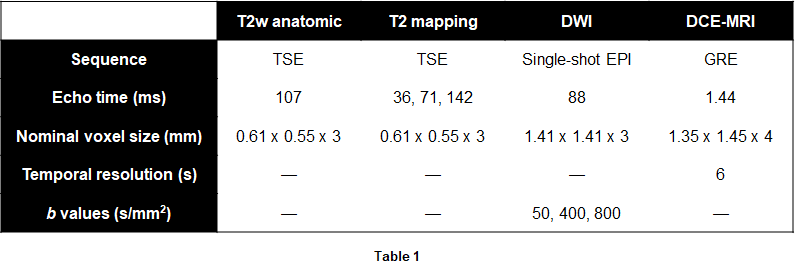
Modeling data included 34 patients with known PCa who received extended mpMRI scans at 3T and subsequently underwent radical prostatectomy. Excised prostates were sectioned, stained, digitized, then annotated for cancer by pathologists. Forty-six slices were identified and co-registered to imaging data.1Quantitative T2 maps were calculated from TSE data acquired at multiple echo times, and ADC maps were calculated from DWI data (Table 1). Pharmacokinetic maps were generated from DCE-MRI data, yielding maps of the forward volume transfer constant (Ktrans), reflux rate constant (kep), and area under the gadolinium concentration time curve at 90 seconds (AUGC90).
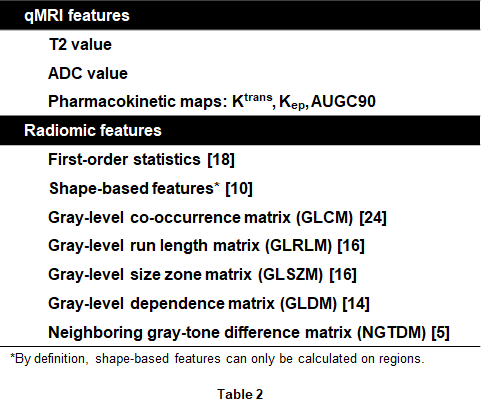
Radiomic features were calculated using the PyRadiomics package.2 Intensity correction was performed beforehand as previously described.3 Features were extracted from each axial slice on the T2W image, ADC map, and calculated high b-value (b = 1,600 s/mm2) diffusion-weighted images, and on edge-enhanced versions of each obtained by application of a Laplacian of Gaussian (LoG) filter. In total, 563 voxel-wise features (5 qMRI + 558 radiomic) and 618 region-wise features were extracted (Table 2).
Feature selection methods for the two classification stages were identical. Unpaired t-tests between feature values of cancer-labeled voxels and those of non-cancer voxels were first performed for each feature. Pearson correlation coefficients (ρ) were calculated for all pairs of features, and for each pair with |ρ| > 0.75, the feature with the larger p-value on the t-test was discarded; this process was repeated iteratively until |ρ| > 0.75 for all pairs of remaining features. Lastly, the recursive feature elimination (RFE) algorithm was applied to select a final set of features, where the number of features was determined through cross validation.
For the voxel-wise classification stage, support vector machines (SVM) classifiers were trained using leave-one-patient-out cross validation. Classifiers were trained on qMRI features alone, radiomic features alone, and both together. ROC curves were constructed, and the number of features selected by RFE and hyperparameters were chosen to maximize sensitivity at a fixed specificity of 0.90. The high specificity was chosen to minimize the appearance of small, isolated candidate regions for the second stage. The trained model was used to generate maps of predicted cancer.
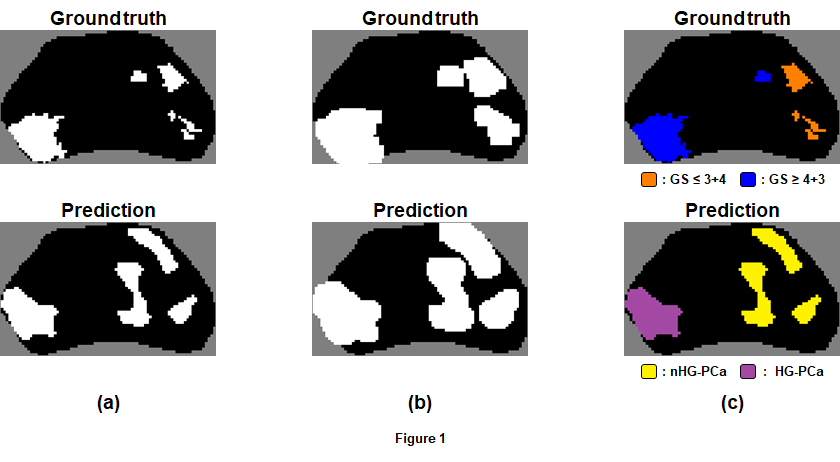
Generation of candidate regions from cancer-labeled voxels was accomplished with binary dilation of prediction maps, labeling of connected voxels, then application of masks of the original maps. Labels were assigned to each candidate region by comparing the overlap of the voxels within the region to labeled voxels of registered ground truth regions (Figure 1). A candidate region was labeled HG-PCa if the majority of overlapping voxels had Gleason score ≥ 4+3, and nHG-PCa assigned otherwise. A candidate region was considered a false-positive if there were no overlapping voxels.
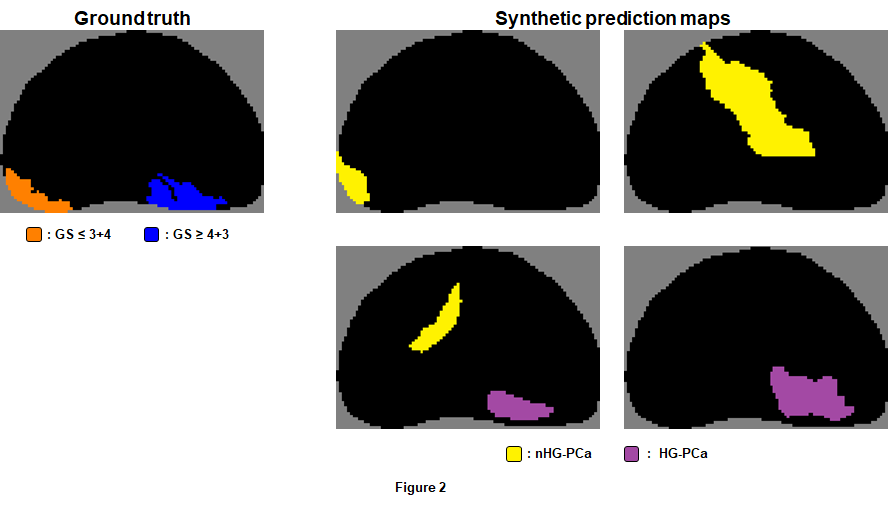
To augment the number of examples for training the region-wise classifier, 100 synthetic prediction maps were randomly generated for each ground truth map with random voxel-wise sensitivity and specificity using previously-described methods (Figure 2).4 Candidate regions in synthetic maps (6,853 in total) were identified and labeled as described above, and radiomic features were extracted from each candidate region. An SVM classifier was then trained using leave-one-patient-out cross validation.
The second-stage classifier was applied to the candidate regions derived from the predictions of the first-stage voxel-wise classifier. The composite two-stage model was then evaluated against the ground truth labels of each region, and the cross-validation performance evaluated using ROC curve analysis.
Results & Discussion
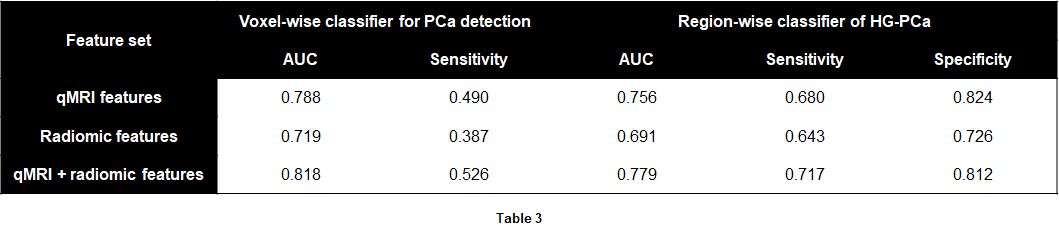
The cross-validation performance of the voxel-wise and region-wise classifiers on the three feature sets are shown in Table 3. AUC and voxel-wise sensitivity were higher with both qMRI and radiomic features, as compared to with either alone. The best second-stage region-wise classifier achieved AUC of 0.779, sensitivity of 0.717, and specificity of 0.812.These performance measures appear to be less impressive than those of previous studies.5-9 However, candidate regions in previous studies were manually identified by experts, while candidate regions in this work were automatically identified. Therefore, the model presented here is likely to be less biased and more generalizable when applied prospectively, which in turn makes it more suitable for incorporation into an automated CAD system.
Acknowledgements
This work was supported in part by the National Institutes of Health (P41-EB027061, UL1-TR002494) and the U.S. Department of Defense (W81XWH-15-1-0477).References
1. Metzger, G. J. et al. Detection of Prostate Cancer: Quantitative Multiparametric MR Imaging Models Developed Using Registered Correlative Histopathology. Radiology 279, 805-816, (2016).
2. van Griethuysen, J. J. M. et al. Computational Radiomics System to Decode the Radiographic Phenotype. Cancer research 77, e104, (2017).
3. Leng, E. et al. A framework for intensity-based affine registration of multiparametric prostate MRI via mutual information and genetic algorithms. ISMRM 26th Annual Meeting Exhibition. Paris, France. June, 2018.
4. Leng, E. et al. Development of a measure for evaluating lesion-wise performance of CAD algorithms in the context of mpMRI detection of prostate cancer. Med Phy 45(5):2076-2088, (2018).
5. Hosseinzadeh, K. & Schwarz, S. D. Endorectal diffusion-weighted imaging in prostate cancer to differentiate malignant and benign peripheral zone tissue. Journal of magnetic resonance imaging : JMRI 20, 654-661 (2004).
6. Tiwari, P., Kurhanewicz, J. & Madabhushi, A. Multi-kernel graph embedding for detection, Gleason grading of prostate cancer via MRI/MRS. Medical image analysis 17, 219-235 (2013).
7. Hoeks, C. M. et al. Diffusion-weighted magnetic resonance imaging in the prostate transition zone: histopathological validation using magnetic resonance-guided biopsy specimens. Investigative radiology 48, 693-701 (2013).
8. Vos, E. K. et al. Multiparametric Magnetic Resonance Imaging for Discriminating Low-Grade From High-Grade Prostate Cancer. Investigative radiology 50, 490-497 (2015).
9. Verma, S. et al. Assessment of aggressiveness of prostate cancer: correlation of apparent diffusion coefficient with histologic grade after radical prostatectomy. AJR. American journal of roentgenology 196, 374-381, (2011).
Figures