3897
Correlation between T2 mapping and Intravoxel Incoherent Motion in Prostate cancer and Benign prostatic hyperplasia
Nila Mu1, Ailian Liu1, Lihua Chen1, Pengyun Zhang1, Yunsong Liu1, Changjun Ma1, Jiazheng Wang2, Liangjie Lin2, Qingwei Song1, and Renwang Pu1
1The First Affiliated Hospital of Dalian Medical University, Dalian, China, Dalian, China, 2Philips Healthcare, Beijing, China, Beijing, China
1The First Affiliated Hospital of Dalian Medical University, Dalian, China, Dalian, China, 2Philips Healthcare, Beijing, China, Beijing, China
Synopsis
It is difficult to identify prostate tumors and prostate hyperplasia in clinical practice with conventional MR imaging methods. T2mapping is a non-invasive technique, which can analyze the T2 value of the organization quantitatively. In this study, we aimed to evaluate the correlation between T2 mapping and Intravoxel incoherent motion. The results show that T2 values were significantly associated with all parameters of IVIM except fast ADC mono, and have no concern with prostate cancer or benign prostatic hyperplasia.
Introduction
T2-mapping imaging is a technique for quantitative characterization of tissues by describing the attenuation of transverse magnetization (T2 value). It has been widely explored for quantitative evaluation of myocardium and articular cartilage1-3. IVIM can obtain two kinds of information, namely intra-tissue diffusion and microcirculation perfusion, and has been used for prostate research4. This study aims to evaluate the performance of T2 mapping and IVIM in differential diagnosis in patients with prostate cancer (PCa) and with benign prostatic hyperplasia (BPH), and to explore the correlation between T2 value and IVIM perfusion parameters.Materials and Methods
This study was approved by the local IRB.A total of 64 patients with prostatetumor (n=28) or hyperplasia(n=36) wereincluded in the analysis. The patients were categorized into the PCa and BPH groups according to pathology results. All patients underwent MRI scans on a 3.0T scanner (IngeniaCX, Philips Healthcare, the Netherlands) with a 16-channel abdominal coil. MR protocols included T2WI SPAIR, DWI, T2mapping and IVIM. Detailed scan parameters are listed in Table 1. T2 mapping data was transferred to the IntelliSpace Portal workstation (PhilipsHealthcare) for post processing, and the IVIM data was processed by FuncTool on GE AW4.6 workstation (GE-Signa HDXT, US). T2 mapping (T2 value) and IVIM (including standard ADC, fraction of fast ADC-mono, slow ADC bi, and fraction of fast ADC bi, et al.) parameters weremeasuredindependently by two radiologists (Changjun M and Lihua C, with 2 and 5 years of experiences respectively, blinded to the clinical information of the patients).Regions of interest(ROIs) were manually placed on the fused T2mapping and DWI images on the slice with maximum display of lesion, and the ROIs were copied to maps of IVIM parameters (Figure 1). The average T2 value and IVIM perfusion parameters were used for the following analyses. Inter-observerconsistency of T2 and IVIM parameters was tested using intra-class correlation coefficients (ICC) withSPSS (IBM). Spearman test was used to determine the correlation between T2 value and quantitative parameters of IVIM.Results
Measurement consistency between the two radiologists was good (ICC> 0.75).Comparison of T2 mapping and IVIM parameters between PCa and BPH groups wereshowed in Table 2.The T2 value and IVIM parameters (except the fast ADC mono) were observed significantly higher in the BPH and in the PCa groups (p < 0.05). No significant correlation was observed between the T2 value and IVIM parameters in the separated PCa and IVIM groups (Table 3).And the T2 value was positively correlated with all IVIM parameters except the fast ADC mono in all patients with PCa or BPH (Table 4).Discussion and Conclusion
The T2 value and IVIM parameters were observed to be significantly higher in PCa than in BPH groups, indicating the potentialof T2 mapping and IVIM for differential diagnosis between PCa and BPH. The T2 valuewas observed to be significantly associated with all IVIM parametersexcept the fast ADC mono in all patients with PCa or BPH.Acknowledgements
References
[1] Lei Shi,Kexin Wang,Jinghong Yu,Mingkai Li,Guangmei Men,Gang Ma,Xing Wang.Relationship Between Magnetic Resonance T2-Mapping and Matrix Metalloproteinase 1,3 in Knee Osteoarthritis. Indian Journal of Orthopaedics. 2020 :1-9.[2] Markousis-Mavrogenis George, Koutsogeorgopoulou Loukia, KatsifisGikas, Dimitroulas Theodoros, KolovouGenovefa, Kitas George D, Sfikakis Petros P, Mavrogeni Sophie I. The Doubled-Edged Sword of T1-Mapping in Systemic Sclerosis-A Comparison with Infectious Myocarditis Using Cardiovascular Magnetic Resonance. Diagnostics. 2020, 10(5):335.[3] Kern Maike, Auer Timo Alexander, Picht Thomas, Misch Martin, Wiener Edzard. T2 mapping of molecular subtypes of WHO grade II/III gliomas. BMC Neurology. 2020, 20(1):8.[4] Zhongwei Chen, Yingnan Xue, Zhao Zhang, Weikang Li, Min Wen, Youfan Zhao, Jiance Li, Zhiliang Weng, Qiong Ye. The performance of intravoxel-incoherent motion diffusion-weighted imaging derived hypoxia for the risk stratification of prostate cancer in peripheral zone. European journal of radiology. 2020,125:108865.Figures
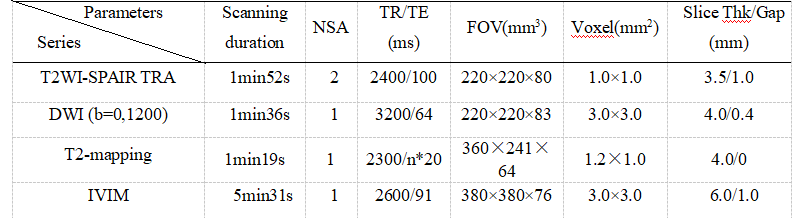
Table 1 Scan parameters
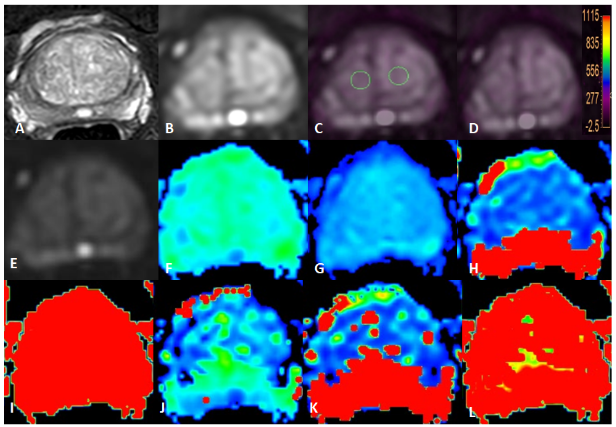
Figure 1 T2WI(A), DWI(B), fused T2 mapping and DWI (C, D) images , IVIM images as well as the derived Standard ADC, Fraction of fast ADC-mono, Slow ADC bi, and Fraction of fast ADC bi, et al maps (E-L) of a BPH patient. The placement of ROIs is as illustrated.
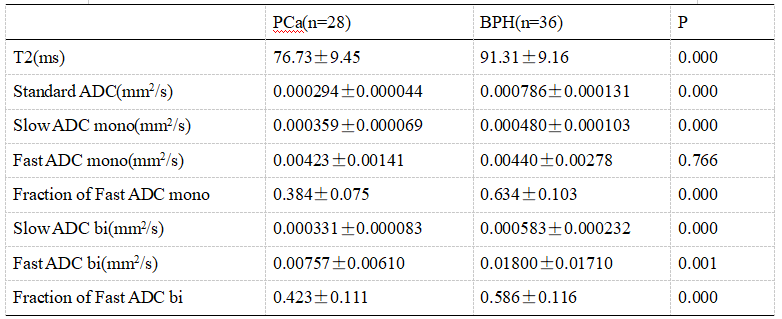
Table 2Comparisonof the all the parameters of T2-mapping and IVIM
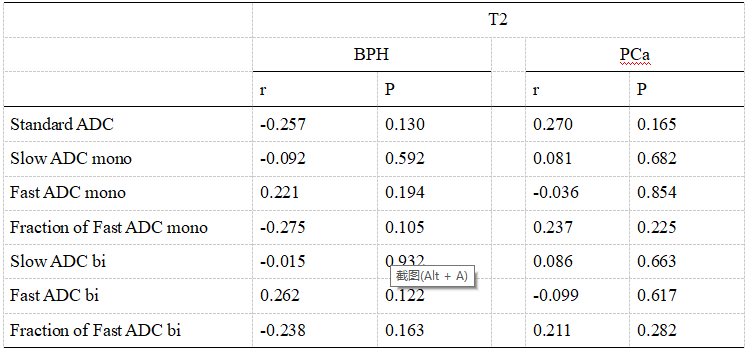
Table3 Correlations of the T2 value with the perfusion parameters of IVIM in BPH and PCa respectively
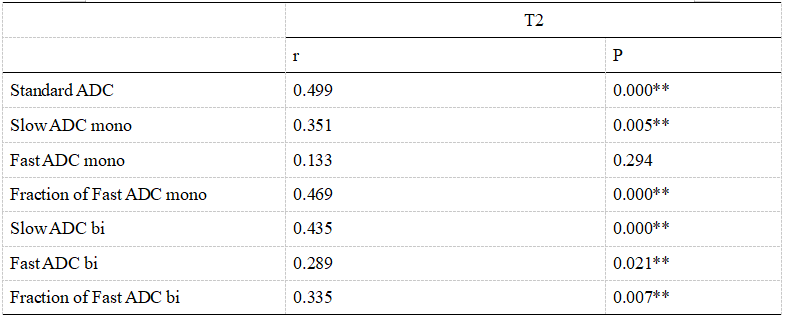
Table4CorrelationamongAPT values andthe perfusion parameters of IVIMin all patients with PCa or BPH