3896
Assessing the combined effect of bias field correction and intensity normalization of T2w images on prostate tumor probability maps1Biomedical Engineering, Polytechnique Montréal, Montréal, QC, Canada, 2Radiation Oncology, The Netherlands Cancer Institute, Amsterdam, Netherlands, 3Centre Hospitalier de l’Université de Montréal, Montréal, QC, Canada
Synopsis
Multi-parametric magnetic resonance imaging has come to play an important role in the diagnosis and treatment of prostate cancer. Despite numerous advances in the acquisition, processing, and analysis of these images, a great deal of variability still exists in the reliability of imaging-based information. In an effort to initialize a framework for standardizing the processing of prostate imaging data, we present a systematic evaluation of the effect that bias field correction and intensity normalization of T2w images have on downstream analyses. We show that this assessment allows us to achieve improved accuracy for tumor localization within the prostate.
Introduction
The incorporation of multi-parametric MRI (mpMRI) into the detection and management of prostate cancer (PCa) has increased steadily over the past two decades. The high sensitivity of mpMRI to changes in the underlying tissue microstructure has made it a valuable tool for the localization of prostate tumors. On the other hand, the specificity of mpMRI of the prostate is often confounded by the presence of benign conditions, which can lead to higher numbers of false positives in tumor identification. The capacity of mpMRI to provide reliable information for tissue characterization can be improved by standardizing its use across sites and institutions. While the incorporation of qualitative mpMRI into the characterization of PCa has been greatly improved by the introduction of the PIRADS,1 there is currently no equivalent standardization for the use of quantitative mpMRI. There is a great deal of variation in the number and type of pre-processing steps that are applied to mpMRI of the prostate prior to quantitative evaluation.2 Moreover, many of these steps have been shown to affect downstream processing and analysis.3 Previous studies have examined the effects of various methods of bias field correction and intensity normalization on T2-weighted (T2w) images of the prostate.4,5 It has been shown, however, that an appreciable interaction exists between these two pre-processing steps.6 To evaluate this interaction, an assessment of the collective impact of multiple pre-processing steps must be considered. We evaluate the combined effect of bias field correction and normalization on T2w images by considering both ad hoc and application-specific metrics. Specifically, we examine the impact of each pre-processing component on the accuracy of tumor probability maps generated from a population-based model. We show that a systematic evaluation of bias field correction and normalization leads to an improvement in the ability of mpMRI to distinguish healthy tissue from suspected PCa.Methods
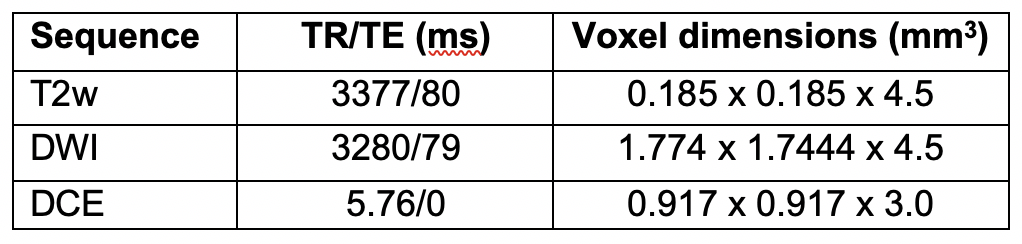
Data: This study is based on 25 patients from Centre Hospitalier de l’Université de Montréal recruited through HIPAA compliant trial. Multi-parametric imaging consisting of a T2w, diffusion-weighted imaging (DWI), and dynamic contrast-enhanced (DCE) MRI was carried out for each patient prior to radiotherapy treatment. Specific acquisition parameter settings are shown in Table 1.Pre-processing: Contours of the prostate, peripheral zone (PZ), and suspected tumors were delineated by a single radiation oncologist. With the exception of the T2w images, all other pre-processing steps were carried out as described in Dinh et al.7 Bias field correction was performed on the T2w images using two well-established, publicly available approaches: N48 and PABIC.9 Optimal parameter settings for each method were obtained by testing a range of values, the performance of which was evaluated using the percent coefficient of variation (CoV) and entropy as ad hoc metrics. The optimized bias corrected images then underwent three different normalization techniques: basic normalization, region of interest (ROI) normalization, and histogram matching. Basic normalization was defined as z-score normalization while ROI normalization was achieved by using the median value in the PZ. The method introduced by Nyú et al10 was used to implement histogram matching normalization.
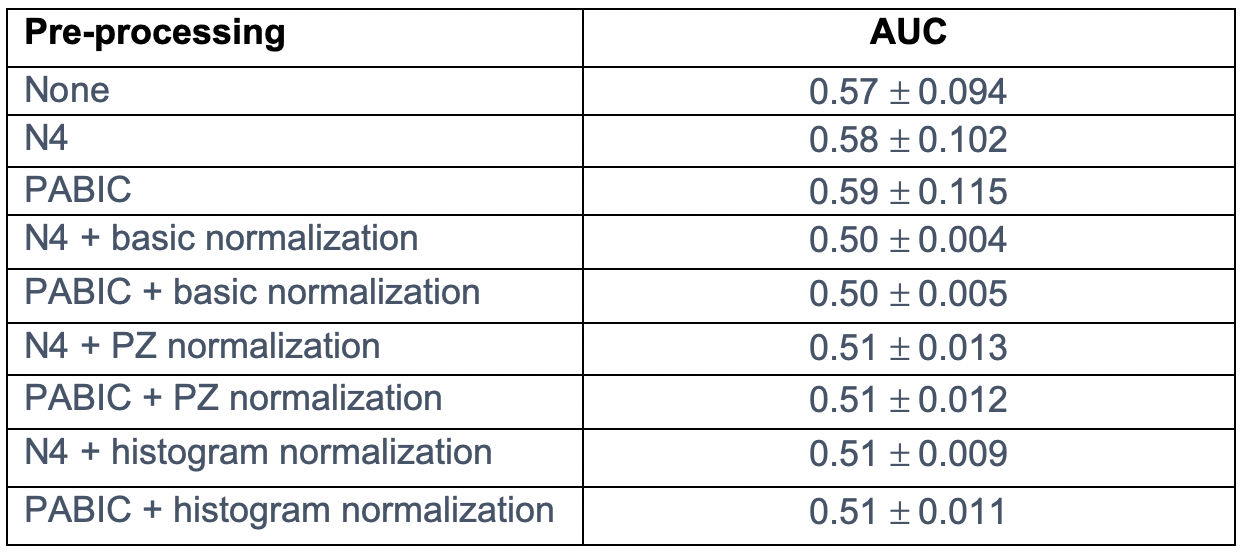
Tumor probability map generation: Tumor probability maps were generated using a tumor localization model7 which combines prior knowledge features with mpMRI features in an effort to reduce the number of false positives. The model extracts 31 features per voxel, which consist of 29 mpMRI features, 1 from a population-based tumor probability atlas,11 and 1 from the biopsy report for that patient. All feature calculation and extraction steps were carried out as outlined in Dinh et al.7 Tumor probability maps were constructed for 13 patients with available biopsy reports for all 9 pre-processing combinations of bias field correction and normalization. The resultant tumor probability maps were compared to manually contoured tumors using the area under the curve (AUC). Tumors with a volume lower than the clinically significant volume of 5mm were excluded.
Results
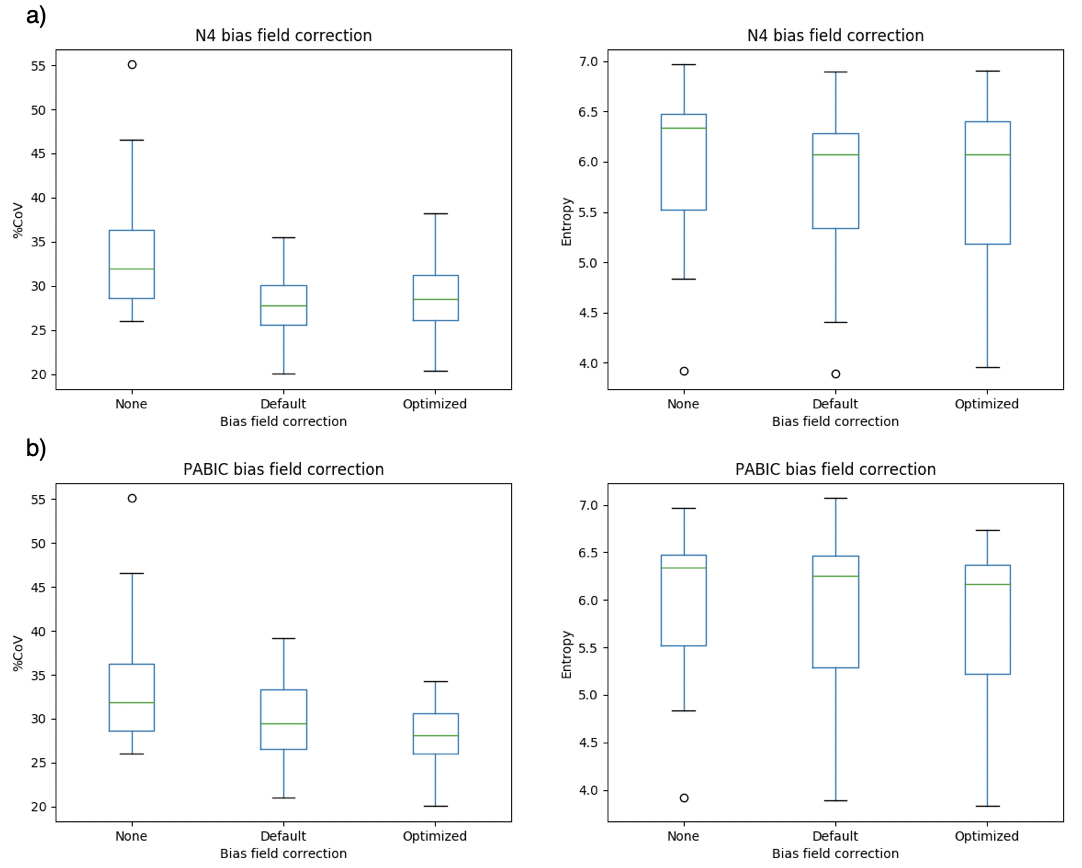
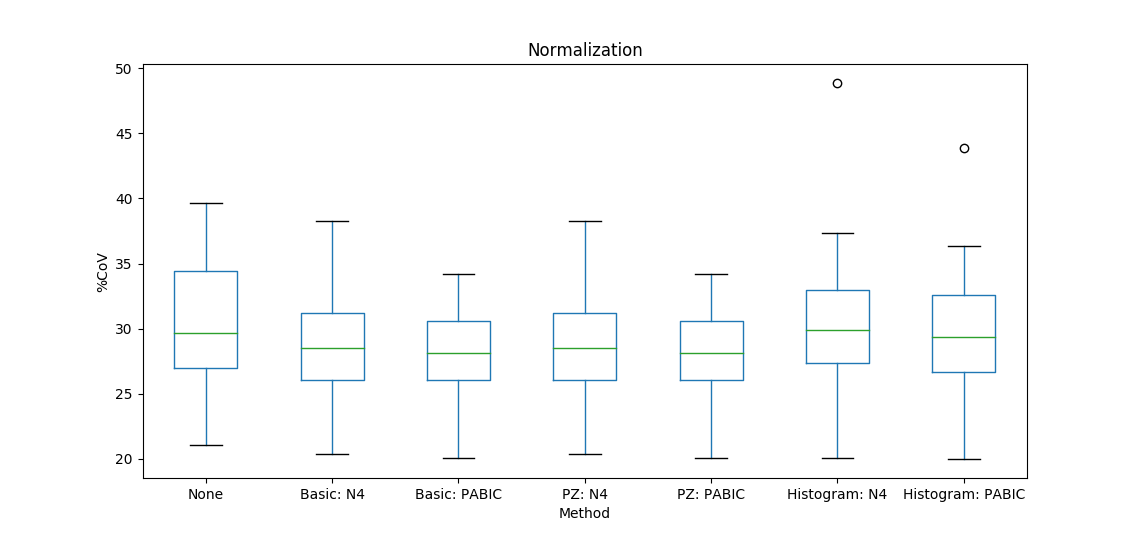
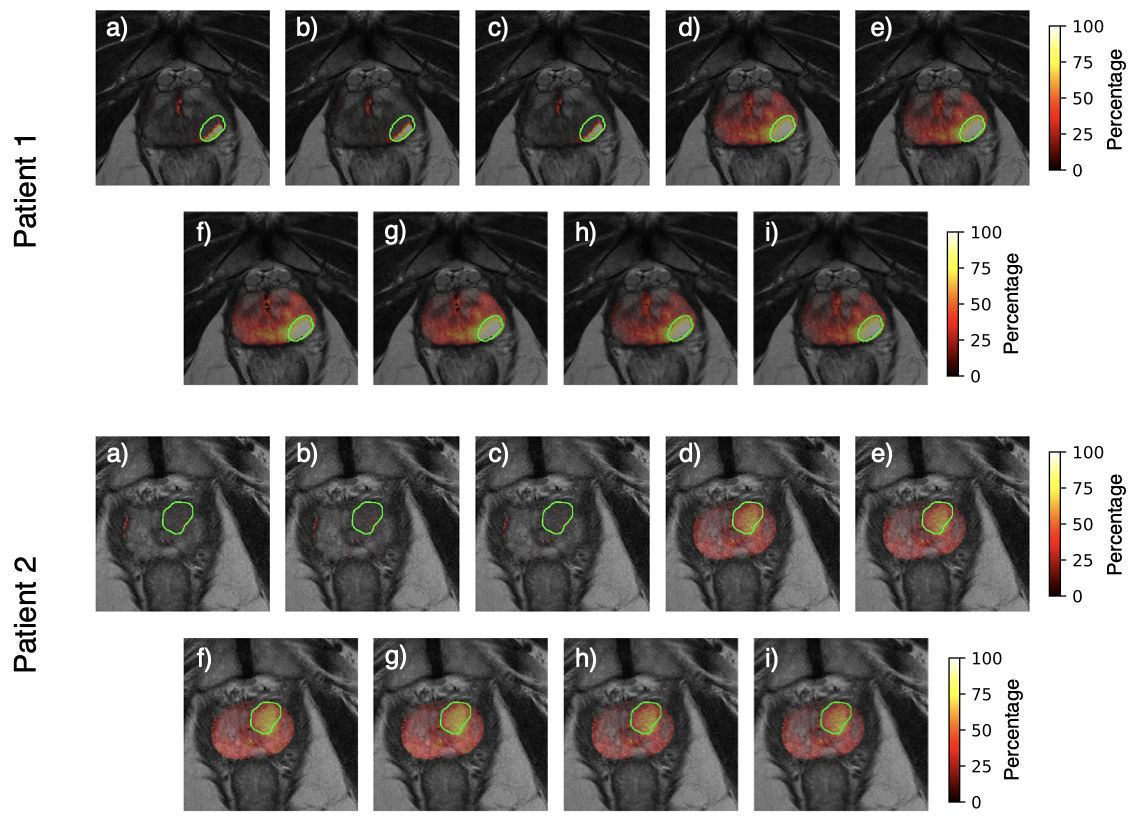
Both N4 and PABIC were shown to improve image quality when compared to unprocessed images (Fig. 1). In terms of optimized parameter estimation, N4 achieved the lowest entropy value while PABIC was found to perform best according to the percent CoV. All three normalization methods showed improvement over unprocessed images in percent CoV (Fig. 2). Normalization of PABIC-corrected images demonstrated a slight decrease in percent CoV in comparison to N4-corrected images. Basic and PZ normalization slightly outperformed histogram matching normalization. Values for the AUC indicated that bias field correction tended to improve tumor localization while normalization did not (Table 2). The application of bias field correction along with normalization did, however, exhibit the potential to improve the ability of the model to identify tumors for some patients (Fig. 3).Discussion/Conclusion
We demonstrate that bias field correction followed by normalization can improve the ability of mpMRI to characterize prostate tissue for some patients. Though we chose to focus this study on two pre-processing steps commonly used for T2w imaging, the number and type of steps included in a full mpMRI pre-processing pipeline vary with modality and type of features to be extracted. To this end, future work will include a systematic investigation of additional pre-processing steps, such as registration and segmentation of mpMRI, as well as modality-specific pre-processing for DWI and DCE MRI.Acknowledgements
We thank Edward Jackson (The Netherlands Cancer Institute) for assistance in setting up the tumor probability model.References
1. Turkbey B, Rosenkrantz AB, Haider MA, et al. Prostate Imaging Reporting and Data System Version 2.1: 2019 Update of Prostate Imaging Reporting and Data System Version 2. Eur Urol. 2019;76(3):340-351.
2. Lemaître, G, Martí, R, Freixenet, J, et al. Computer-Aided Detection and diagnosis for prostate cancer based on mono and multi-parametric MRI: A review. Computers in Biology and Medicine 2015;60(5):8-31.
3. Schwier, M, van Griethuysen, J, Vangel, MG, et al. Repeatability of Multiparametric Prostate MRI Radiomics Features. Scientific Reports 2019;9(1),1-16.
4. Viswanath, S, Palumbo, D, Chappelow, J, et al. Empirical evaluation of bias field correction algorithms for computer-aided detection of prostate cancer on T2w MRI. SPIE Medical Imaging 2011;7963(5):79630V-79630V-12.
5. Isaksson, LJ, Raimondi, S, Botta, F, et al. Effects of MRI image normalization techniques in prostate cancer radiomics. Physica Medica 2020;71(2):7-13.
6. Madabhushi, A, and Udupa, JK. Interplay between intensity standardization and inhomogeneity correction in MR image processing. IEEE Transactions on Medical Imaging 2005;24(5):561-576.
7. Dinh CV, Steenbergen P, Ghobadi G, et al. Multicenter validation of prostate tumor localization using multiparametric MRI and prior knowledge. Medical Physics 2017;44(3):949-961.
8. Tustison, NJ, Avants, BB, Cook, PA, et al. N4ITK: Improved N3 Bias Correction. IEEE Trans Med Imaging 2010;29(6):1310-1320.
9. Styner, M. Parametric estimate of intensity inhomogeneities applied to MRI. IEEE Transactions on Medical Imaging 2000;19(3):153-165.
10. Nyú, LG and Udupa, JK. On standardizing the MR image intensity scale. Magnetic Resonance in Medicine 1999;42(6):1072-1081.
11. Ou, Y, Shen, D, Zeng, J, et al. Sampling the spatial patterns of cancer: Optimized biopsy procedures for estimating prostate cancer volume and Gleason Score. Medical Image Analysis 2009;13(4):609-620.
Figures