3895
Four Quadrant mapping of Hybrid Multidimensional MRI data for the diagnosis of prostate cancer1Department of Radiology, University of Chicago, Chicago, IL, United States, 2Sanford J. Grossman Center of Excellence in Prostate Imaging and Image Guided Therapy, Chicago, IL, United States
Synopsis
This study introduces a new quantitative mapping technique referred to as Four Quadrant mapping of Hybrid Multi-dimensional MRI data and evaluates its use for diagnosis of prostate cancer. Each image voxel can be represented as a vector in a 2D plot with components ‘∆T2/∆b’ and ‘∆ADC/∆TE’. Cancers contain a significantly higher percentage of voxels in quadrant 4 (PQ4), and a lower percentage of voxels in quadrant 2 (PQ2), smaller amplitude and angle compared to benign tissue. The quadrant analysis metrics resulted in AUC of 0.893 for differentiation of cancer from benign tissue, and showed moderate correlation with Gleason score (|ρ|=0.38-0.61).
Introduction
Even though mpMRI is increasingly used for prostate cancer (PCa) diagnosis, around 15-30% of clinically significant cancers are missed even by expert radiologists (1). New quantitative approaches are being investigated. Hybrid Multidimensional MRI(HM-MRI) measures the change in ADC and T2 as a function of echo time(TE) and b-value, respectively (2,3), and these changes are used to measure tissue composition non-invasively (4). The structured HM-MRI data (matrix of signal values for different combinations of ‘b’ and ‘TE’ associated with each image voxel) can be further exploited to improve cancer diagnosis. This study introduces a new quantitative mapping technique referred to as Four Quadrant Mapping of Hybrid Multi-dimensional MRI data and investigates its application to diagnose prostate cancer and determine cancer aggressiveness.Methods
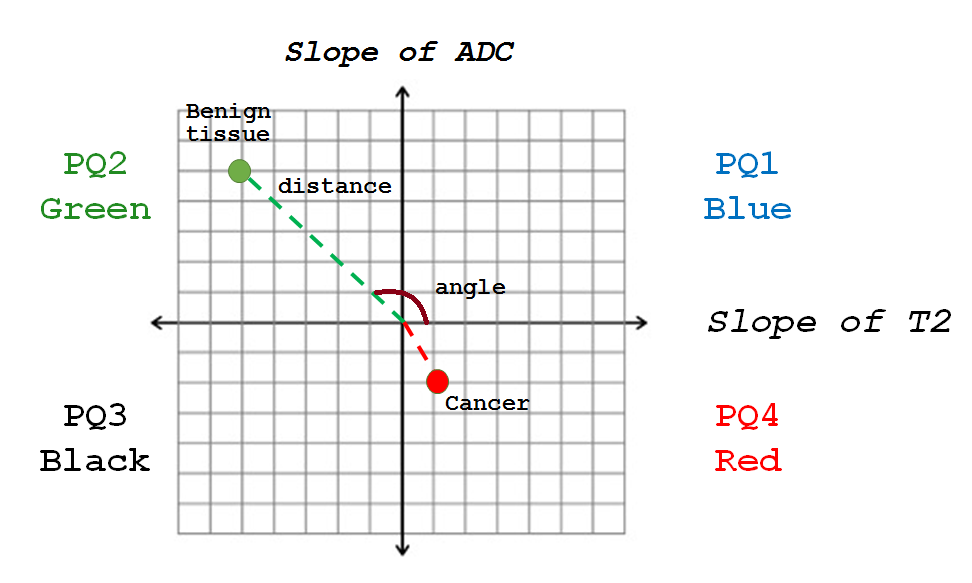
Twenty-one patients (mean age 65 years, mean PSA 6.9ng/ml) with histologically confirmed PCa underwent preoperative MRI with a 3T Philips Achieva MR system prior to radical prostatectomy. Axial images using HM-MRI were acquired with all combinations of TE=47,75,100 ms and b-values of 0,750,1500 s/mm2, resulting in a 3×3 data matrix associated with each voxel. The prostatectomy specimen was sectioned in the same plane as MR images and was H&E stained. PCa lesions were graded and outlined by an experienced pathologist. MR images were co-registered with histology and regions-of-interests were placed on sites of prostatectomy verified malignancy (n=28, 11 Gleason 6, 14 Gleason 7, 3 Gleason 4+5) and normal tissue (n=70, 20 PZ, 19 TZ, 17 CZ, 14 AFMS) from different zones by an experienced radiologist to calculate metrics for subsequent statistical analysis.ADC and T2 were calculated at each TE and b-value respectively assuming mono-exponential signal decay on a voxel-by-voxel basis. Prostate Quadrant (PQ) mapping analysis represents HM-MRI data for each voxel as a color-coded vector in the 4-quadrant space with associated amplitude and angle information representing the change in T2 and ADC as a function of b-value and TE, respectively (Figure 1). Each quadrant is assigned a color – quadrant 1 or PQ1 (blue; 0-90⁰; ∆T2/∆b>0, ∆ADC/∆TE>0), quadrant 2 or PQ2 (green; 90-180⁰; ∆T2/∆b<0, ∆ADC/∆TE>0), quadrant 3 or PQ3 (black; 180-270⁰; ∆T2/∆b<0, ∆ADC/∆TE<0) and quadrant 4 (red; 270-360⁰; ∆T2/∆b>0, ∆ADC/∆TE<0). Using these assignments, maps of the prostate can be constructed showing the color assigned to each voxel. The amplitudes (distance from the origin where ∆T2/∆b and ∆ADC/∆TE=0) and angles of the vectors associated with each voxel are also used as cancer markers. PQ1, PQ2, PQ3, and PQ4 are the percentages of voxels from a given ROI in each of the quadrants.
The difference between means was assessed by a one-way ANOVA with post hoc Tukey’s HSD test. Spearman correlation was performed between Gleason score and measured parameters. ROC analysis was used to evaluate the performance in differentiating cancer from normal prostatic tissue.
Results
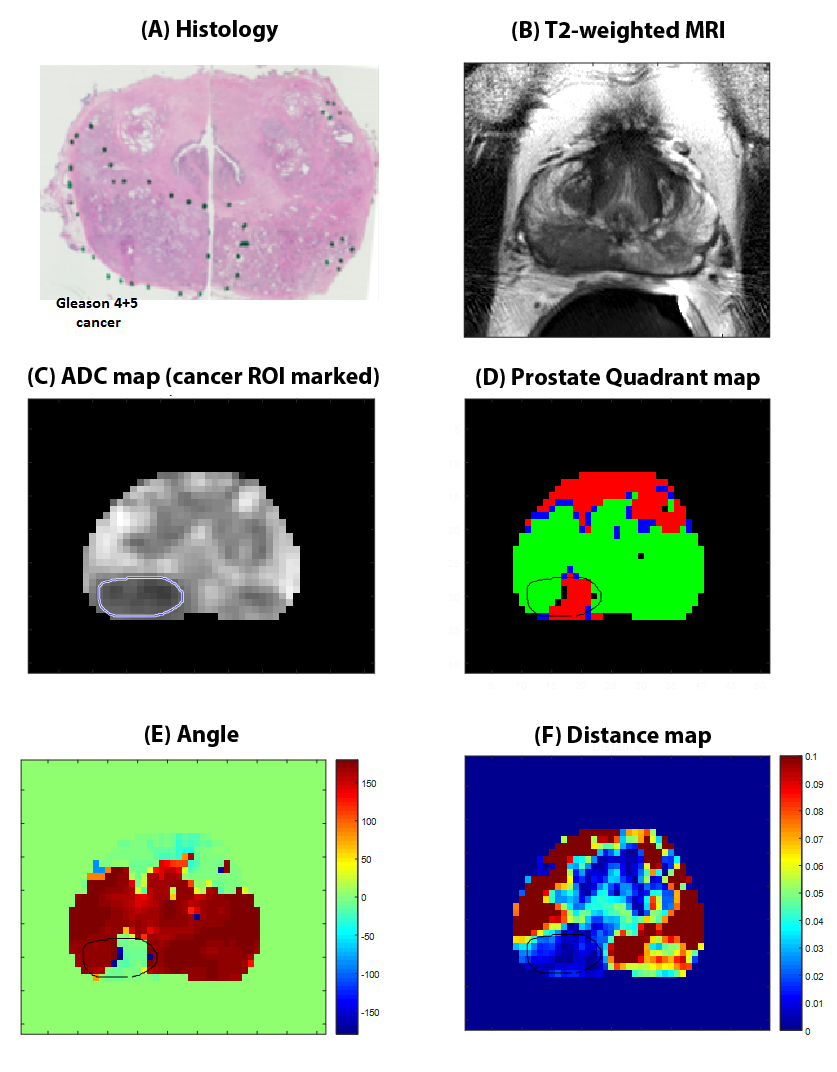
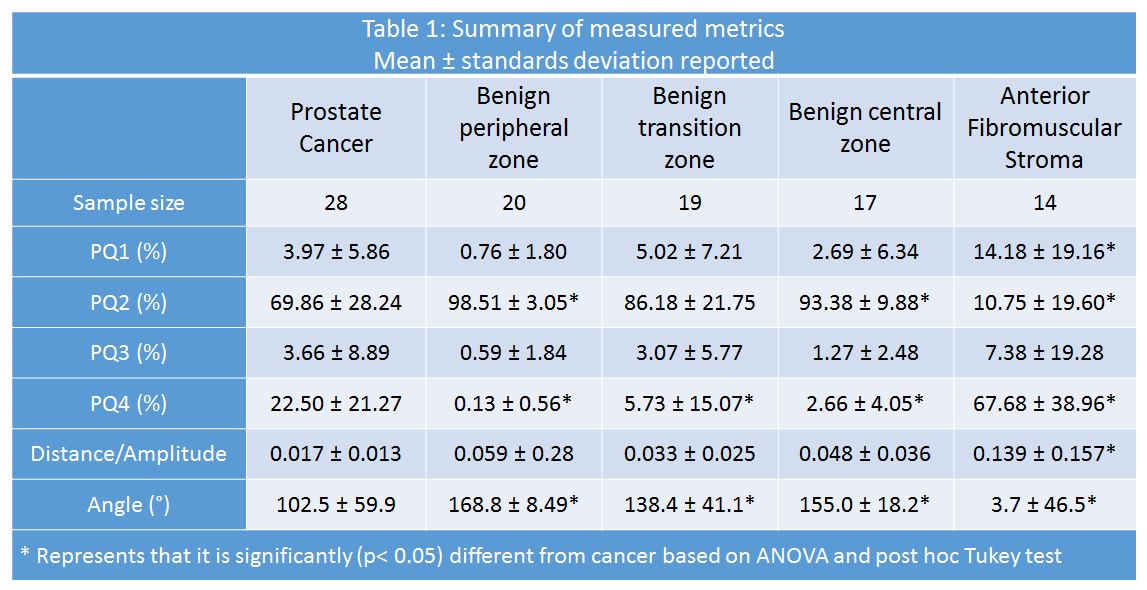
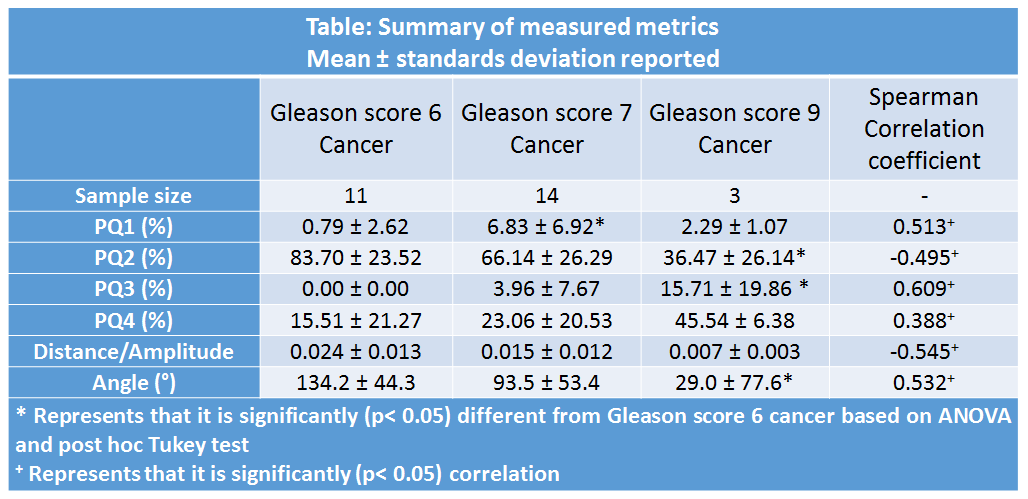
Table 1 summarizes the measured metrics using the four quadrant mapping schema. Cancers have a higher PQ4 (22.50±21.27%) and lower PQ2 (69.86±28.24%) voxels compared to benign tissue: peripheral, transition and central zone tissue (PQ4=0.13±0.56, 5.73±15.07, 2.66±4.05% and PQ2=98.51±3.05, 86.18±21.75, 93.38±9.88% respectively). Therefore, cancers appear as red on the four-quadrant map due to the higher PQ4, while benign tissue appears green due to higher PQ2. The AFMS had higher PQ4 (67.68±38.96%) and lower PQ2 (10.75±19.60%) than cancer. Vectors representing the AFMS has significantly lower amplitude (0.139±0.157) distance (arbitrary units) compared to cancer (0.017±0.013). Figure 2 shows a representative example of PCa diagnosis using Four Quadrant mapping of HM-MRI data with cancer associated with higher PQ4, lower angle (except AFMS) and smaller amplitude.Four quadrant metrics showed moderate correlation with Gleason score (|ρ|=0.38-0.61) with more aggressive cancers being associated with increased PQ4 and reduced PQ2, amplitude and angle (Table 2).
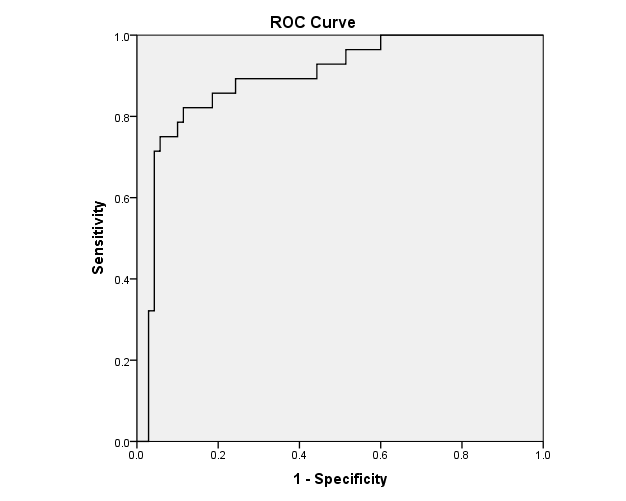
Figure 3 shows the receiver operating characteristics (ROC) curve; a combination of four quadrant analysis metrics showed an area under the curve (AUC) of 0.893 (standard error 0.037, 95% confidence interval [0.822,0.965], p<0.05) for the differentiation of prostate cancer from benign prostatic tissue.
Discussion
The results show that PCa diagnosis is feasible using Four Quadrant mapping of HM-MRI data. Four quadrant parameters provide good differentiation between PCa and benign prostatic tissue, evidenced by high AUC value and moderate correlation with Gleason score. This diagnostic performance is better than visual assessment of mpMRI by radiologists (metadata study shows AUC~0.78-0.82).The difference in microstructure between cancer and benign tissue can explain these results (2,5). The prevalence of cancer voxels in quadrant 4 (high PQ4) may be due to rapidly proliferating mitotic cells (6). These cells have greatly enlarged nuclei with very long T2 and highly restricted diffusion, yielding a positive slope of ‘T2’ as a function of ‘b’. As a result, cancers have a distinctive PQ4 signal. In contrast, the higher luminal volume and lower cell density in benign tissue results in negative ∆T2/∆b and positive ∆ADC/∆TE; there is increased signal suppression at higher b-value and TE, resulting in a high PQ2.
Conclusion
Four Quadrant mapping of HM-MRI data provides effective cancer markers, with cancers associated with high PQ4, lower PQ2, and lower angle and amplitude of vectors representing cancer voxels. Four quadrant mapping could be combined with the compartmental analysis of HM-MRI data (4) to increase diagnostic accuracy.Acknowledgements
This study was supported by NIH (R01 CA172801, 1S10OD018448-01), Sanford J. Grossman Charitable Trust and University of Chicago Medicine Comprehensive Cancer Center.References
1. Fütterer JJ, Briganti A, De Visschere P, Emberton M, Giannarini G, Kirkham A, Taneja SS, Thoeny H, Villeirs G, Villers A. Can Clinically Significant Prostate Cancer Be Detected with Multiparametric Magnetic Resonance Imaging? A Systematic Review of the Literature. European Urology 2015;68(6):1045-1053.
2. Sadinski M, Karczmar G, Peng Y, Wang S, Jiang Y, Medved M, Yousuf A, Antic T, Oto A. Pilot Study of the Use of Hybrid Multidimensional T2-Weighted Imaging–DWI for the Diagnosis of Prostate Cancer and Evaluation of Gleason Score. American Journal of Roentgenology 2016;207(3):592-598.
3. Wang S, Peng Y, Medved M, Yousuf AN, Ivancevic MK, Karademir I, Jiang Y, Antic T, Sammet S, Oto A, Karczmar GS. Hybrid multidimensional T2 and diffusion‐weighted MRI for prostate cancer detection. Journal of Magnetic Resonance Imaging 2014;39(4):781-788.
4. Chatterjee A, Bourne R, Wang S, Devaraj A, Gallan AJ, Antic T, Karczmar GS, Oto A. Diagnosis of Prostate Cancer with Noninvasive Estimation of Prostate Tissue Composition by Using Hybrid Multidimensional MR Imaging: A Feasibility Study. Radiology 2018;287(3):864-872.
5. Chatterjee A, Watson G, Myint E, Sved P, McEntee M, Bourne R. Changes in Epithelium, Stroma, and Lumen Space Correlate More Strongly with Gleason Pattern and Are Stronger Predictors of Prostate ADC Changes than Cellularity Metrics. Radiology 2015;277(3):751-762.
6. Fischer EG. Nuclear Morphology and the Biology of Cancer Cells. Acta Cytologica 2020;64(6):511-519.
Figures