3894
Improved the performance of differential diagnosis between Prostate Cancer and Benign Prostate Hyperplasia using APT and mDIXON-Quant1The First Affiliated Hospital of Dalian Medical University, Dalian, China, 2Philips Healthcare, Beijing, China, 3First Affiliated Hospital of Dalian Medical University, Dalian, China
Synopsis
Accurate identifying prostate cancer (PC) from benign prostatic hyperplasia (BPH) is of great significance for timely and proper treatment. Amide proton transfer (APT) is a novel MRI method sensitive to several kinds of cancers. mDIXON-Quant is a powerful quantitive technique for simultaneous fat quantification and R2* mapping, which can reflect the tissue contents and properties. This study aims to assess the diagnostic performance of APT and mDIXON-Quant on differentiating prostate cancers and benign prostate hyperplasia. Results indicate that the combination of APT and mDIXON-Quant can enhance the differential diagnosis of PC and BPH.
Introduction
Benign prostatic hyperplasia, a noncancerous enlargement of the prostate gland, is the most common benign tumor found in men. Accurate identifying prostate cancer (PC) from benign prostatic hyperplasia (BPH) is of great significance for timely and proper treatment. Amide proton transfer (APT) is a novel MRI technique based on the chemical exchange between amide proton and water proton. The signal intensity of APT imaging reflects the concentrations of proteins and polypeptides in tissues and the changes of pH in the microenvironment of tissues[1], which is actively studied in several cancers. mDIXON-Quant offers accurate and efficient measurements of tissue fat fraction and R2* mapping in a single sequence[2]. The values of R2* is sensitive to tissue contents and properties. This study aims to investigate the differential diagnosis performance of APT and mDIXON-Quant for PC and BPH.Materials and Methods
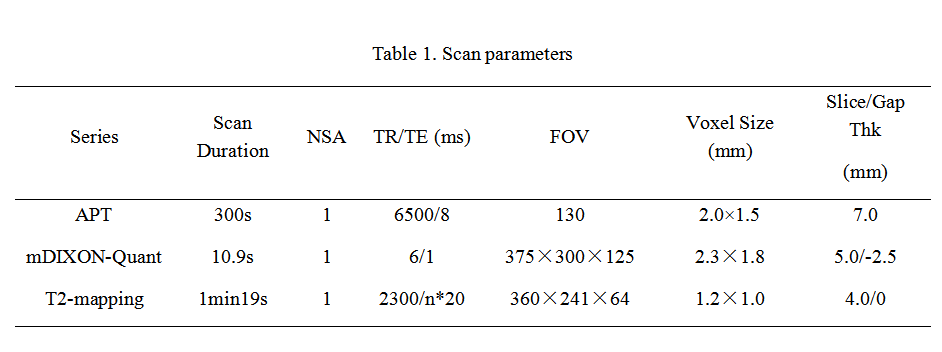
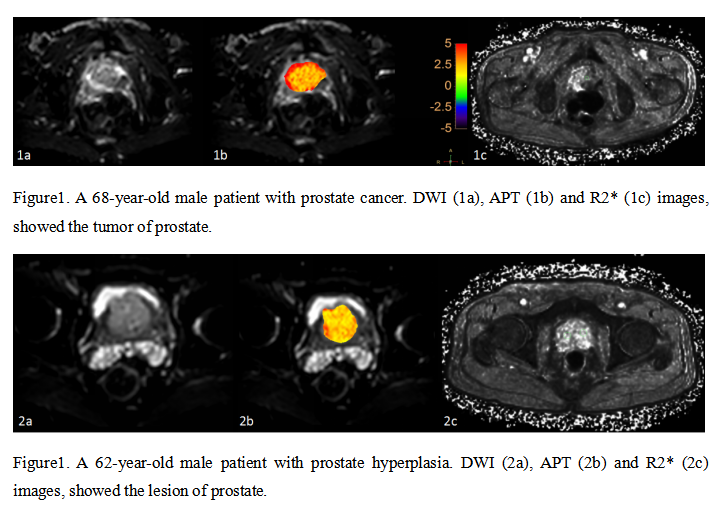
This study was approved by the local IRB. A total of 69 patients were included in the analysis. The patients were categorized into two groups: Group A, PC (mean age 71.03±7.86 years), and Group B, BPH (mean age 67.69±9.40 years) according to pathology. All the patients underwent MRI examination on a 3.0T system with a 16-channel abdominal coil (Ingenia CX Philips Healthcare, the Netherlands). The MR protocols included DWI, mDIXON-Quant, and APT, the parameters of which were listed in Table 1. All data were processed on the ISP workstation (IntelliSpace Portal, Philips Healthcare). The MR images were interpreted independently by two radiologists (Yue W and Lihua C, with 2 and 5 years of experience respectively, blinded to the clinical information of the patients). Regions of interest (ROIs) were manually placed on the hyperintense signal area of DWI images with the largest lesions. Then APTw and mDIXON-Quant images were fused with the DWI images to calculated the values of MTRasym and R2* (Figure 1). Interobserver consistency of measurement was tested using intra-class correlation coefficients (ICC). The difference of MTRasym and R2* values between PC and BPH groups were evaluated by using the paired t-test. Logistic regression and ROC plots were performed to evaluate the diagnostic efficiency of APT and mDIXON-Quant. Delong test was used to compare the diagnostic efficacy. All statistical analyses were carried out on SPSS (IBM).Result
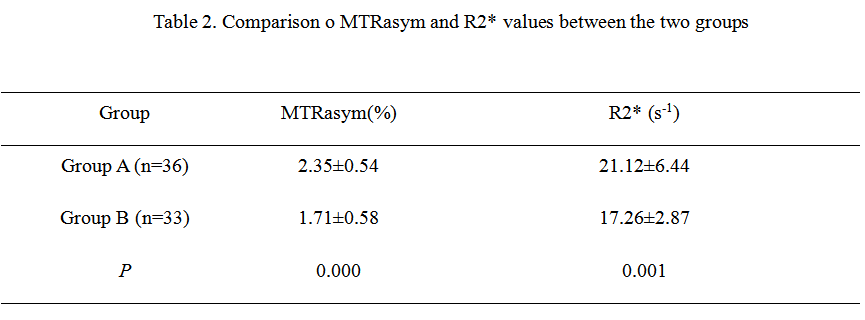
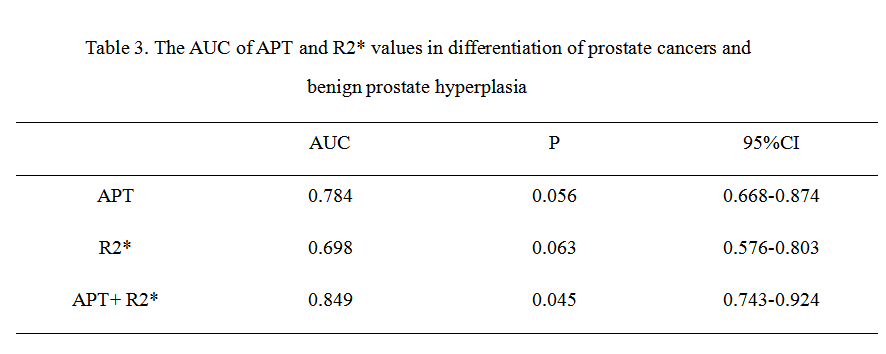
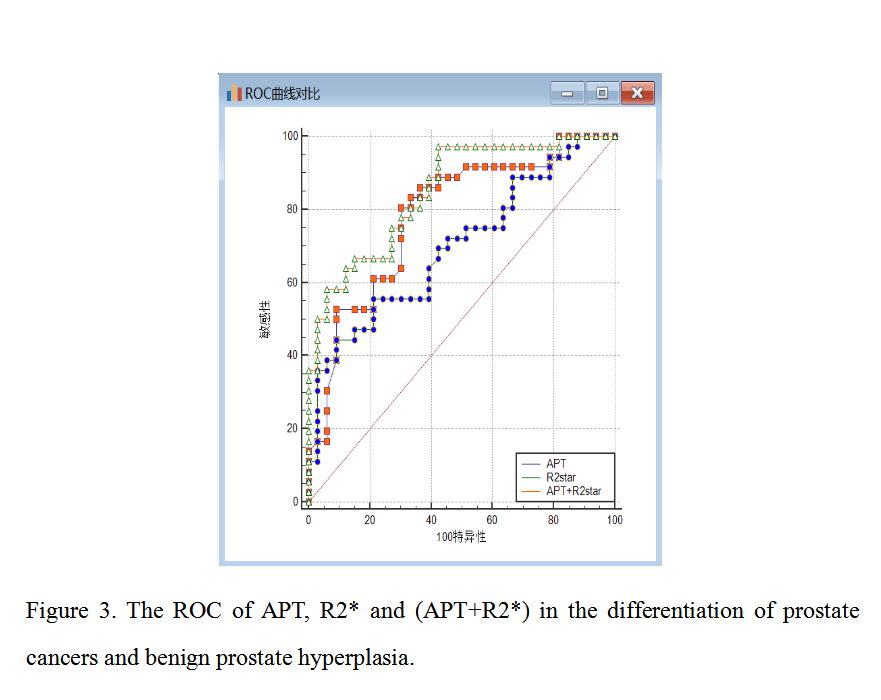
Measurements by the two observers were in good agreement (ICC > 0.75, data not shown). MTRasym and R2* values in Group A (2.35±0.54%, 21.12±6.44 s-1) were significantly higher than those in group B (P<0.05) (Table 2). The ROC curves were presented in Figure 2, and the AUC values of APT and R2* values were 0.784, 0.698. When joint use of APT and R2*, the AUC was increased to 0.849. The diagnostic efficiency of the combination of APT and R2* was higher than those of independent use T2 or R2*(p < 0.05, Table 3, Figure 2).Discussion and Conclusion
Compared with the situation in BPH, the cancer tumor cell proliferation rate and cell density are higher in PC, which leads to higher protein concentrations. Therefore, the values of MTRasym in PC are higher than those in BPH[3]. In PC, hypoxic-ischemic and fibrosis cancers usually happen. This might explain why a higher R2* values in PC than in BPH. Our results suggest that a combination of APT and mDIXON-Quant enhances the differential diagnostic efficiency on PC and BPH. In conclusion, APT together with mDIXON-Quant might provide a non-invasive high efficient method to distinguish prostate cancers and benign prostate hyperplasia.Acknowledgements
None.References
[1]Chen M, Chen C, Shen Z, Zhang X, Chen Y, Lin F, Ma X, Zhuang C, Mao Y, Gan H, Chen P, Zong X, Wu R. Extracellular pH is a biomarker enabling detection of breast cancer and liver cancer using CEST MRI. Oncotarget. 2017 Jul 11;8(28):45759-45767.
[2]Ai Z, Han Q, Huang Z, Wu J, Xiang Z. The value of multiparametric histogram features based on intravoxel incoherent motion diffusion-weighted imaging (IVIM-DWI) for the differential diagnosis of liver lesions. Ann Transl Med. 2020 Sep;8(18):1128.
[3]Jia G, Abaza R, Williams JD, Zynger DL, Zhou J, Shah ZK, Patel M, Sammet S, Wei L, Bahnson RR, Knopp MV. Amide proton transfer MR imaging of prostate cancer: a preliminary study. J Magn Reson Imaging. 2011 Mar;33(3):647-54.
Figures