3891
Investigation of synthetic MRI applied in the evaluation of tumor grade of bladder cancer1Department of Radiology, The First Affiliated Hospital of Sun Yat-sen University, Guangzhou, China, 2MR Research, GE Healthcare, Beijing, China
Synopsis
The prospective study aims to investigate the value of Synthetic MRI in evaluating the grading of bladder cancer (BCa). A total of 31 patients with pathologically confirmed BCa were enrolled. Regions of interest were manually drawn by two radiologists. Our results indicated that there were significant differences in the mean T2 and PD values between high- and low-grade BCa. The area under the ROC curve of the mean T2 and PD values were 0.761 and 0.880, respectively. Synthetic MRI is helpful for discriminating low- and high-grade BCa.
Introduction
Histological grade of bladder cancer (BCa) is an important factor associated with both the treatment and prognosis of patients1, 2. An accurate non-invasive evaluation of preoperative histological grade of BCa still remains a challenge. Synthetic MRI (SyMRI) is a novel quantitative MRI approach that could offer quantitative relaxation maps, which has been widely used in the diagnosis of neural disease, tumor, musculoskeletal disease and so on3-7. However, to the best of our knowledge, the potential role of SyMRI for evaluating the grading of BCa has not yet been reported. Therefore, the purpose of our study is to investigate the diagnostic performance of SyMRI in the evaluation of histological grade of BCa.Methods
In this prospective study, 31 patients with pathologically confirmed BCa were enrolled, including 21 high-grade BCa and 8 low-grade BCa. All of the participants underwent preoperative MRI examinations consisting of both conventional MR sequences and SyMRI on a 3.0T whole body scanner (Signa Pioneer, GE, Milwaukee, WI, USA). Figure 1 show the MR images of two patients with low- and high-grade BCa, respectively. Regions of interest were manually drawn by two radiologists on parametric maps for the T1, T2, and proton density (PD) values of BCa. The differences of the mean T1, T2, and PD values between low- and high-grade BCa were compared using the independent sample t test or Mann Whitney U test. Receiver operating characteristic (ROC) curve analysis was used to evaluate the diagnostic performance of these quantitative parameters.Results
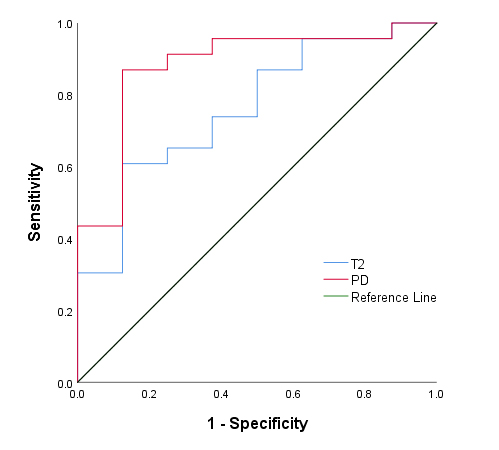
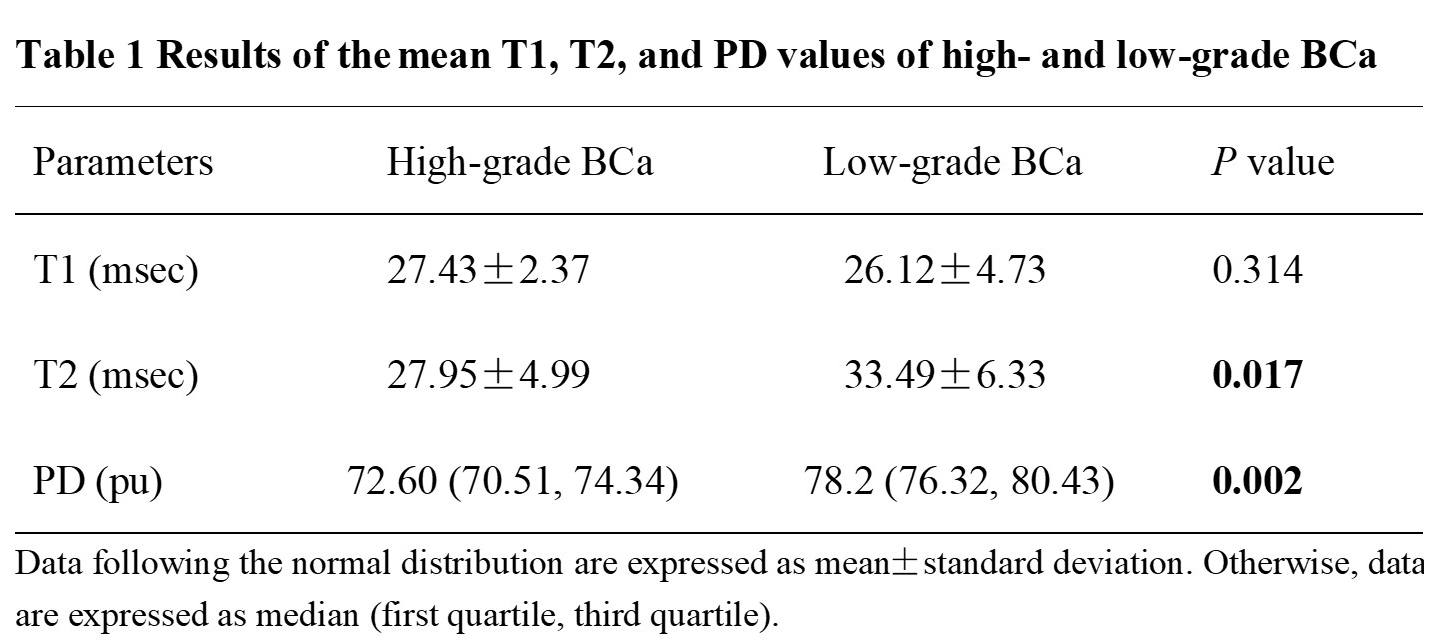
The interclass correlation coefficients between the two radiologists of the T1, T2 and PD values were 0.994, 0.991 and 0.993, respectively. There were significant differences in the mean T2 and PD values between high- and low-grade BCa (p = 0.017 and 0.002, respectively); however, no difference in the mean T1 value between the high- and low-grade BCa (p = 0.314) was found. The quantitative parameters of high- and low-grade BCa were summarized in Table 1. The best diagnostic performance was found in the mean PD value, with an area under the ROC curve (AUC) of 0.880, and the AUC of the mean T2 value was 0.761. The ROC cure analysis results in discriminating the grading of BCa were shown in Figure 2.Discussion
The T1, T2, PD maps are fundamental signal formation parameters in MRI 8, 9. Currently, the T1 relaxation time is regarded as a biomarker reflecting the amount of free water content10, tissue fat content11 and concentration of macromolecules12. The T2 and PD values, which are another magnetic property of tissue that primarily reflects the free water content in tissue13, 14. In our study, the decreased T2 and PD values in high-grade BCa might associated with hypercellularity, which reduce the extracellular space and thus decrease the tissue free water. However, no significant difference in the T1 value of high- and low-grade BCa was found, which might be related to the small number of samples in this study.Conclusion
Synthetic MRI derived T2 and PD mapping were helpful for discriminating low- and high-grade BCa.Acknowledgements
NoneReferences
1. Lokeshwar SD, Ruiz-Cordero R, Hupe MC, et al. Impact of 2004 ISUP/WHO classification on bladder cancer grading. World J Urol 2015;33(12):1929-1936.
2. Pan CC, Chang YH, Chen KK, et al. Prognostic significance of the 2004 WHO/ISUP classification for prediction of recurrence, progression, and cancer-specific mortality of non-muscle-invasive urothelial tumors of the urinary bladder: a clinicopathologic study of 1,515 cases. Am J Clin Pathol2010;133(5):788-795.
3. Hagiwara A, Warntjes M, Hori M, et al. SyMRI of the Brain: Rapid Quantification of Relaxation Rates and Proton Density, With Synthetic MRI, Automatic Brain Segmentation, and Myelin Measurement. Invest Radiol 2017;52(10):647-657.
4. Cui Y, Han S, Liu M, et al. Diagnosis and Grading of Prostate Cancer by Relaxation Maps From Synthetic MRI. J Magn Reson Imaging 2020;52:552-564.
5. Choi BH, Baek HJ, Ha JY, et al. Feasibility Study of Synthetic Diffusion-Weighted MRI in Patients with Breast Cancer in Comparison with Conventional Diffusion-Weighted MRI. Korean J Radiol 2020;21(9):1036-1044.
6. Gao W, Zhang S, Guo J, et al. Investigation of Synthetic Relaxometry and Diffusion Measures in the Differentiation of Benign and Malignant Breast Lesions as Compared to BI-RADS. Journal of magnetic resonance imaging : JMRI 2020.
7. Boudabbous S, Neroladaki A, Bagetakos I, et al. Feasibility of synthetic MRI in knee imaging in routine practice. Acta Radiologica Open 2018;7(5):205846011876968.
8. Kang KM, Choi SH, Hwang M, et al. Application of Synthetic MRI for Direct Measurement of Magnetic Resonance Relaxation Time and Tumor Volume at Multiple Time Points after Contrast Administration: Preliminary Results in Patients with Brain Metastasis. Korean J Radiol 2018;19(4):783-791.
9. Gonçalves FG, Serai SD, Zuccoli G. Synthetic Brain MRI: Review of Current Concepts and Future Directions. Top Magn Reson Imaging 2018;27(6):387-393.
10. Gelman N, Ewing JR, Gorell JM, et al. Interregional variation of longitudinal relaxation rates in human brain at 3.0 T: relation to estimated iron and water contents. Magn Reson Med 2001;45(1):71-79.
11. Garnov N, Linder N, Schaudinn A, et al. Comparison of T1 relaxation times in adipose tissue of severely obese patients and healthy lean subjects measured by 1.5 T MRI. NMR Biomed 2014;27(9):1123-1128.
12. Rooney WD, Johnson G, Li X, et al. Magnetic field and tissue dependencies of human brain longitudinal 1H2O relaxation in vivo. Magn Reson Med 2007;57(2):308-318.
13. Mezer A, Rokem A, Berman S, et al. Evaluating quantitative proton-density-mapping methods. Hum Brain Mapp 2016;37(10):3623-3635.
14. Lee SH, Lee YH, Song HT, et al. Quantitative T(2) Mapping of Knee Cartilage: Comparison between the Synthetic MR Imaging and the CPMG Sequence. Magn Reson Med Sci 2018;17(4):344-349.
Figures
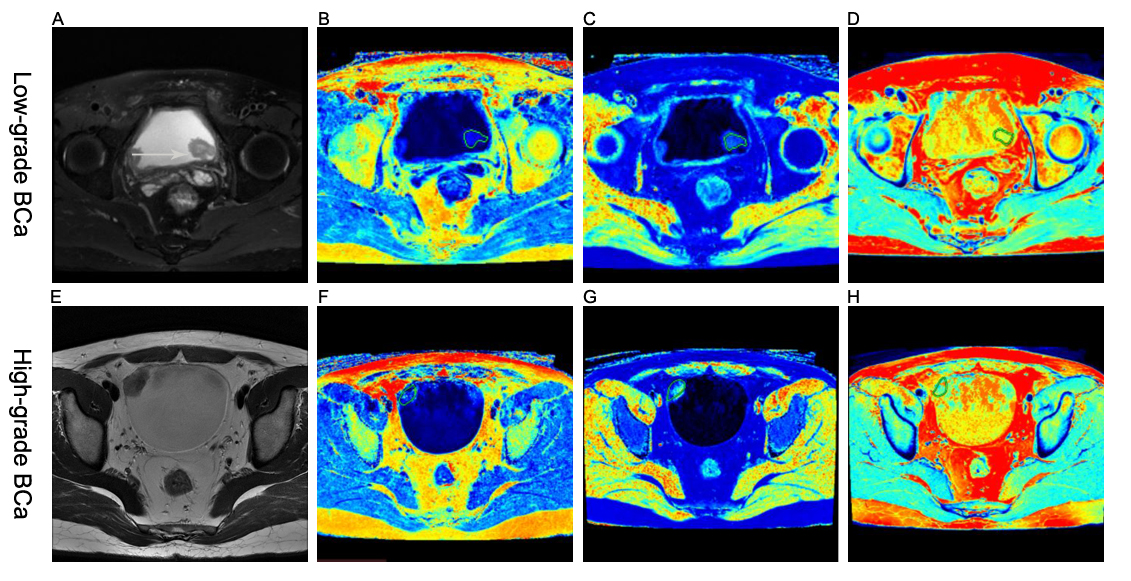
Figure 1 (A-D) A 58-year-old woman with low-grade BCa. (A) Axial T2-weighted image, (B-D) SyMRI-derived pseudo-colored maps (T1, T2, and PD, respectively) indicate that the mean T1, T2, and PD value are 27.27 msec, 26.18 msec, and 71.67 pu, respectively.
(E-H) A 31-year-old man with high-grade BCa. (E) Axial T2-weighted image, (F-H) SyMRI-derived pseudo-colored maps (T1, T2, and PD, respectively) indicate that the mean T1, T2, and PD value are 32.59 msec, 19.41 msec, and 71.52 pu, respectively.