3890
Combining Volumetric ADC Histogram Analysis with Vesical Imaging Reporting and Data System to Predict the Muscle Invasion of Bladder Cancer1Department of Radiology, Tongji Hospital, Tongji Medical College, Huazhong University of Science and Technology, Wuhan, China
Synopsis
This study explored the clinical value of volumetric apparent diffusion coefficient (ADC) histogram analysis and Vesical Imaging Reporting and Data System (VI-RADS) in differentiating muscle-invasive bladder cancer (MIBC) from non-muscle-invasive bladder cancer (NMIBC), and demonstrated that both are helpful and the volumetric ADC histogram can provide additional value to VI-RADS.
Aim
The objective of this study was to explore whether volumetric apparent diffusion coefficient (ADC) histogram analysis can provide additional value to Vesical Imaging Reporting and Data System (VI-RADS) in differentiating muscle-invasive bladder cancer (MIBC) from non-muscle-invasive bladder cancer (NMIBC).Materials and Methods
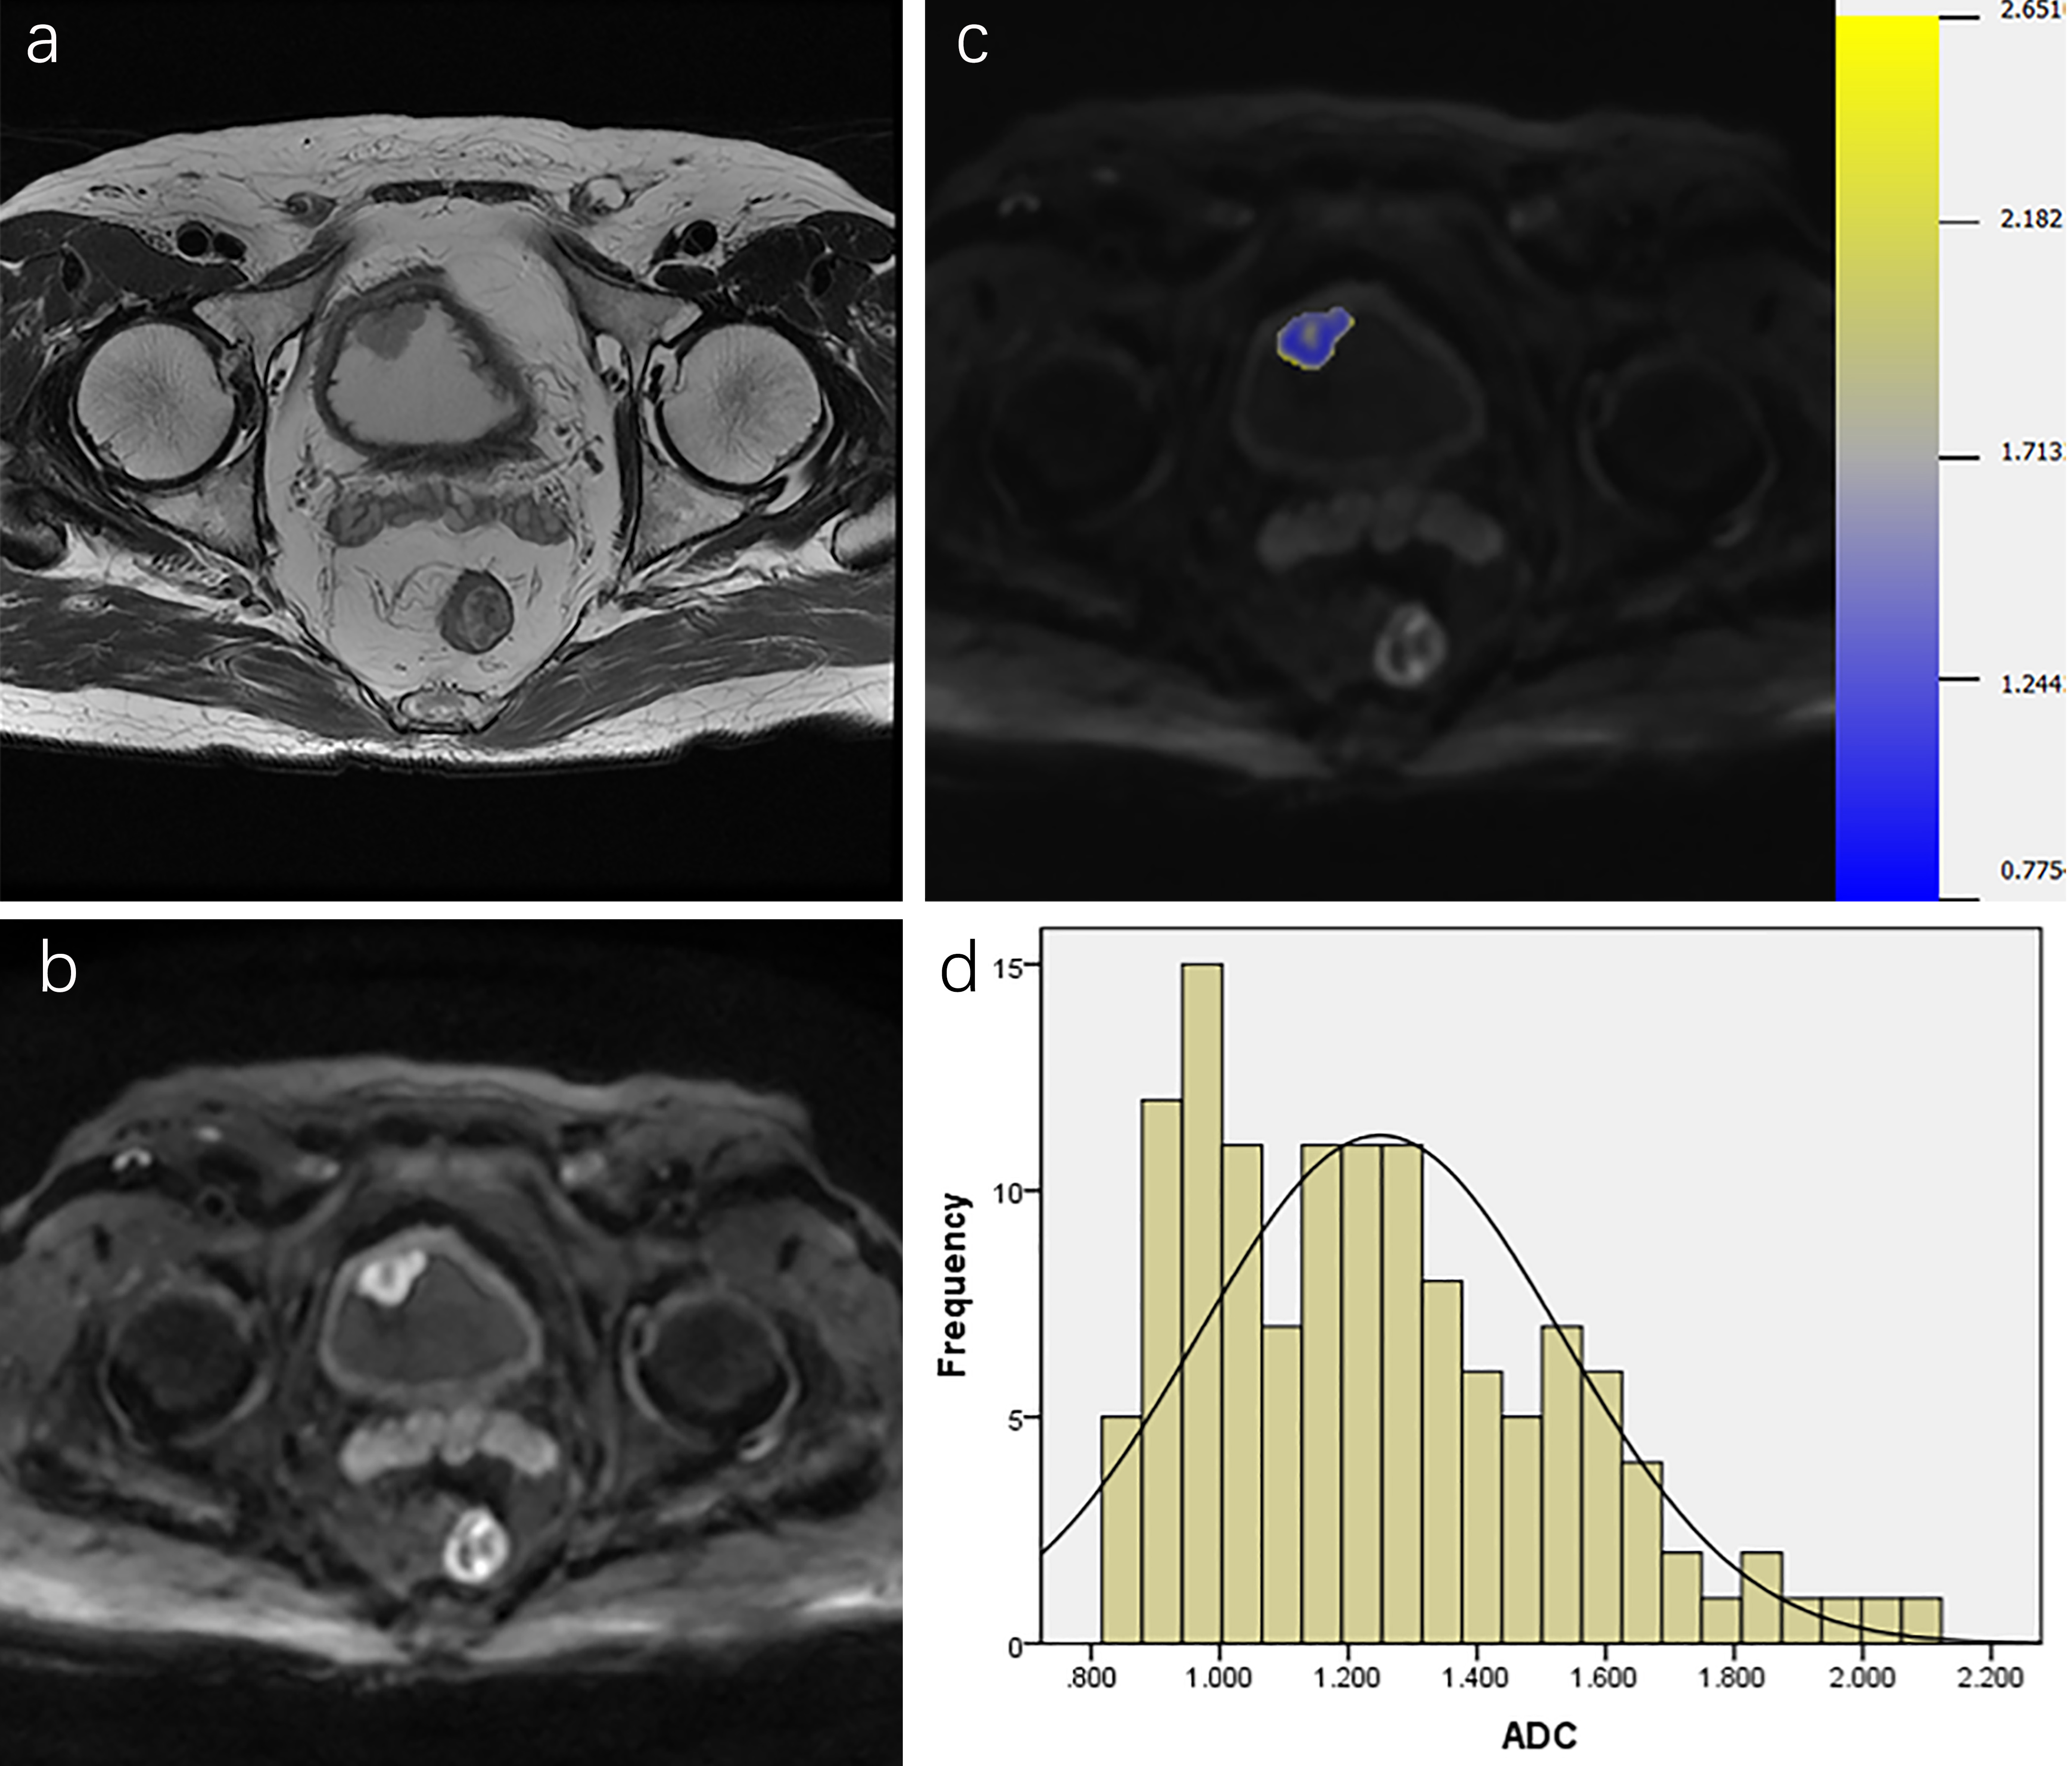
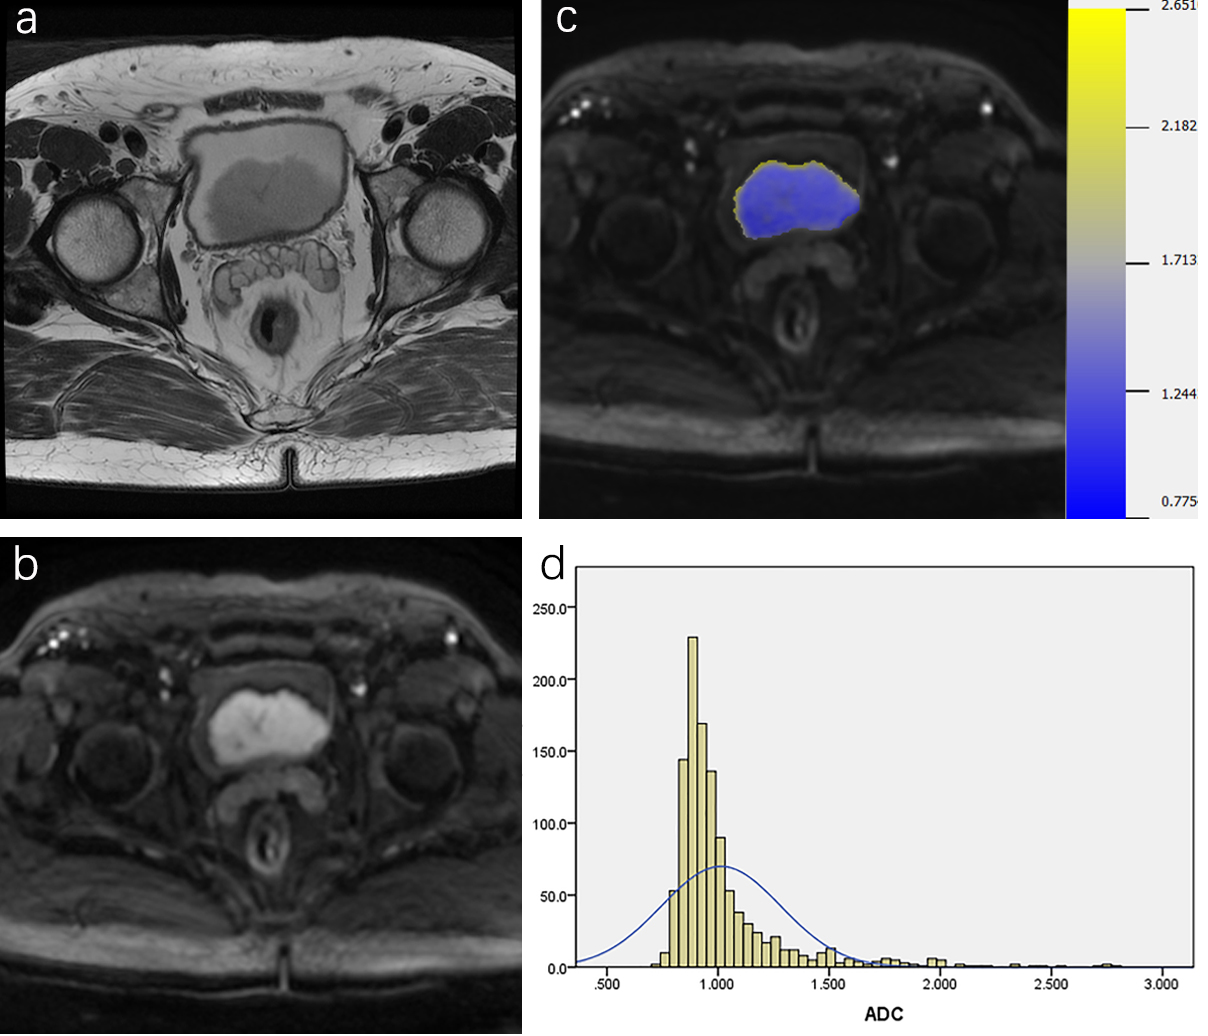
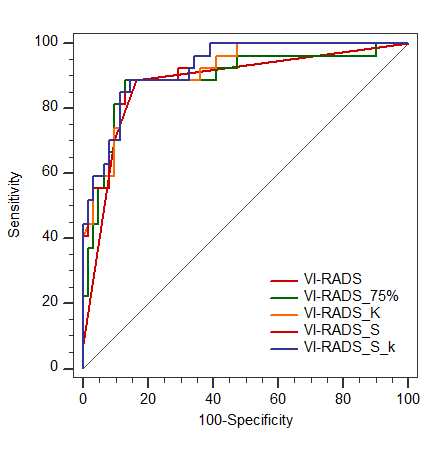
88 patients were retrospectively reviewed with pathologically proven NMIBC (n=61) or MIBC (n=27). All patients were performed MRI examinations including diffusion-weighted imaging (DWI) (b=0, 800s/mm2), and the VI-RADS score was evaluated based on DWI. Volumetric ADC histogram parameters were calculated from the volumetric of interest (VOI) on DWI, including the min ADC, mean ADC, median ADC, max ADC, 10th, 25th, 75th, 90th percentiles ADC, skewness, kurtosis, and entropy. The Mann-Whitney U-test was used to compare histogram parameters between NMIBC and MIBC. Receiver operating characteristic curves analysis was used to evaluate the diagnostic value of each significant parameter.Results
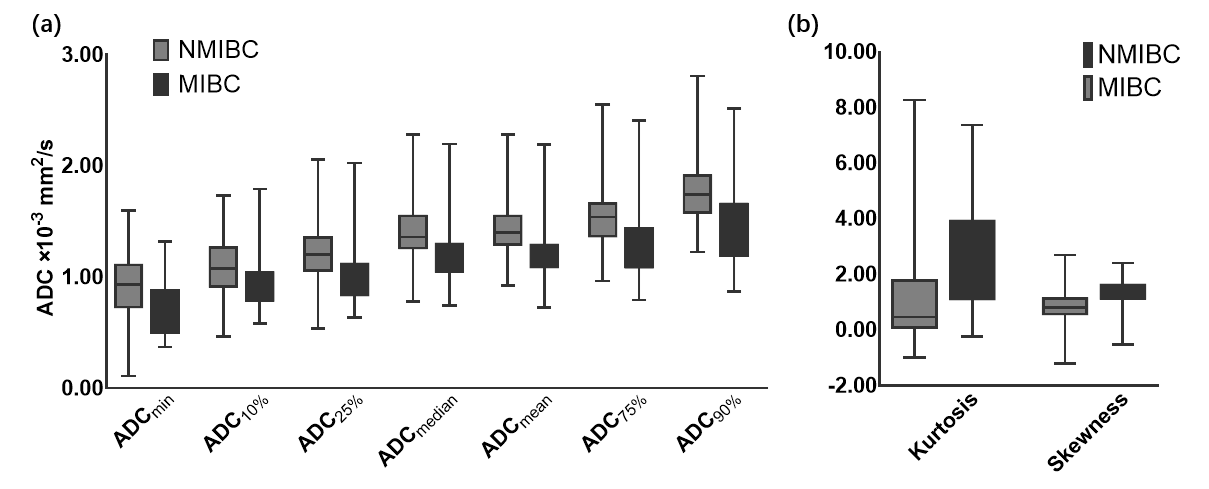
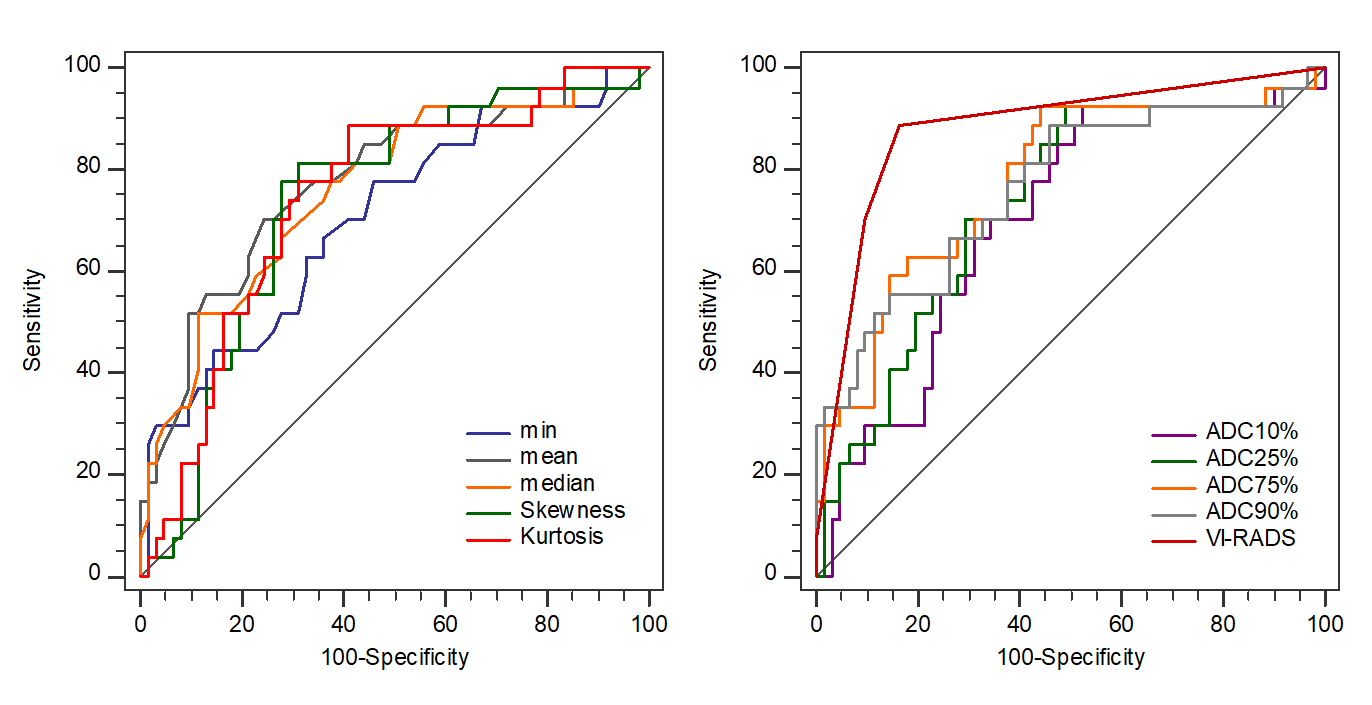
Among all parameters, the VI-RADS had the highest AUC (AUC, 0.88; sensitivity, 88.89%; specificity, 83.61%). MIBC had significantly lower min ADC, mean ADC, median ADC, 10th, 25th, 75th, 90th percentiles ADC than NMIBC (p=0.002, p<0.001, p<0.001, p=0.003, p=0.004, p<0.001, p<0.001). Skewness and kurtosis of MIBC were significantly higher than that of NMIBC (p<0.001, p<0.001). The combination of VI-RADS and skewness showed significantly higher AUC (AUC:0.923, 95% CI: 0.847-0.969) than only with VI-RADS (AUC,0.880, 95% CI: 0.793-0.940).Cobclusion
Volumetric ADC histogram analysis and VI-RADS are both useful methods in differentiating MIBC from NMIBC, and the Volumetric ADC histogram analysis could provide additional value to VI-RADS.Acknowledgements
This study is supported by the grants from National Natural Science Foundation of China (NSFC) No. 81771801,82071889, 81801695 and 81701657,82071890.References
1. Antoni, S., et al., Bladder Cancer Incidence and Mortality: A Global Overview and Recent Trends. Eur Urol, 2017. 71(1): p. 96-108.
2. Cumberbatch, M.G.K., et al., Epidemiology of Bladder Cancer: A Systematic Review and Contemporary Update of Risk Factors in 2018. Eur Urol, 2018. 74(6): p. 784-795.
3. Gregg, J.R., P. Dahm, and S.S. Chang, Guideline-based management of non-muscle invasive bladder cancer. Indian J Urol, 2015. 31(4): p. 320-6.
4. Jordan, B. and J.J. Meeks, T1 bladder cancer: current considerations for diagnosis and management. Nat Rev Urol, 2019. 16(1): p. 23-34.
5. Babjuk, M., et al., EAU Guidelines on Non-Muscle-invasive Urothelial Carcinoma of the Bladder: Update 2016. Eur Urol, 2017. 71(3): p. 447-461.
6. Babjuk, M., et al., European Association of Urology Guidelines on Non-muscle-invasive Bladder Cancer (TaT1 and Carcinoma In Situ) - 2019 Update. Eur Urol, 2019. 76(5): p. 639-657.
7. Wang, H., et al., Radiomics analysis of multiparametric MRI for the preoperative evaluation of pathological grade in bladder cancer tumors. Eur Radiol, 2019. 29(11): p. 6182-6190.
8. Yoshida, S., et al., DWI as an Imaging Biomarker for Bladder Cancer. AJR Am J Roentgenol, 2017. 208(6): p. 1218-1228.
9. Yoshida, S., et al., Role of diffusion-weighted magnetic resonance imaging as an imaging biomarker of urothelial carcinoma. Int J Urol, 2014. 21(12): p. 1190-200.
10. Padhani, A.R., et al., Diffusion-weighted magnetic resonance imaging as a cancer biomarker: consensus and recommendations. Neoplasia, 2009. 11(2): p. 102-25.
11. Takeuchi, M., et al., MR imaging of urinary bladder cancer for T-staging: a review and a pictorial essay of diffusion-weighted imaging. J Magn Reson Imaging, 2013. 38(6): p. 1299-309.
12. Zhao, Q., et al., Differentiation between idiopathic granulomatous mastitis and invasive breast carcinoma, both presenting with non-mass enhancement without rim-enhanced masses: The value of whole-lesion histogram and texture analysis using apparent diffusion coefficient. Eur J Radiol, 2020. 123: p. 108782.
13. Zou, X., et al., Volumetric Apparent Diffusion Coefficient Histogram Analysis in Differentiating Intrahepatic Mass-Forming Cholangiocarcinoma From Hepatocellular Carcinoma. J Magn Reson Imaging, 2019. 49(4): p. 975-983.
14. Kondo, M. and Y. Uchiyama, Apparent diffusion coefficient histogram analysis for prediction of prognosis in glioblastoma. J Neuroradiol, 2018. 45(4): p. 236-241.
15. Shindo, T., et al., Histogram Analysis of Apparent Diffusion Coefficient in Differentiating Pancreatic Adenocarcinoma and Neuroendocrine Tumor. Medicine (Baltimore), 2016. 95(4): p. e2574.
16. Suo, S.T., et al., Histogram analysis of apparent diffusion coefficient at 3.0 T in urinary bladder lesions: correlation with pathologic findings. Acad Radiol, 2014. 21(8): p. 1027-34.
17. Kobayashi, S., et al., Diagnostic performance of diffusion-weighted magnetic resonance imaging in bladder cancer: potential utility of apparent diffusion coefficient values as a biomarker to predict clinical aggressiveness. Eur Radiol, 2011. 21(10): p. 2178-86.
18. Panebianco, V., et al., An evaluation of morphological and functional multi-parametric MRI sequences in classifying non-muscle and muscle invasive bladder cancer. Eur Radiol, 2017. 27(9): p. 3759-3766.
19. Wang, H., et al., Multiparametric MRI for Bladder Cancer: Validation of VI-RADS for the Detection of Detrusor Muscle Invasion. Radiology, 2019. 291(3): p. 668-674.
20. Takeuchi, M., et al., Urinary bladder cancer: diffusion-weighted MR imaging--accuracy for diagnosing T stage and estimating histologic grade. Radiology, 2009. 251(1): p. 112-21.
21. Ueno, Y., et al., Diagnostic Accuracy and Interobserver Agreement for the Vesical Imaging-Reporting and Data System for Muscle-invasive Bladder Cancer: A Multireader Validation Study. Eur Urol, 2019. 76(1): p. 54-56.
22. Yajima, S., et al., Usefulness of the inchworm sign on DWI for predicting pT1 bladder cancer progression. Eur Radiol, 2019. 29(7): p. 3881-3888.
23. Arévalo, N., R. Méndez, and J. Barrera, "Inchworm sign" in urinary bladder cancer. Abdom Radiol (NY), 2018. 43(12): p. 3509-3510.
24. Li, H., et al., Quantitative Assessment of Bladder Cancer Reflects Grade and Recurrence: Comparing of Three Methods of Positioning Region of Interest for ADC Measurements at Diffusion-weighted MR Imaging. Acad Radiol, 2019. 26(9): p. 1148-1153.
25. Rosenkrantz, A.B., et al., Whole-lesion diffusion metrics for assessment of bladder cancer aggressiveness. Abdom Imaging, 2015. 40(2): p. 327-32.
26. Kobayashi, S., et al., Apparent diffusion coefficient value reflects invasive and proliferative potential of bladder cancer. J Magn Reson Imaging, 2014. 39(1): p. 172-8.
27. Avcu, S., et al., The value of diffusion-weighted MRI in the diagnosis of malignant and benign urinary bladder lesions. Br J Radiol, 2011. 84(1006): p. 875-82.
28. Wang, F., et al., Intravoxel incoherent motion diffusion-weighted imaging in assessing bladder cancer invasiveness and cell proliferation. J Magn Reson Imaging, 2018. 47(4): p. 1054-1060.
29. Tang, L. and X.J. Zhou, Diffusion MRI of cancer: From low to high b-values. J Magn Reson Imaging, 2019. 49(1): p. 23-40.
30. Baek, H.J., et al., Percent change of perfusion skewness and kurtosis: a potential imaging biomarker for early treatment response in patients with newly diagnosed glioblastomas. Radiology, 2012. 264(3): p. 834-43.
31. O'Brien, T., et al., Different angiogenic pathways characterize superficial and invasive bladder cancer. Cancer Res, 1995. 55(3): p. 510-3.
32. Huang, L., et al., The Diagnostic Value of MR Imaging in Differentiating T Staging of Bladder Cancer: A Meta-Analysis. Radiology, 2018. 286(2): p. 502-511.
33. Zhang, X., et al., Radiomics assessment of bladder cancer grade using texture features from diffusion-weighted imaging. J Magn Reson Imaging, 2017. 46(5): p. 1281-1288.
34. Xu, S., et al., Combining DWI radiomics features with transurethral resection promotes the differentiation between muscle-invasive bladder cancer and non-muscle-invasive bladder cancer. Eur Radiol, 2020. 30(3): p. 1804-1812.
35. Wang, F., et al., Diffusion kurtosis imaging to assess correlations with clinicopathologic factors for bladder cancer: a comparison between the multi-b value method and the tensor method. Eur Radiol, 2019. 29(8): p. 4447-4455.
36. Wang, Y., et al., Comparison of the Diagnostic Value of Monoexponential, Biexponential, and Stretched Exponential Diffusion-weighted MRI in Differentiating Tumor Stage and Histological Grade of Bladder Cancer. Acad Radiol, 2019. 26(2): p. 239-246.
Figures