3888
In vitro validation of a real-time 3D MRI Urodynamics Protocol1Medical Physics and Radiology, University of Wisconsin-Madison, Madison, WI, United States, 2Mechanical Engineering, University of Wisconsin-Madison, Madison, WI, United States
Synopsis
Lower urinary tract symptoms (LUTS) and changes in bladder function occur frequently as individuals age, requiring a non-invasive method of imaging the bladder. This study utilized 3D MRI acquisition on both an in vitro bladder model and an in vivo human subject to analyze deformation patterns during the bladder voiding process and validated results with high-speed optical imaging. Both quantitative and qualitative analyses were conducted. This study serves to discover novel methods of in vivo MRI bladder imaging during the voiding process.
INTRODUCTION
Lower urinary tract symptoms (LUTS) and changes in bladder function occur frequently as individuals age. Patients with LUTS are commonly evaluated through multi-channel urodynamic studies that determine bladder pressure and flow during voiding, however, these studies are invasive and provide little insight into the changes in bladder anatomy and detrusor muscle function that occur with aging and obstruction. Non-invasive methods of imaging the bladder are useful but can be limited by motion and chemical shift artifacts1,2. Although a combination of MRI and computational fluid dynamics has been used to analyze the movement of the bladder during voiding, 3D MRI acquisition has not yet been performed3. This study analyzes 3D MRI protocols during the voiding of an in vitro bladder model and validates them with high-speed optical imaging. Confirming adequate spatial and temporal resolution of this 3D MRI protocol using an in vitro bladder voiding brings us closer to utilizing this technique for regular in vivo diagnostic imaging.METHODS
In this IRB-approved and HIPPA-compliant study, a healthy, 37-year-old subject was recruited to void in the scanner during 3D MRI acquisition. Using this data, an in vitro bladder model was fabricated. The bladder was segmented from the MRI images and an STL was exported (Mimics, Materialize, Leuven, Belgium). The bladder was 3D printed using poly-vinyl alcohol (PVA) (Ultimaker, Geldermalsen, Netherlands). The bladder was then coated in silicone (SYLGARD™ 184 Silicone Elastomer, DOW Silicones Corporation, Midland, MI, USA) followed by latex (AeroMarine, Keyport, NJ). The inner PVA core was dissolved out and the remaining latex mold served as the in vitro bladder model. A ¼” diameter tube was then attached to the latex model to represent the urethra and used to fill the model with H2O until full (approximately 300 mL). The void time of the bladder model was calibrated to approximately 35 seconds.3D sagittal DISCO Flex images were used to analyze both in vitro and in vivo deformation over the voiding period. The in vitro MRI protocol was compared to hi-speed phantom cameras capturing deformation during identical voiding conditions. Additional hi-speed footage was acquired using an SLR camera. The MRI and phantom camera footage deformation were analyzed frame-by-frame using ImageJ (NIH, Maryland, USA) and the percent deformation rate using line segments was calculated (Figure 1a & b). Measurements were conducted until the phantom cameras were unable to further capture deformation behind the anterior portion of the bladder. Additionally, a 33-year-old subject with no history of LUTS was recruited to test the feasibility of our protocol. The subject was equipped with a condom catheter and instructed to void while imaging3. The in vivo 3D bladder images were segmented and deformation patterns were qualitatively compared to the in vitro conditions.
RESULTS
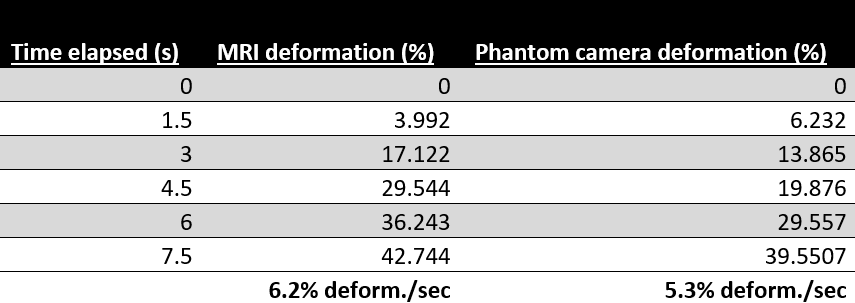
Figure 1 shows the side-by-side deformation of both the MRI sagittal 3D volumes and the SLR camera footage of the in vitro bladder model and the approximate line segments used to calculate percent deformation. Figures 2 and 3 show the deformation of the 3D segmented in vitro and in vivo subject bladder at various time points throughout voiding, respectively (3-Matic, Materialise, Leuven, Belgium). Figure 4 shows the deformation rate of both the MRI and phantom camera imaging modalities. The calculated rates of deformation in both the MRI and phantom camera were 6.2% deformation per second and 5.3% deformation per second, respectively (Figure 4). There was a 15% difference in the two deformation rates relative to the phantom camera value. Qualitative analysis of both methods showed similar patterns of deformation.DISCUSSION
Bladder movement behavior during voiding proves difficult due to various artifacts during imaging. This study utilized optical imaging modalities and an in vitro bladder model to verify the feasibility of this 3D MRI acquisition protocol for an in vivo human subject. Comparison between the optical imaging, in vitro MRI, and in vivo MRI proved useful for studying deformation patterns among the three techniques. Asymmetric contraction of the bladder is evident from the visual inspection of the in vivo deformation patterns, which motivates further studies including this sequence. Future tests will utilize this 3D MRI protocol to target other bladder and urinary-related pathologies beyond LUTS.There are many factors that differentiate the in vitro experiments conducted in this study from the in vivo bladder analysis. Although the rate of the in vitro bladder model voiding was kept similar to that of the subject trial, the pattern of bladder deformation in vivo varies greatly due to the assistance of the surrounding detrusor muscle4. Another limitation of the study is that the rate of the high-speed footage was only analyzed to the point at which the posterior wall of the bladder deformed below the anterior wall, making it impossible to track subsequent deformation. Future work will focus on fabricating a transparent thin-wall model to overcome this limitation.
CONCLUSION
3D MRI urodynamics were able to quantitatively capture real-time movement of an in vitro model of the bladder during the voiding process. Deformation during voiding was validated using hi-speed optical imaging. This will serve to help discover novel methods of using MRI to image the bladder voiding process in vivo.Acknowledgements
We acknowledge GE Healthcare, which provides research support to the University of Wisconsin.References
1. NIH (2020) Urinary Tract Imaging. National Institute of Diabetes and Digestive and Kidney Diseases. https://www.niddk.nih.gov/health-information/diagnostic-tests/urinary-tract-imaging
2. Verma, S., Rajesh, A., Prasad, S. R., Gaitonde, K., Lall, C. G., Mouraviev, V., Sandrasegaran, K. (2012). Urinary Bladder Cancer: Role of MR Imaging. RadioGraphics, 32(2), 371-387. doi:10.1148/rg.322115125
3. Pewowaruk R, Rutkowski D, Hernando D, Kumapayi BB, Bushman W, Roldán-Alzate A (2020). A pilot study of bladder voiding with real-time MRI and computational fluid dynamics. PLoS ONE 15(11): e0238404. https://doi.org/10.1371/journal.pone.0238404
4. Sam P, Nassereddin A, LaGrange CA. Anatomy, Abdomen and Pelvis, Bladder Detrusor Muscle. [Updated 2020 Aug 10]. In: StatPearls [Internet]. Treasure Island (FL): StatPearls Publishing; 2020 Jan-. Available from: https://www.ncbi.nlm.nih.gov/books/NBK482181/
Figures