3886
Effects of Life-Long Western Diet Consumption on Fetal and Maternal Guinea Pig Body Composition at Mid-Gestation
Lindsay E Morris1, Flavien Delhaes2, Lanette Friesen Waldner1, Trevor Wade1, Lauren M Smith1, Mary-Ellen ET Empey1, Simran Sethi1, Timothy RH Regnault2,3,4, and Charles A McKenzie1,4
1Medical Biophysics, Western University, London, ON, Canada, 2Physiology and Pharmacology, Western University, London, ON, Canada, 3Obstetrics and Gynaecology, Western University, London, ON, Canada, 4Division of Maternal, Fetal and Newborn Health, Children's Health Research Institute, London, ON, Canada
1Medical Biophysics, Western University, London, ON, Canada, 2Physiology and Pharmacology, Western University, London, ON, Canada, 3Obstetrics and Gynaecology, Western University, London, ON, Canada, 4Division of Maternal, Fetal and Newborn Health, Children's Health Research Institute, London, ON, Canada
Synopsis
Effects of a life-long high fat and high sugar diet (Western diet: WD) in ~38-day gestation guinea pigs. Pregnant life-long WD or control diet (CD) fed sows underwent T1-weighted and IDEAL water-fat images on a 3T MRI at mid gestation. Regions of interest were segmented around key volumes. The maternal liver volume and median fat fraction were significantly higher in WD relative to CD sows while measures of other fat depots were unaltered between diet groups. The fetal and placental volumes were not significantly different between the diet groups. This research expands our understanding of metabolically unhealthy pregnancies.
Introduction
The prevalence of energy-dense diets, such as the Western Diet1 (WD) and sedentary lifestyles have increased dramatically over the last several decades.2 The WD is predominantly composed of saturated fats and simple sugars.1 WD consumption negatively impacts metabolic health, in association with altered body composition and liver steatosis.3 WD consumption is also associated with altered in-utero fetal metabolic programming and body composition,4 increasing the risk for later life metabolic disease.5,6 Previous research has focused on the effects of a maternal WD near-term.7 Maternal metabolism changes throughout pregnancy, from an anabolic state in the first two trimesters of gestation to a catabolic state in the third trimester.8 This project focuses on identifying key markers using fetal and maternal imaging parameters at mid-term pregnancy, before the switch to catabolic metabolism. The project's objective was to investigate the effects of the life-long WD on fetal and maternal body composition in a guinea pig pregnancy at mid-gestation.Methods
Ten in-house-bred Dunkin-Hartley sows were randomly weaned onto either a WD (33% carbohydrates, 46% fat, 21% protein, n=6) or a control diet (CD, 60% carbohydrates, 18% fat, 22% protein, n=4). Following a first pregnancy, sows were mated at 259 ± 44 days. At ~38 days gestation (term ~ 68 days), each sow underwent an MRI exam.9 A total of 21 WD fetuses and 14 CD fetuses (litter size: 2-5 and 3-5, respectively) were imaged. T1-weighted and IDEAL water, fat, and proton density fat fraction (PDFF) images were acquired at 3T. Regions of interest (ROI) were manually thresholded and segmented in 3D Slicer around the whole body (WB), liver, subcutaneous adipose tissue (SAT), visceral adipose tissue (VAT), fetuses, and placentae on the T1-weighted and PDFF images to obtain the organ volumes and median PDFF values.10 Placental efficiency, customarily defined as the ratio of fetal weight per placental weight,11 was modified to utilize the volumes measured in this study. For the maternal data, SAT, VAT and total adipose tissue (TAT: SAT plus VAT) volumes were normalized to the WB volumes. The SAT/WB, VAT/WB and TAT/WB percentages, liver volumes and liver median PDFF values were compared between the two diets using an independent samples t-test in R. For the fetal data, placental and fetal volumes were analyzed using a linear mixed model (LMM), where the maternal sow was controlled for as a random variable. Similarly, placental efficiency and placental and fetal PDFFs were analyzed using an LMM, controlled by the individual sow.Results
Maternal liver volume (Fig. 1A, 1B, & 1C) and median PDFF (Fig. 1D) were significantly higher (p<0.05) in WD than CD animals. The SAT/WB, VAT/WB and TAT/WB percentages were not significantly different (p>0.05) between WD and CD groups (Fig. 2). There were no significant differences (p>0.05) between the maternal diets for fetal and placental volumes (Fig. 3A). The placental efficiency was not significantly different (p>0.05) between diets (Fig. 3B), although a 22% decrease was observed in WD than CD. Similarly, there were no significant differences reported for fetal and placental median PDFFs (p>0.05) between WD and CD pregnancies.Discussion
These maternal results show that the WD is associated with an increased liver PDFF and volume relative to the CD. The elevation in the liver median PDFF was consistent with previous WD studies in near-term pregnancy sows.7 The accumulation of liver lipid is an indicator of metabolic dysfunction and an alteration of the maternal environment.11 The maternal SAT/WB, VAT/WB and TAT/WB percentages were similar between WD and CD sows, indicating a greater impact of the WD on liver metabolism than on lipidic storage. We observed differences in maternal liver composition but no differences between adipose tissue deposits. These differences highlight a lean nonalcoholic fatty liver disease (NAFLD) phenotype, an observation that aligns with the concept that metabolically unhealthy individuals are not necessarily obese.3 The WD and CD exposed placentae and fetuses had similar volumes, median PDFFs and placental efficiency at ~38 days gestation. This similar outcome at mid-gestation suggests that a potential impact of a WD is not observable at this stage in pregnancy. In contrast, differences have been reported in near-term WD exposed fetuses, displaying increased fetal volumes, and increased liver PDFFs.7 Increased TAT volume to fetal volume ratios, increased liver to fetal volume ratios, and decreased brain to fetal volume ratios were also observed.7Conclusion
We analyzed the maternal, fetal and placental units separately to investigate how a life-long WD affects body composition at mid-gestation. We conclude that the WD was associated with increased maternal liver lipid content, while observing no changes in SAT, VAT and TAT content. WD exposure did not alter the placental and fetal volumes relative to the CD at ~38 days gestation. More research to fully understand the effects of the maternal diet at the early stage of development of the fetus is needed. Future work correlating the imaging data with measures at collection will improve our understanding of the ontological effects of life-long WD during pregnancy to help identify key fetal and maternal metabolic dysfunction biomarkers over pregnancy.Acknowledgements
This work was supported by: Canadian Institutes of Health Research (grant number 162308) and the National Institutes of Health (grant number 1U01HD087181-01). The authors acknowledge Shang Shi for her assistance with the segmentation of the images, and Paige Allen for her assistance with the statistical analyses.References
- Cordain L, Eaton SB, Sebastian A, et al. Origins and evolution of the Western diet: health implications for the 21st century. Am. J. Clin. Nutr. 2005;81(2):341–354.
- Hruby
A, and Hu FB. The Epidemiology of Obesity: A Big Picture. PharmacoEconomics.
2015;33(7):673–689.
- Osadnik K, Osadnik T, Lonnie M, et al. Metabolically healthy obese and metabolic syndrome of the lean: the importance of diet quality. Analysis of MAGNETIC cohort. Nutr. J. 2020;19:19.
- Heerwagen MJR, Miller MR, Barbour LA, & Friedman JE. Maternal obesity and fetal metabolic programming: a fertile epigenetic soil. Am. J. Physiol. Regul. Integr. Comp. Physiol. 2010;299(3): R711–R722.
- Boney CM, Verma A, Tucker R, & Vohr BR. Metabolic syndrome in childhood: Association with birth weight, maternal obesity, and gestational diabetes mellitus. Pediatrics. 2005;115(3):e290-6.
- Catalano PM, Farrell K, Thomas A, et al. Perinatal risk factors for childhood obesity and metabolic dysregulation. Am. J. Clin. Nutr. 2009;90(5):1303–1313.
- Sinclair KJ, Friesen-Waldner LJ, McCurdy CM, et al. Quantification of fetal organ volume and fat deposition following in utero exposure to maternal Western Diet using MRI. PLoS One. 2018;13(2):e0192900.
- Zeng Z, Liu F, & Li S. Metabolic Adaptations in Pregnancy: A Review. Ann. Nutr. Metab. 2017;70:59–65.
- Friesen-Waldner LJ, Sinclair KJ, Wade TP, et al. Hyperpolarized [1- 13 C]pyruvate MRI for noninvasive examination of placental metabolism and nutrient transport: A feasibility study in pregnant guinea pigs. J. Magn. Reson. Imaging 2016;43(3):750–755.
- Fedorov A, Beichel R, Kalpathy-Cramer J, et al. 3D Slicer as an image computing platform for the Quantitative Imaging Network. Magn. Reson. Imaging 2012;30(9):1323–1341.
- Wilson ME, Ford SP. Comparative aspects of placental efficiency. Reprod. Suppl. 2001;58:223–32.
Figures
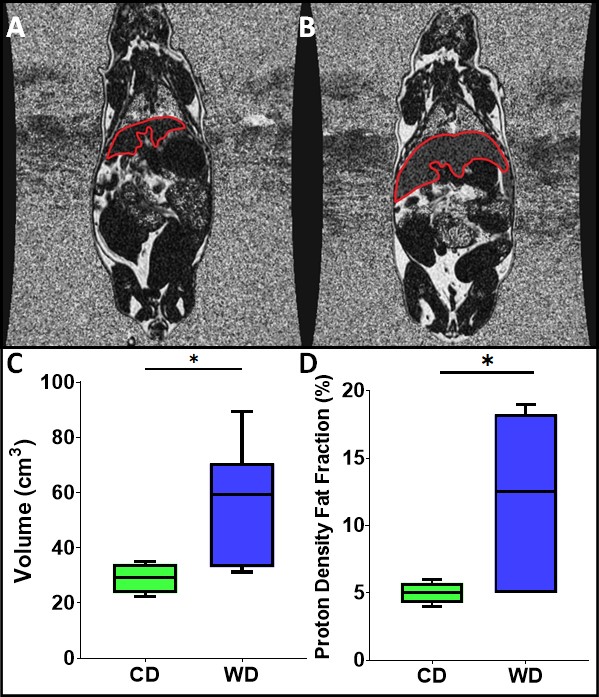
Proton density fat fraction IDEAL image slice of (A) a control diet (CD) guinea pig, and (B) a Western diet (WD) guinea pig, with the liver segmented in red. Note the visibly elevated PDFF in the liver of the WD guinea pig. (C) Maternal liver volumes from T1-weighted images for CD and WD sows (p=0.043), (D) Proton density fat fraction (PDFF) for liver from IDEAL images for CD and WD sows (p=0.040). One star (*) indicates (p<0.05).
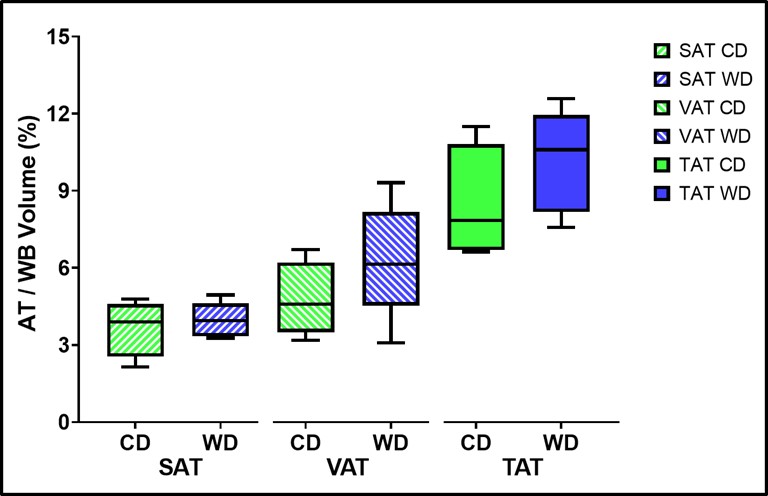
Maternal adipose tissue (AT) volume as a percentage of the whole body volume from IDEAL images for control diet (CD) and Western (WD) sows. From the left, subcutaneous adipose tissue (SAT) volume over whole body (WB) volume (white bars diagonal right), visceral adipose tissue (VAT) volume over WB volume (white bars diagonal left), and total adipose tissue (TAT; SAT and VAT) volume over WB volume (solid colour). No significant differences in adipose tissue volumes between CD and WD sows were detected.
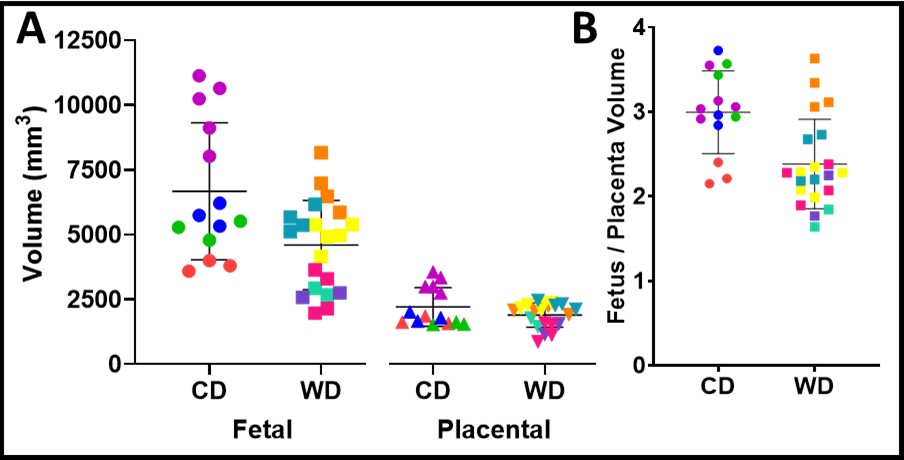
(A) Fetal and placental volumes from T1-weighted images for control diet (CD) and Western diet (WD) groups. (B) Placental efficiency, displayed as fetal volume/placental volume for CD and WD groups. Data points coded the same colour within each diet group are fetuses from the same sow.