3885
Longitudinal Study on Early Gestation T2*-based BOLD effect in Human Placenta1Medical Physics, University of Wisconsin - Madison, Madison, WI, United States, 2GE Global Research, Niskayuna, NY, United States, 3Radiology, University of Wisconsin - Madison, Madison, WI, United States, 4Biomedical Engineering, University of Wisconsin - Madison, Madison, WI, United States, 5Medicine, University of Wisconsin - Madison, Madison, WI, United States, 6Emergency Medicine, University of Wisconsin - Madison, Madison, WI, United States, 7Obstetrics and Gynecology, University of Wisconsin - Madison, Madison, WI, United States, 8Electrical and Computer Engineering, University of Wisconsin - Madison, Madison, WI, United States
Synopsis
Maternal obesity is associated with negative pregnancy outcomes, potentially due to insufficient placental flow and oxygen delivery. Blood oxygen level-dependent (BOLD) based T2* measurements are associated with oxygenation and have shown to provide assessment of placental function. Here, we report placental T2* values in a cohort of 70 obese and non-obese subjects with normal and adverse gestational outcomes. Results show variation of T2* histograms between normal subjects and subjects with pregnancy complications at both 14 and 20 weeks, whereas no significant median T2* value differences were observed in between non-obese and obese groups.
Introduction
Placental health and development are closely linked with pregnancy complications and outcomes. Maternal obesity can result in placental vascularity malfunction [1] and also increases the chance of pregnancy complications such as gestational diabetes, hypertension, preeclampsia, and pre-term birth [2]. One quantitative biomarker of placental health is MRI T2* mapping based on the BOLD effect, which has been shown to correlate with some adverse pregnancy outcomes [3-5]. Here, we expand on preliminary studies [6] to measure T2* values in early (14 weeks) and mid 2nd trimester (20 weeks) of gestation for obese and non-obese subjects and assess feasibility of complication prediction.Methods
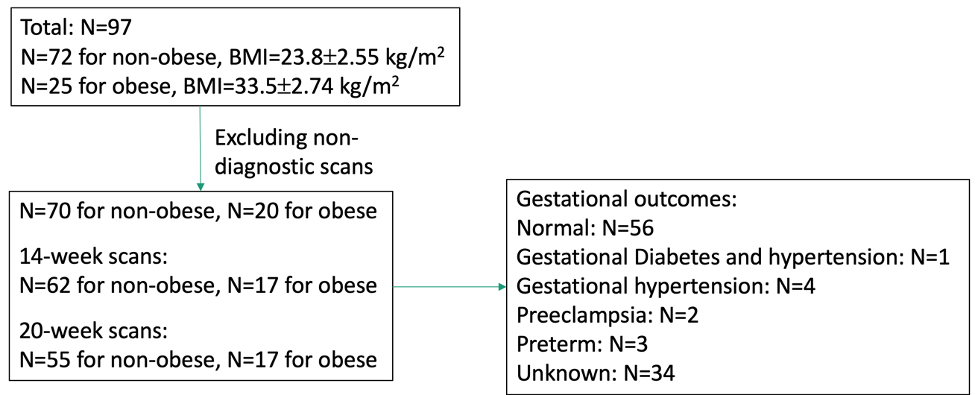
Subjects: 97 pregnant women participated in this IRB approved study. 25 subjects had body mass index (BMI) of over 30 kg/m2 (33.5±2.74 kg/m2) and are considered obese for this study. The non-obese (N=72) group had an average BMI of 23.8±2.55 kg/m2. All subjects underwent MRI at gestation ages of 14 and 20 weeks.Data Collection: MRI scans were acquired on a wide-bore 1.5T MRI scanner (Optima MR 450w, GE Healthcare) with a 48-channel phased-array coil in supine position. Images covering the placenta were collected with an axial 3D multi-echo spoiled gradient echo (flip angle=9°, TR=43.0ms, initial TE=1.5ms, number of TEs=16, DTE=2.6 ms, image volume=42x38x14cm3, resolution=2.2x2.0x3.0 mm3, scan time=5:27 mins with respiratory gating).
Data reconstruction and analysis: IDEAL processing using monoexponential fit of complex echo images was used to generate water, fat and T2* maps. Image quality of both the water-only and T2* maps were determined on a 5-point Likert scale based on motion, noise, and overall quality: 3-5 was considered diagnostic quality, score of 1-2 on either map was considered clinically unacceptable and excluded from data analysis. Semi-automatic placental segmentation was conducted by a graduate student with 2 years of experience in medical image analysis using the water-only images through ITK-SNAP [7]. Image quality scoring was performed by a by a radiologist with 10 years of clinical MRI experience, who also verified or corrected the placental segmentations. A flowchart summary of data selection is shown in Figure 1. Median T2* measures between groups were compared with paired t-tests (p<0.05) and T2* histograms were computed [8].
Results
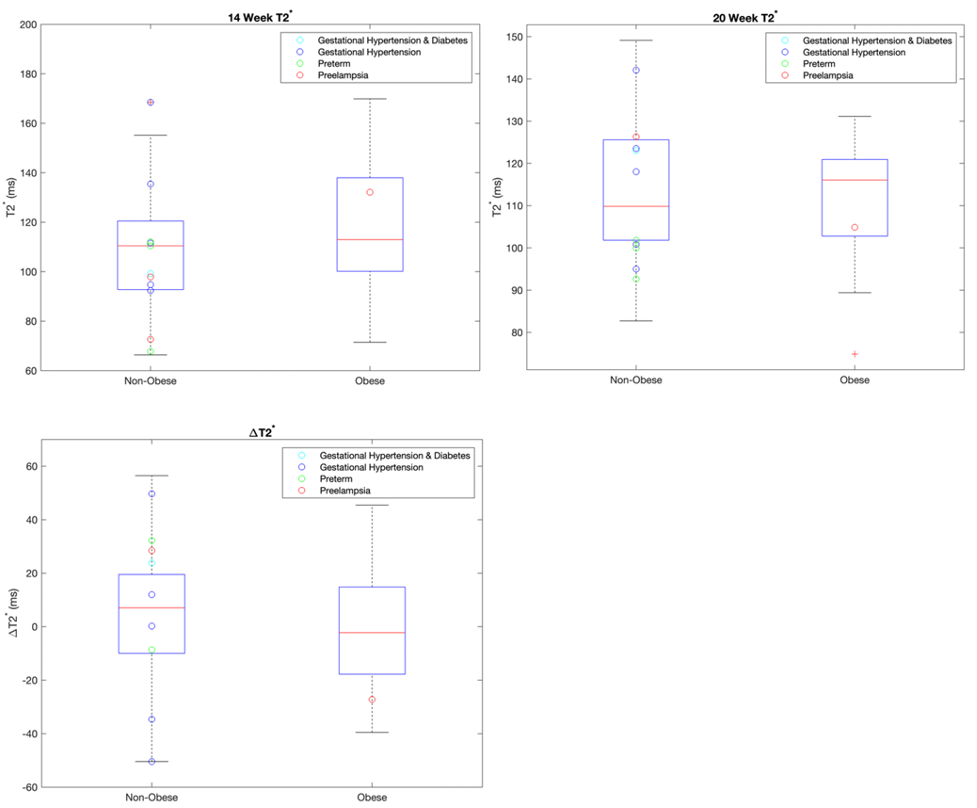
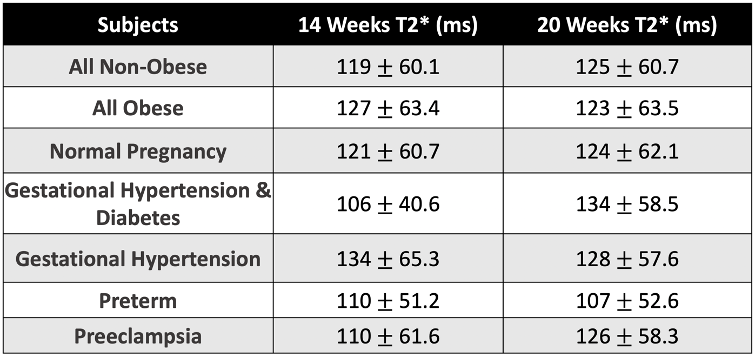
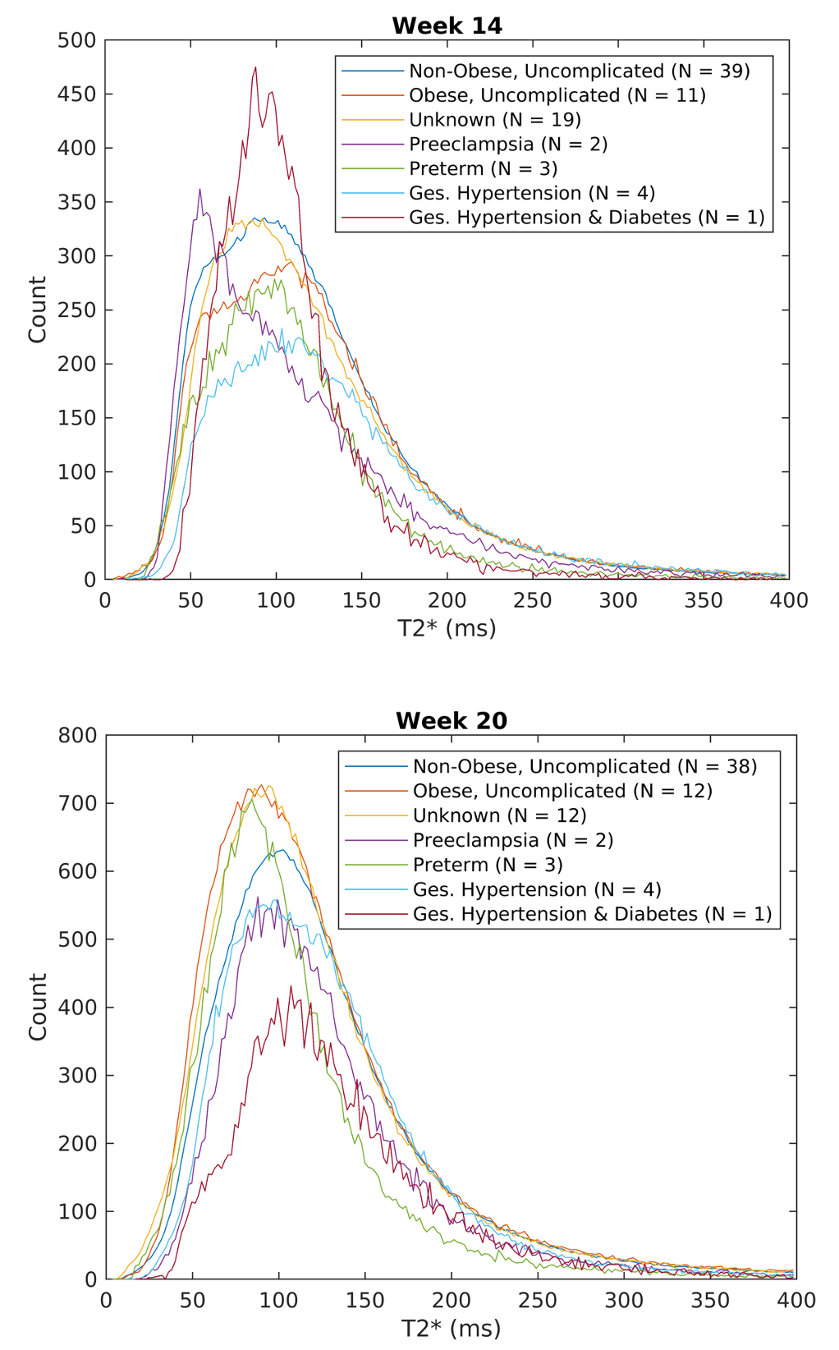
Figure 2 shows 14-week, 20-week, and difference between 20- and 14-week median T2* values for the non-obese and obese groups, with T2* of subjects with abnormal gestation outcomes overlaid. The non-obese subjects have a trend of increased T2* with increased gestation age; the obese subjects show the opposite trend. However, there are no statistically significant differences in the T2* values between non-obese and obese subjects or from 14 to 20 weeks within these groups. Median T2* values indexed by pregnancy complications and obese vs non-obese are shown in Table 1.Figure 3 shows the averaged T2* histogram representation for each group of pregnancy complications along with uncomplicated obesity groups. The histograms show notable differences in shape: at 14 weeks, the histogram for subjects with hypertension and preterm birth has similar shape than normal but lower counts; preeclampsia is characterized by a shift to lower T2* values and a less symmetric shape; hypertension and gestational diabetes has a higher and sharper peak. At 20 weeks, the overall counts are increased, reflecting growth of the placenta. Patients with hypertension and preeclampsia show lower counts than controls; patients with hypertension and gestational diabetes show much lower counts; and patients that delivered preterm show a slightly steeper histogram shape that is shifted towards lower T2* values.
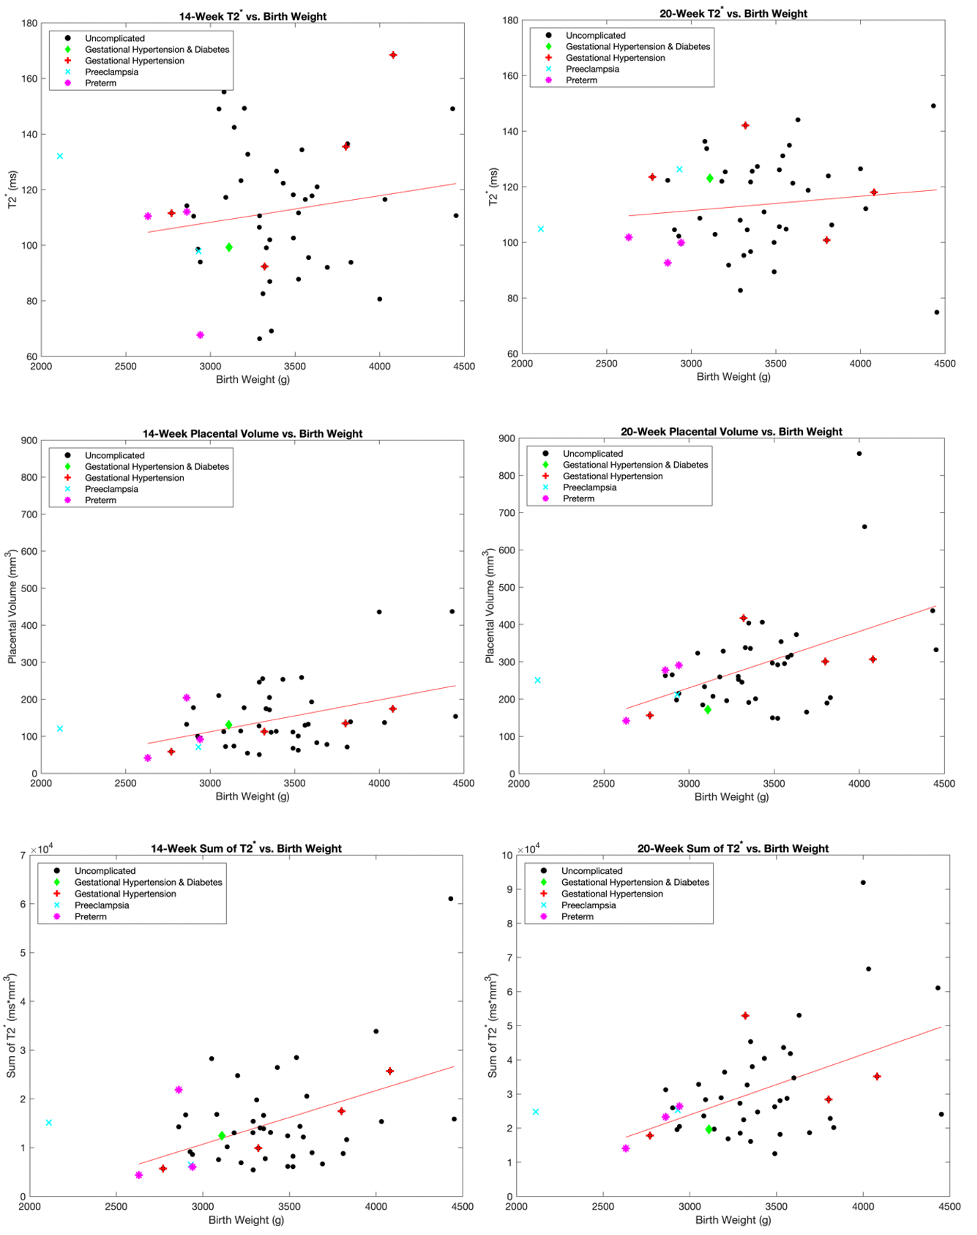
Figure 4 shows median T2*, placenta volume, and the sum of T2* for week 14 and week 20 as a function of birthweight. Sum of T2* was calculated as pixel-wise mean T2* multiplied by the placental volume, determined through placental segmentation. T2* values alone are not predictive of birth weight outcomes at the early gestation window; however, some subjects with pregnancy complications are associated with relatively lower placental volume and lower sum of T2*.
Discussion and Conclusion
Our analysis shows median T2* values alone were not significantly different between subjects with and without adverse events or different between non-obese and obese subjects at early gestation ages. Overall, our T2* values for 1.5T were slightly lower (~125 ms) than reported by Sorenson [9] at 1.5T (~150 ms) and did not follow the trend of a decrease with gestation age reported in [8, 9].Subjects with certain gestational complications were associated with low sum of T2* and low placental volume; however, the number of determined pathological cases in our cohort is too small to provide more in-depth statistical analysis and prior studies have shown limited value in placental volume as a predictor for pregnancy complications.
The differences in T2* histograms between pregnancies with no reported complications and those with complications are intriguing and resemble findings by Schabel et al. [8], which inspired this analysis. Further investigation with more subjects is needed to identify shape descriptors that can predict pregnancy complications and, possibly, improve patient care by early therapeutical interventions. As this study shows, large number of subjects need to be prospectively enrolled to image the few patients early in pregnancy who will later develop complications. Hence, multi-center studies would be likely needed.
Acknowledgements
The authors acknowledge funding from NIH grant R21-AI129308 and NIH Human Placenta Project (U01-HD087216), as well as GE Healthcare for their research support.References
[1] Kelly AC, Powell TL, Jansson T; Placental function in maternal obesity. Clin Sci (Lond) 30 April 2020; 134 (8): 961–984. doi: https://doi.org/10.1042/CS20190266
[2] Howell KR, Powell TL. Effects of maternal obesity on placental function and fetal development. Reproduction. 2017 Mar;153(3):R97-R108. doi: 10.1530/REP-16-0495. Epub 2016 Nov 18. PMID: 27864335; PMCID: PMC5432127.
[3] Ho A, Hutter J, Jackson L, Seed P, Mccabe L, Al-Adnani M, Marnerides A, George S, Story L, Hajnal J, Rutherford MA, Chappell L. (2020). T2* Placental Magnetic Resonance Imaging in Preterm Preeclampsia. Hypertension (Dallas, Tex. : 1979), 75, 1523 - 1531.
[4] Sinding M, Peters DA, Frøkjaer JB, Christiansen OB, Petersen A, Uldbjerg N, Sørensen A. Placental magnetic resonance imaging T2* measurements in normal pregnancies and in those complicated by fetal growth restriction. Ultrasound Obstet Gynecol. 2016 Jun;47(6):748-54. doi: 10.1002/uog.14917. PMID: 26041014.
[5] Yurttutan N, Bakacak M, Kızıldağ B. Comparison of the T2-star Values of Placentas Obtained from Pre-eclamptic Patients with Those of a Control Group: an Ex-vivo Magnetic Resonance Imaging Study. Balkan Med J. 2017 Sep 29;34(5):412-416. doi: 10.4274/balkanmedj.2016.1472. Epub 2017 May 29. PMID: 28552841; PMCID: PMC5635627.
[6] Zhu A, Starekova J, Batan T, Johnson KM, Reeder SB, Wieben O, Shah DM, Hernando D. Preliminary Study on the Longitudinal T2*-based BOLD Placental MRI in Obese Pregnant Human Subjects. In: Proc 28th Annual Meeting ISMRM.;2020:2572.
[7] Yushkevich PA, Piven J, Hazlett HC, et al. User-guided 3D active contour segmentation of anatomical structures: Significantly improved efficiency and reliability. Neuroimage. 2006;31(3):1116-1128.
[8] Schabel MC, Roberts VHJ, Rincon M, et al. A longitudinal multisite study of endogenous BOLD MRI in human pregnancies. In: Proc 27th Annual Meeting ISMRM. ; 2019:1075.
[9] Sorenson A, Hutter J, Seed M, Grant PE, Gowland P., T2*-weighted placental MRI: basic research tool or emerging clinical test for placental dysfunction? Ultrasound Obstet Gynecol. 2020; 55: 293–302.
Figures