3882
Evaluation of R2* and automatically quantitative ITSS in diagnosis of malignant ovarian tumor.1The First Affiliated Hospital of Dalian Medical University, Dalian, China, 2Dalian University of Technology, Dalian, China
Synopsis
Malignant ovarian tumor is characterized of high incidence, poor treatment outcomes and high treatment costs. The aim of this study was to explore the value of R2* and automatically quantitative ITSS in differentiating malignant ovarian tumor (MOTs) from other ovarian tumors (OOTs). Results of this study indicate the ITSS and R2* values of MOTs were significantly higher than those of OOTs. The combination of the two parameters can improve the differential diagnosis efficiency.
Introduction
Malignant ovarian tumor is the most frequent cause of deaths among gynecologic malignancies. It’s of great importance to distinguish malignant ovarian tumors (MOTs) from other ovarian tumors (OOTs). R2* is transverse relaxation rate that is obtained via gradient reunion at different times. It can provide indirect quantitative assessment of tissue hypoxia.1 Intratumoral susceptibility signal (ITSS), continuous line or dotted low signal area inside the tumor on the phase image, can show microhemorrhages and neoangiogenesis in the lesion.2 Park et al3 established a semiquantitative scoring method of manually counting shape-based ITSS intensities. However, this method is easily influenced by the subjective judgment of the observer. In this study, we hypothesize that it’s practicable to differentiate MOTs from OOTs quantitatively and automatically by ITSS and explore the diagnostic value of R2* and the combination of ITSS and R2* for ovarian malignant tumor.Methods
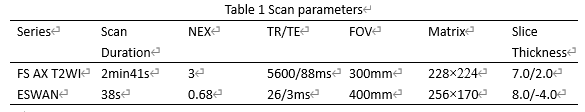
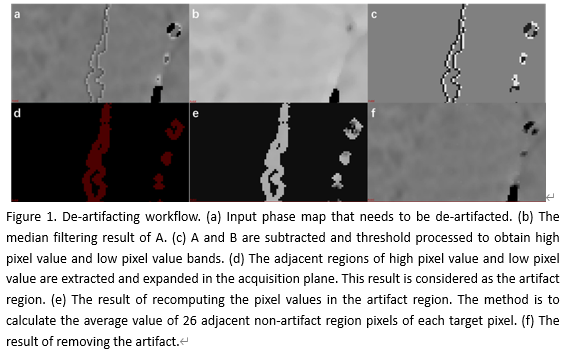
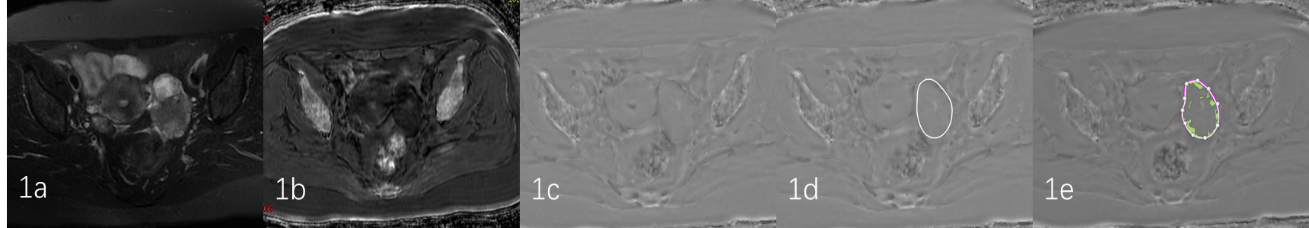
19 patients (mean age: 53.4±14.7 years, range: 8-76 years) with malignant ovarian tumors and 24 patients (mean age: 48.2±17.6 years, range: 11-83 years) with other ovarian tumors (including benign and borderline tumors) who were underwent T2-weighted imaging (T2WI) and enhanced T2 star-weighted angiography (ESWAN) scans on a 1.5 T MR scanner (Signa HDxt, GE Medical Systems, USA) were involved in this study. Detailed scanning parameters were listed in Table 1. The original axial digital images from the ESWAN sequence were transmitted to the ADW 4.6 workstation. Functool software was used to perform post-processing to obtain R2* and phase maps. With reference to T2WI, the regions of interest (ROIs) were manually drawn on lesions of three slices (including the slice covering the largest dimension of tumor and its adjacent upper and lower slices) on R2* maps. The average R2* values were calculated to minimize measurement bias. Due to the acquisition, there are banding artifacts in the phase map as shown in Figure 1 (a). Therefore, the workflow shown in Figure 1 is first used to remove artifacts from the input phase map. The workflow is as follows: (i) Firstly, the abnormal pixels with high gray value and low gray value in the phase map are detected; (ii) Then, the artifact region is determined according to the feature of adjacent pixels of high pixel value and low pixel value; (iii) Finally, the pixel values in the artifact region are recalculated according to the gray values of the surrounding non-artifact pixels. Phase maps after using batch program to remove artifacts were exported as NII format, and transmitted to AnatomySketch (AS) software, which is programmed using C++ based on Qt and VTK libraries (Dalian University of Technology). Referencing to T2WI images, ROIs were delineated around the edge of the tumor on phase maps. (Figure 2). ROIs can be obtained without layer-by-layer annotation through the interpolation and annotation tools of AS. After that, the AS software can automatically calculate the ITSS ratio of the phase maps. ITSS ratio was defined as the ratio of ITSSs to the lesion involving area on tumor maximal axial section.4 All statistic analyses were analyzed by SPSS 26.0 software. Mann-Whitney U test was used to compare the differences of R2* and ITSS values between MOTs group and OOTs groups. Diagnostic performances of R2*, ITSS and their combination for MOTs were evaluated by receiver operating characteristic (ROC) analyses.Results
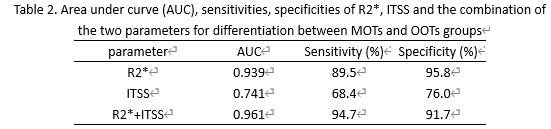
R2*(10.19 ± 3.80 vs.3.22 ±3.10s-1, p < 0.001) and ITSS values (0.19 ± 0.09 vs.0.12 ±0.07, P < 0.005) of the MOTs group was significantly higher than those of the OOTs group. The area under the ROC curve (AUC) for the ROC analyses of R2*, ITSS and the combination of the two parameters for differentiation between MOTs and OOTs groups was 0.939, 0.741 and 0.961, respectively (Table 2).Discussion and Conclusion
Our study indicated that the R2* and ITSS value of MOTs was higher than OOTs. R2* and ITSS is rather sensitive to detect the change of oxygen content and to reflect microhemorrhage and neoangiogenesis. MOTs are more invasive and have higher proliferation rate compared to OOTs, which reduce the oxygen saturation and increase immature angiogenesis of MOTs. The formation of immature neovascularization can decrease blood oxygen content as well as increase intratumoral hemorrhage. 5-7 Above factors lead to an increase of R2* and ITSS values. Moreover, R2* and automatically quantitative ITSS had good performance in differentiating between MOTs and OOTs. The combination of the two parameters improved the differential diagnosis efficiency. Automatically quantitative ITSS and R2* might be a promising imaging biomarker for clinical determination of MOTs.Acknowledgements
No acknowledgement found.References
1. Gotzamanis G, Kocian R, Özbay P. S., et al. In vivo quantification of cerebral r2*-response to graded hyperoxia at 3 tesla. J Clin Imaging Sci. 2015; 5:1.
2. Li Ye, Liu Ailian, Tian Shifeng, et al. The application value of enhanced T2* weighted angiography sequence phase image technology in ovarian endometriotic cysts. Magnetic resonance imaging, 2016;7(7): 501-505.
3. Park, M. J., Kim, H. S., Jahng, G. H., Ryu, C. W., Park, S. M., Kim, S. Y. Semiquantitative assessment of intratumoral susceptibility signals using non-contrast-enhanced high-field high-resolution susceptibility-weighted imaging in patients with gliomas: Comparison with MR perfusion imaging. American Journal of Neuroradiology 2009; 30:1402–1408.
4. Park, S. M., Kim, H. S., Jahng, G. H., et al. Combination of high-resolution susceptibility-weighted imaging and the apparent diffusion coefficient: added value to brain tumour imaging and clinical feasibility of non-contrast MRI at 3T. The British journal of radiology, 2010;83(990): 466–475.
5. Fang Ji, Wen Di, Tumor microenvironment affecting biological behaviour of malignant ovarian neoplasms: an update, J. Int. Obstet. Gyneeol. 2012;39 (4):352–355
6. G.L. Semenza, Hypoxia-inducible factor 1 and cancer pathogenesis, IUBMB Life.2018;60(9): 591–597 7. A. Giatromanolaki, E. Sivridis, M.I. Koukourakis, Tumour angiogenesis: vascular growth and survival, APMIS 2004;112 (7–8): 431–440
Figures