3877
Improved accuracy of differential diagnosis of endometrial carcinoma and endometrial polyp combined with APTw and IVIM MR imaging1Department of Radiology, the First Affiliated Hospital of Dalian Medical University, Dalian, China, 2Philips Healthcare, Beijing, China
Synopsis
Accurate differential diagnosis of endometrial carcinoma (EC) and endometrial polyp (EP) determines the choice of surgical methods. Recent studies have separately applied Amide proton transfer (APT) and Intra-voxel-incoherent-motion (IVIM) imaging in diagnosing female pelvic system diseases including cervical carcinoma (CC) and EC. In this study, we investigated the combination of APTw and IVIM for differential diagnosis of EC and EP. The Results suggested that the combination of APTw and IVIM effectively aids in differentiating EC from EP.
INTRODUCTION
Endometrial carcinoma (EC) is a type of malignancy with an epithelial origin, and endometrial polyp (EP) is a type of benign lesion of the uterus. Intra-voxel-incoherent-motion (IVIM) is a novel technique sensitive to the movement of tissue water molecules and blood perfusion in microcirculation. Amide proton transfer (APT) technology can evaluate the cellular proliferative activity by indirectly measures the intracellular concentration of free proteins and polypeptides[1]. Recent studies have separately applied APTw and IVIM imaging in diagnosing female pelvic system diseases including cervical carcinoma (CC) and EC[1,2]. The combination of both these technologies has also been preliminarily reported in the diagnosis of cervical squamous cell carcinoma[3]. In this study, we demonstrated the feasibility of a combination of APTw with IVIM in the differential diagnosis of EC and EP.METHODS
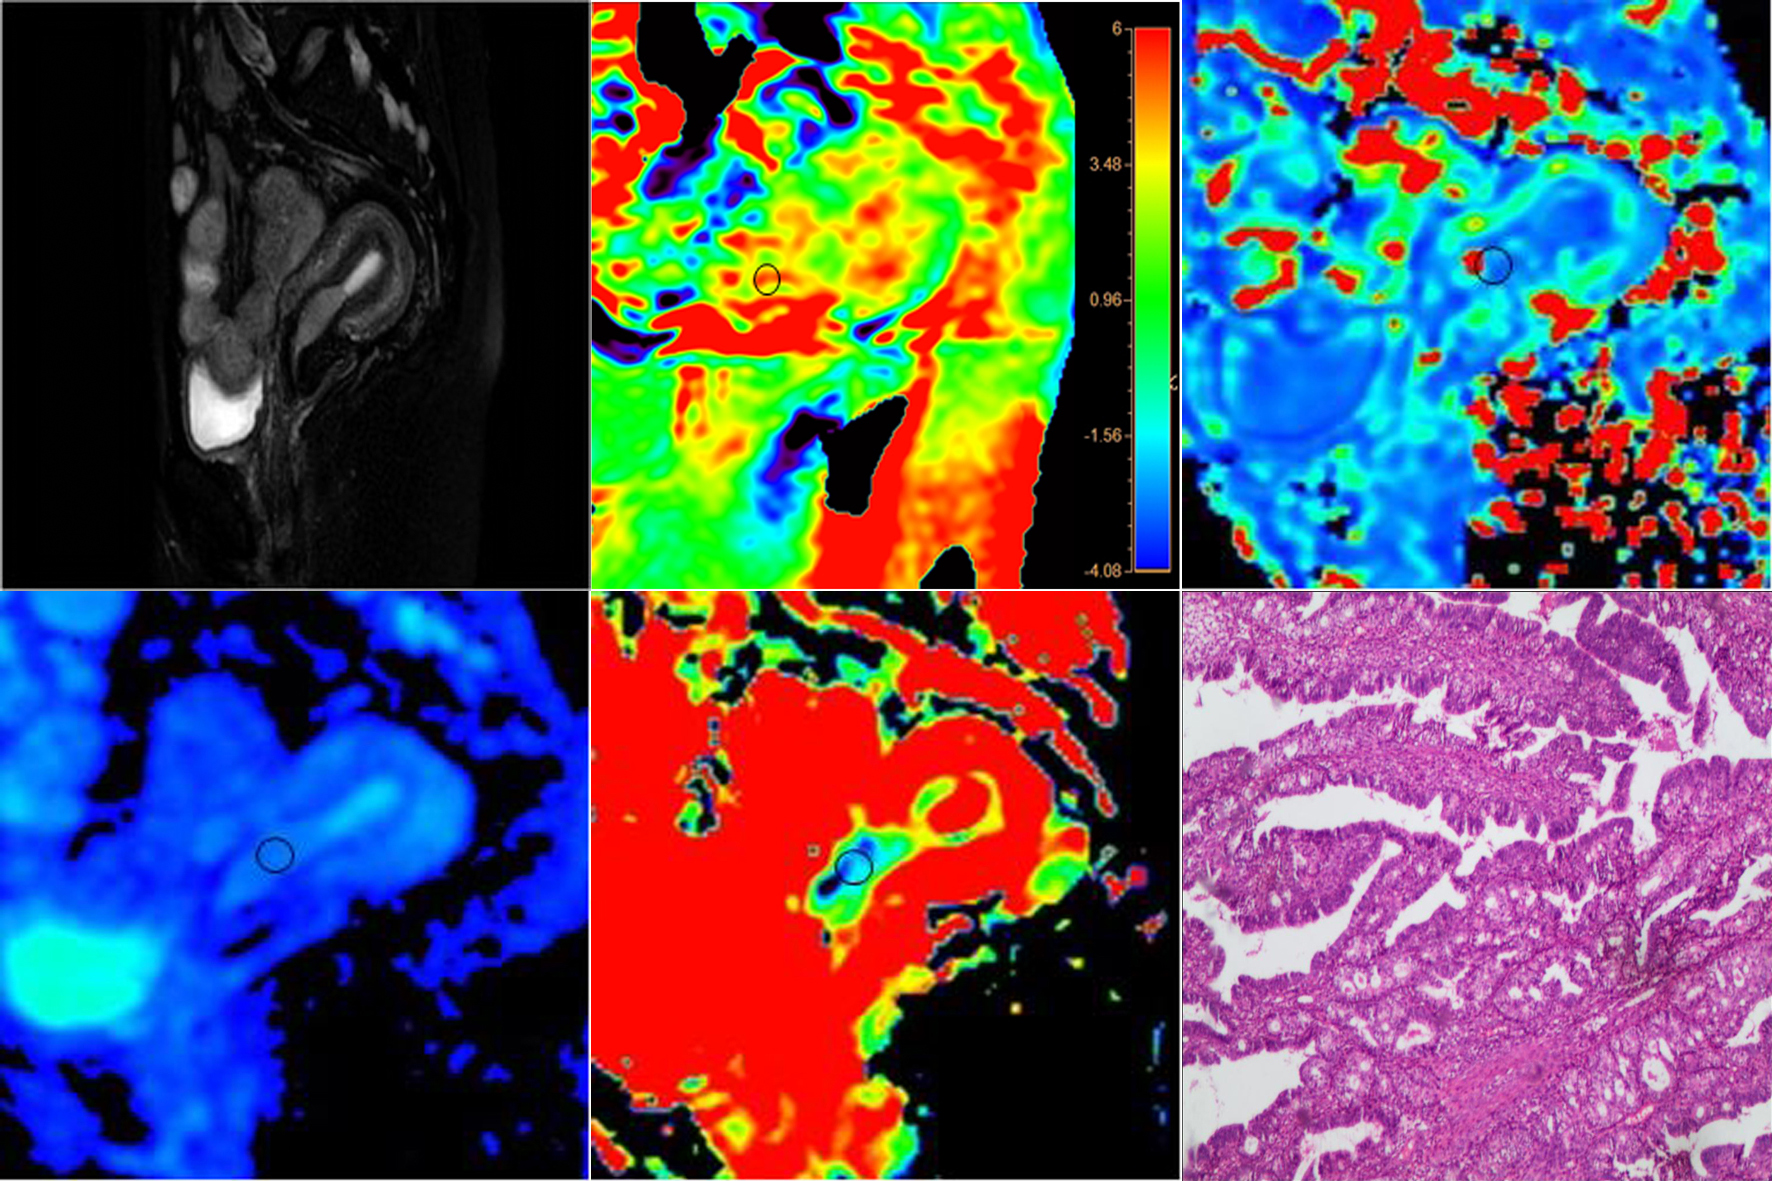
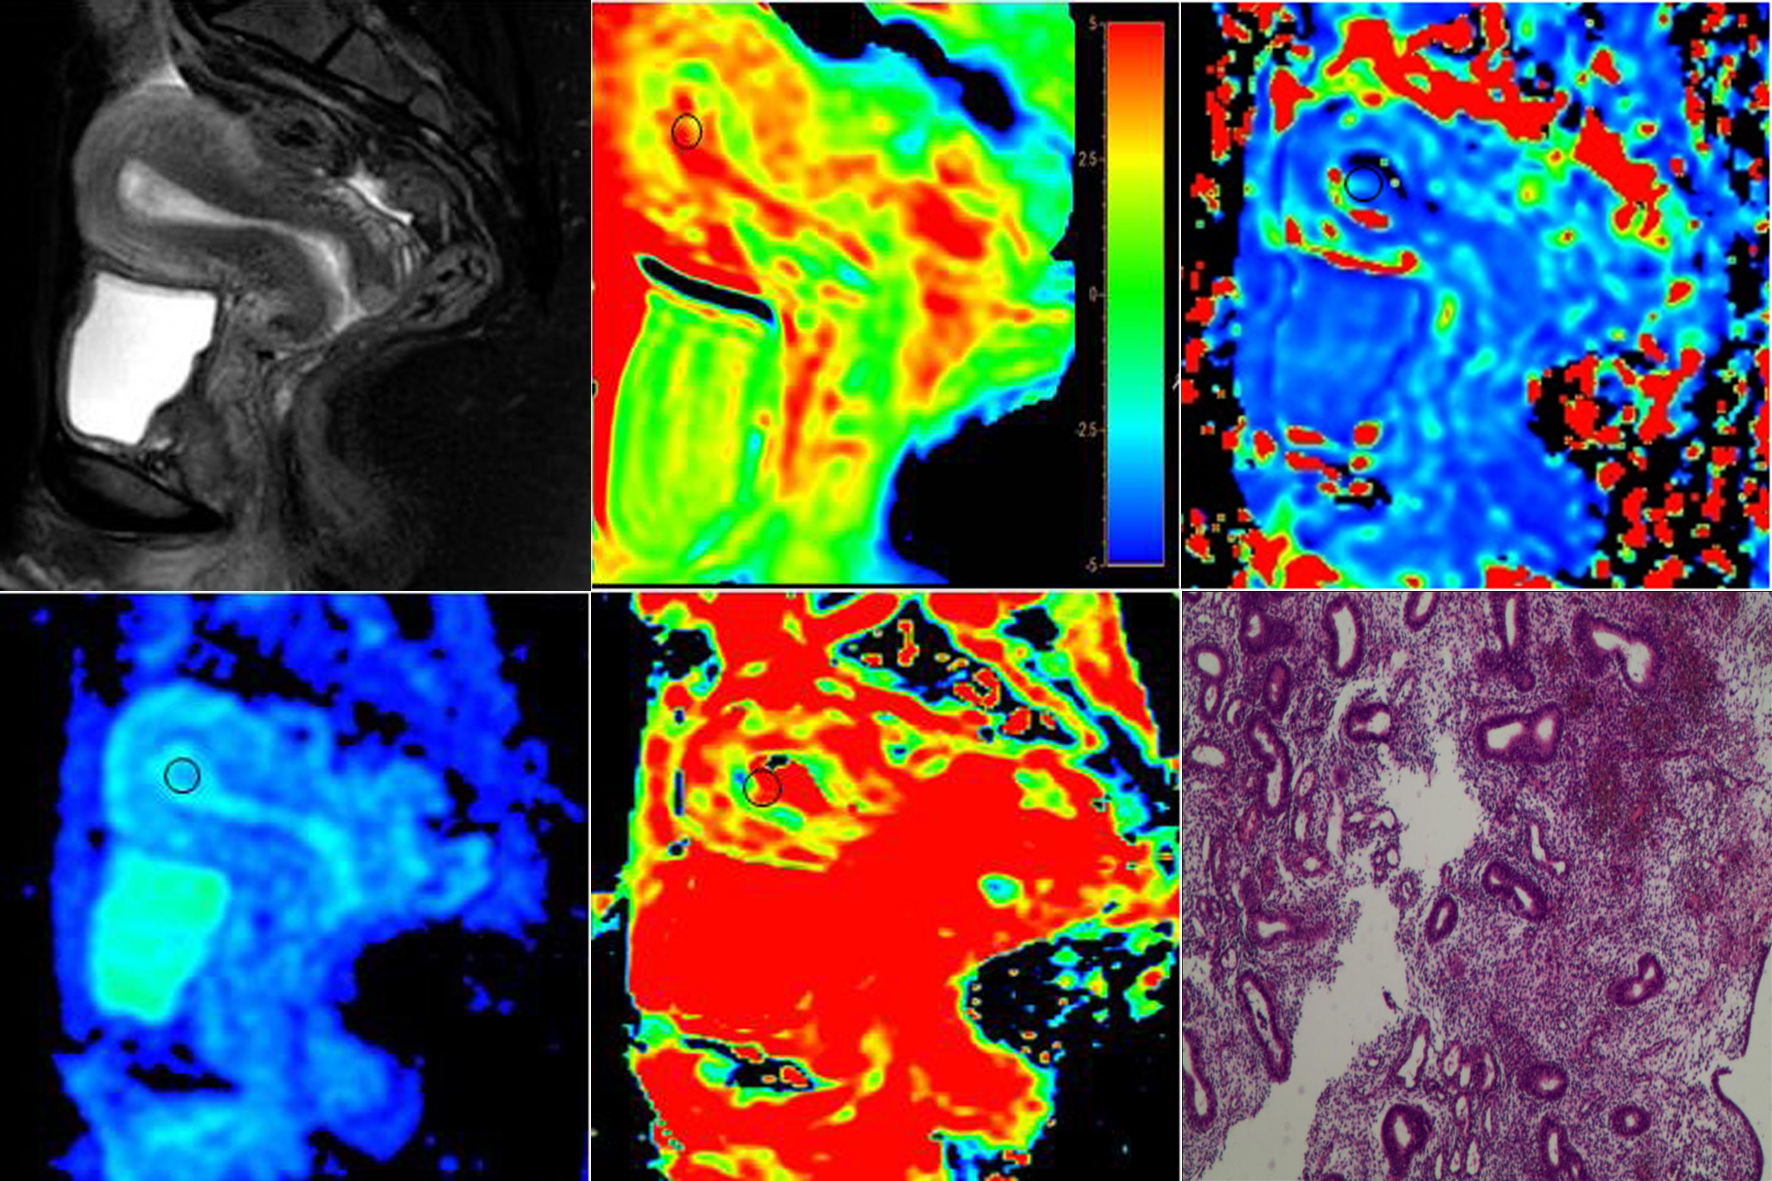
This study was approved by the local IRB. 29 female patients (18 cases with EC and 11 cases with EP) confirmed by surgical resection or biopsy were retrospectively reviewed from May 2019 to December 2020. The mean age of the two groups was 52.3 ± 12.2 and 49.2 ± 8.2years. All the patients underwent a 3.0 T MRI examination including APTw and IVIM (Ingenia CX with a 16-channel abdominal coil; Philips Healthcare, the Netherlands). The IVIM scan included 10 b-values (b= 0, 20, 50, 100, 150, 200, 400, 800, 1200, 2000s/mm2, with the number of averages=1, 1, 1, 1, 1, 1, 1, 3, 4, 5). The pure diffusion coefficient (D), pseudo-diffusion coefficient (D*), perfusion fraction (f), and APTw signal intensity (SI) were measured based on manually placed ROIs independently by two experienced observers (Figure 1 and 2). Mann-Whitney was performed to analyze the differences of each quantitive parameter between the two groups. The receiver operator characteristic (ROC) curve and the area under curve (AUC) were calculated to evaluate the diagnostic performance, and the Delong test was employed to compare the performance of different quantitive parameters.RESULTS
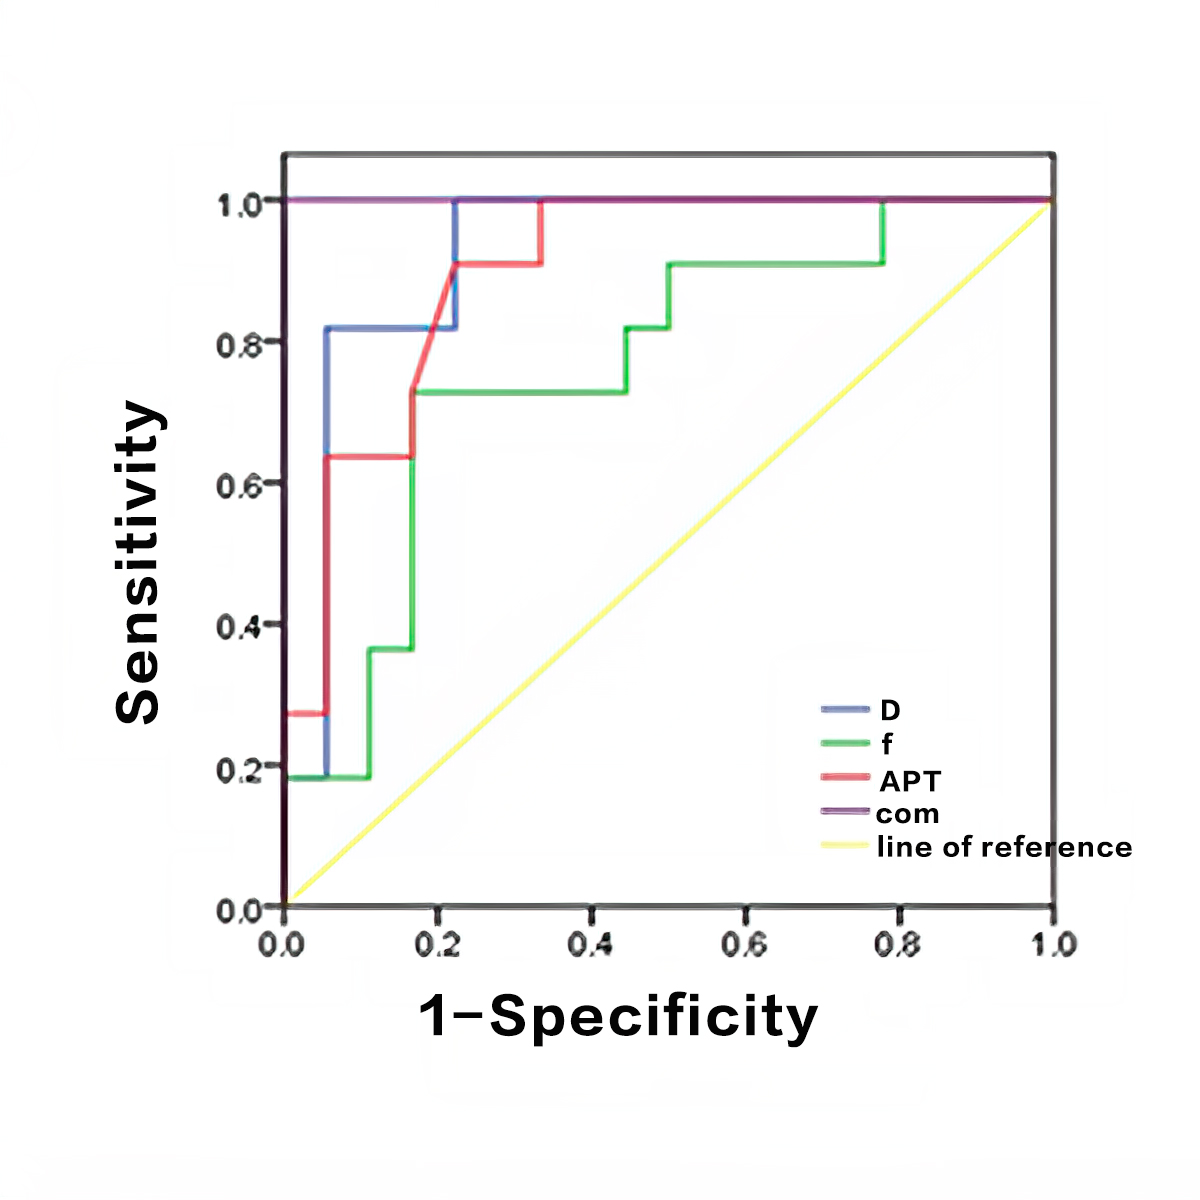
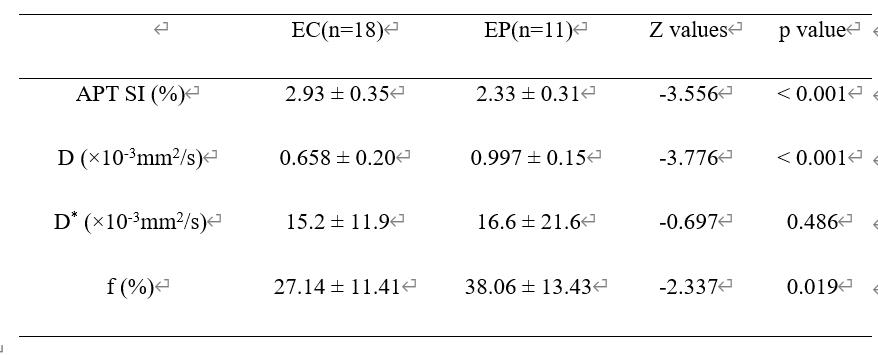
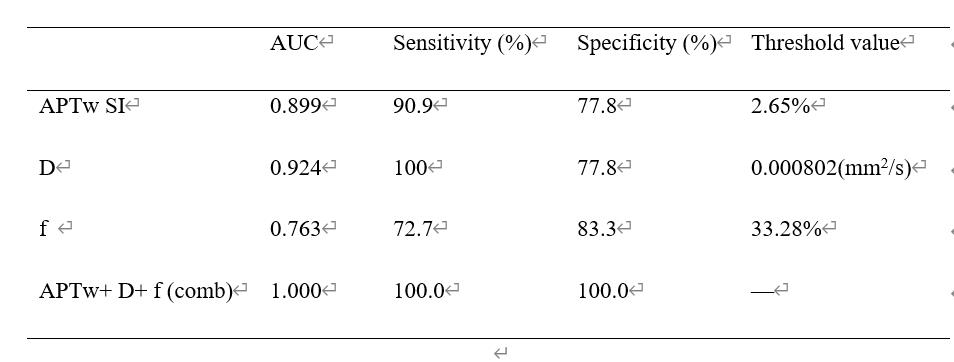
APTw SI of the EC group was significantly higher than that of the EP group (2.93 ± 0.35% vs. 2.33 ± 0.31%, P<0.05). The D and f values of the EC group were significantly lower than that of the EP group (D: 0.658 ± 0.199×10⁻³mm2/s vs. 0.997 ± 0.152×10⁻³mm2/s; and f: 27.14 ± 11.41% vs. 38.06 ± 13.43%), while the D* values did not show a significant difference. Detailed results are shown in Table 1. Only f and APTw showed significant correlation in EP (r=0.623, P=0.04), while other IVIM parameters showed no correlation with APTw (data not shown). The ROC curves were presented in Figure 3. The combination of APTw SI, D, and f achieved the highest sensitivity, specificity, and AUC (detailed information in Table 2). The diagnosis efficiency of the combination of APTw SI, D, and f was statistically better than that of independent use of parameter f (P<0.05). Compared with independent use of parameter APTw SI or D, the diagnosis efficiency of the combination scheme did not show a statistical difference.DISCUSSION AND CONCLUSIONS
Both APTw and IVIM can differentiate EC from EP effectively. This might due to the difference between tissue contents in EC and EP. The combination of APTw and IVIM improves the diagnostic efficiency of EC and EP. Compared with the independent use of parameter APTw SI or D, the combination scheme did not show a statistical difference. This might due to the limited sample size of the high diagnostic efficiency of APTw and D. This study expanded the application of APTw combined with IVIM in functional MR imaging in uterine diseases and provided a new method for clinically noninvasive and quantitative identification of EC and EP, which might be quite helpful in clinical diagnosis, treatment, and prognosis of the diseases.Acknowledgements
No acknowledgement.References
[1] He YL, Li Y, Lin CY, et al. Three-dimensional turbo-spin-echo amide proton transfer-weighted MRI for cervical cancer: A preliminary study. J Magn Reson Imaging. 2019;50(4):1318-1325. doi:10.1002/jmri.26710
[2] Liu J, Wan Y, Wang Z, Qi Y, Qu P, Liu Y. Perfusion and diffusion characteristics of endometrial malignancy based on intravoxel incoherent motion MRI at 3.0 T: comparison with normal endometrium. Acta Radiol. 2016;57(9):1140-1148. doi:10.1177/0284185115618550
[3] Li B, Sun H, Zhang S, Wang X, Guo Q. The utility of APT and IVIM in the diagnosis and differentiation of squamous cell carcinoma of the cervix: A pilot study. Magn Reson Imaging. 2019;63:105-113. doi:10.1016/j.mri.2019.08.020
Figures