3874
A combination analysis of IVIM-DWI biomarkers and T2WI-based texture features for tumor differentiation of cervical squamous cell carcinoma1The First Affiliated Hospital of USTC, Anhui Provincial Cancer Hospital, Hefei, China
Synopsis
The study aimed to explore the diagnostic value of IVIM-DWI and texture analysis on T2WI for the tumor differentiation grade of cervical squamous cell carcinoma. Finally, we carried out a combined analysis of IVIM-DWI and T2WI-based texture analysis for four compared groups, the AUC of these regression model for four comparison was 0.797, 0.954, 0.795, 0.952, respectively; better than each parameters of IVIM-DWI and texture features alone (0.503~0.684, 0.547~0.805, 0.511~0.712, 0.636~0.792, respectively). Thus, the combination of IVIM-DWI biomarkers and texture features based on tumorous heterogeneity could develop a novel predictive paradigm for the formulation of operation or radiation therapy.
Introduction.
Cervical carcinoma, as a malignant tumor in the female reproductive system, has a high incidence in China, and the increasing incidence and trend of younger age lead to a serious threat to health and life 1,2. Importantly, effective diagnosis of preoperative histological differentiation may lead to targeting treatment, outcomes and survival 3,4.Intravoxel incoherent motion diffusion-weighted imaging (IVIM-DWI), as a non-invasive imaging tool, is able to distinguish the diffusion motion of water molecules and the perfusion-related contribution of the microcirculation system 5,6, and may provide more important cues to discover the correlation between radiology and pathology. The fine greyscale changes caused by the heterogeneity of lesions cannot be easily observed by traditional tools but can be measured by quantitative tools such as texture analysis 7. For magnetic resonance imaging (MRI), T2-weighted imaging (T2WI) is highly sensitive to pathological processes because the characterization of the T2 signal allows for the determination of water content, degree of fibrotic change, necrosis, and haemorrhage in the tissue 8.
Therefore, our study aimed to explore the diagnostic value of IVIM-DWI and texture analysis on T2WI for the tumor differentiation grade of cervical squamous cell carcinoma.
Methods.
This retrospective study included a total of 138 patients with pathologically confirmed poor/moderate/well differentiated (71/49/18) who underwent conventional MRI and IVIM-DWI scans. The values of ADC, D, D*, f and 58 T2WI-based texture features (18 histogram features, 24 gray level co-occurrence matrix features, 16 gray level run length matrix features) were obtained. Multiple comparison, correlation and regression analyses were used.Results.
For IVIM-DWI, the ADC, D, D* and f were significantly different among the three groups (p<0.05). ADC, D and D* were positively correlated with pathological differentiation (r=0.262, 0.401, 0.401; p<0.05), while the correlation was negative for f (r= -0.221; p<0.05). The comparison of 52 parameters of texture analysis on T2WI reached statistically significant levels (p<0.05). Multivariate logistic regression analysis incorporated significant IVIM-DWI and texture features on T2WI showed good diagnostic performance both in the four differentiation groups (poorly vs. moderately, area under the curve/AUC=0.797; moderately vs. well, AUC=0.954; poorly vs. moderately& well, AUC=0.795; well vs. moderately&poorly, AUC=0.952). The AUCs of each parameters alone were smaller than that of each regression model (0.503~0.684, 0.547~0.805, 0.511~0.712, 0.636~0.792, respectively; pairwise comparison of ROC curves between regression model and individual variables, p<0.05).Discussion.
The diagnostic performance of IVIM-DWI showed that IVIM-DWI had the ability to investigate microscopic changes in complex biological conditions and is worthy of consolidation and exploration. Texture analysis is an advanced tool to objectively and quantitatively obtain the texture features of the heterogeneity within a lesion by taking into account pixel intensity, spatial location and relationship of pixels in the image 9. In pairwise analysis, we could conclude that the texture features on T2WI helped the differential diagnosis of tumor differentiation grade of cervical squamous cell carcinoma, especially for the well vs. poorly/moderately differentiated groups. The texture features could improve our understanding on the heterogeneity of lesions with tumor differentiation grade 10.Finally, we carried out a combined analysis of IVIM-DWI and T2WI-based texture analysis. We hypothesized four compared groups for regression analysis, and according to the ROC curves, the AUC of these regression model for four comparison was 0.797, 0.954, 0.795, 0.952, respectively; better than each parameters of IVIM-DWI and texture features on T2WI alone (0.503~0.684, 0.547~0.805, 0.511~0.712, 0.636~0.792, respectively). We concluded that the regression models we built could study diffusion, perfusion and tumor heterogeneity information in a comprehensive way.
Since the tumor differentiation grade has an impact on outcomes and survival 4, by using IVIM-DWI and texture analysis on T2WI together, researchers can establish an imaging-based model related to the microcirculation system and tumor heterogeneity, to further acknowledge the disease and make more accurate decisions for treatment strategies.
Conclusion.
IVIM-DWI biomarkers and T2WI-based texture features had potential to evaluate the pathological differentiation of cervical squamous cell carcinoma. The combination of IVIM-DWI with texture analysis improved the predictive performance.Acknowledgements
This work was supported by the projects from the Foundation for Sci & Tech Research Project of Anhui Province, China (1704a0802148). We thank Li-Xiang Zhang and Cui-Ping Li involved in the acquisition of data. We are grateful to all involved patients for their participation to the study.References
1. Balleyguier C, Sala E, Da Cunha T, et al. Staging of uterine cervical cancer with MRI: guidelines of the European Society of Urogenital Radiology. Eur Radiol 2011; 21(5): 1102-1110.
2. Burzawa J, Gonzales M, Frumovitz M. Challenges in the diagnosis and management of cervical neuroendocrine carcinoma. Expert Rev Anticancer Ther 2015; 15(7): 805-810.
3. FIGO Committee on Gynecologic Oncology. FIGO staging for carcinoma of the vulva, cervix, and corpus uteri. Int J Gynaecol Obstet 2014; 125(2): 97-98.
4. Matsuo K, Mandelbaum RS, Machida H, et al. Association of tumor differentiation grade and survival of women with squamous cell carcinoma of the uterine cervix. J Gynecol Oncol 2018; 29(6): e91.
5. Thapa D, Wang P, Wu G, et al. A histogram analysis of diffusion and perfusion features of cervical cancer based on intravoxel incoherent motion magnetic resonance imaging. Magn Reson Imaging 2019; 55: 103-111.
6. Le Bihan D, Breton E, Lallemand D, et al. Separation of diffusion and perfusion in intravoxel incoherent motion MR imaging. Radiology 1988; 168: 497-505.
7. Zhang S, Chiang GC, Magge RS, et al. MRI based texture analysis to classify low grade gliomas into astrocytoma and 1p/19q codeleted oligodendroglioma. Magn Resom Imaging 2019; 57: 254-258.
8. Dushyant VS, Anthony ES. Abdominal Imaging. Saunders, Elsevier Inc 2011: 113.
9. Su CQ, Lu SS, Zhou MD, et al. Combined texture analysis of diffusionweighted imaging with conventional MRI for non-invasive assessment of IDH1 mutation in anaplastic gliomas. Clin Radiol 2019; 74: 154-160.
10. Zwanenburg A, Leger S, Vallières M, et al. Image biomarker standardisation initiative. 2019. https://arxiv.org/pdf/1612.07003.pdf.
Figures
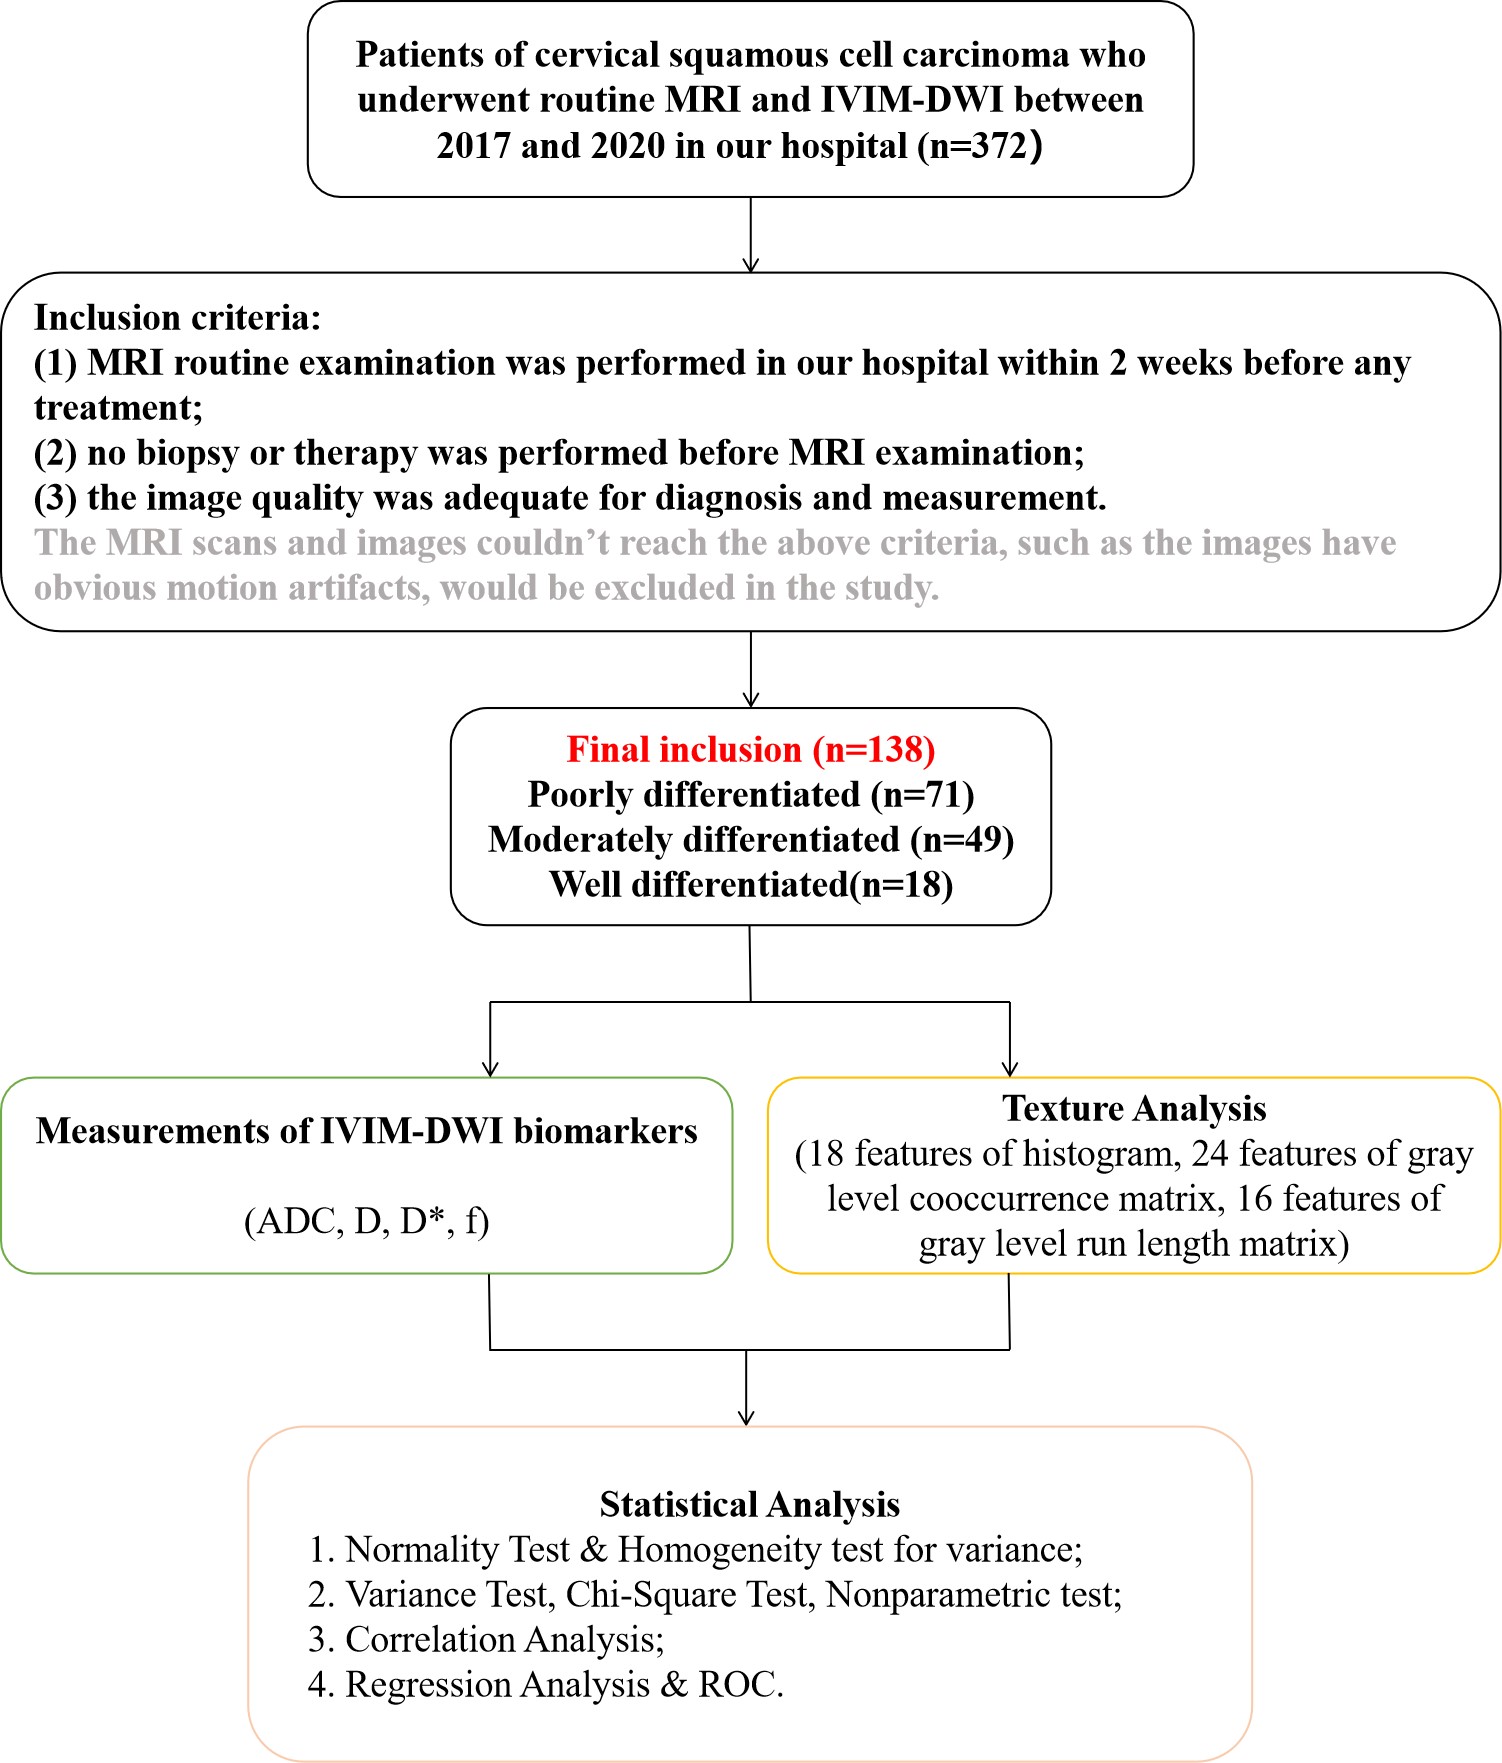
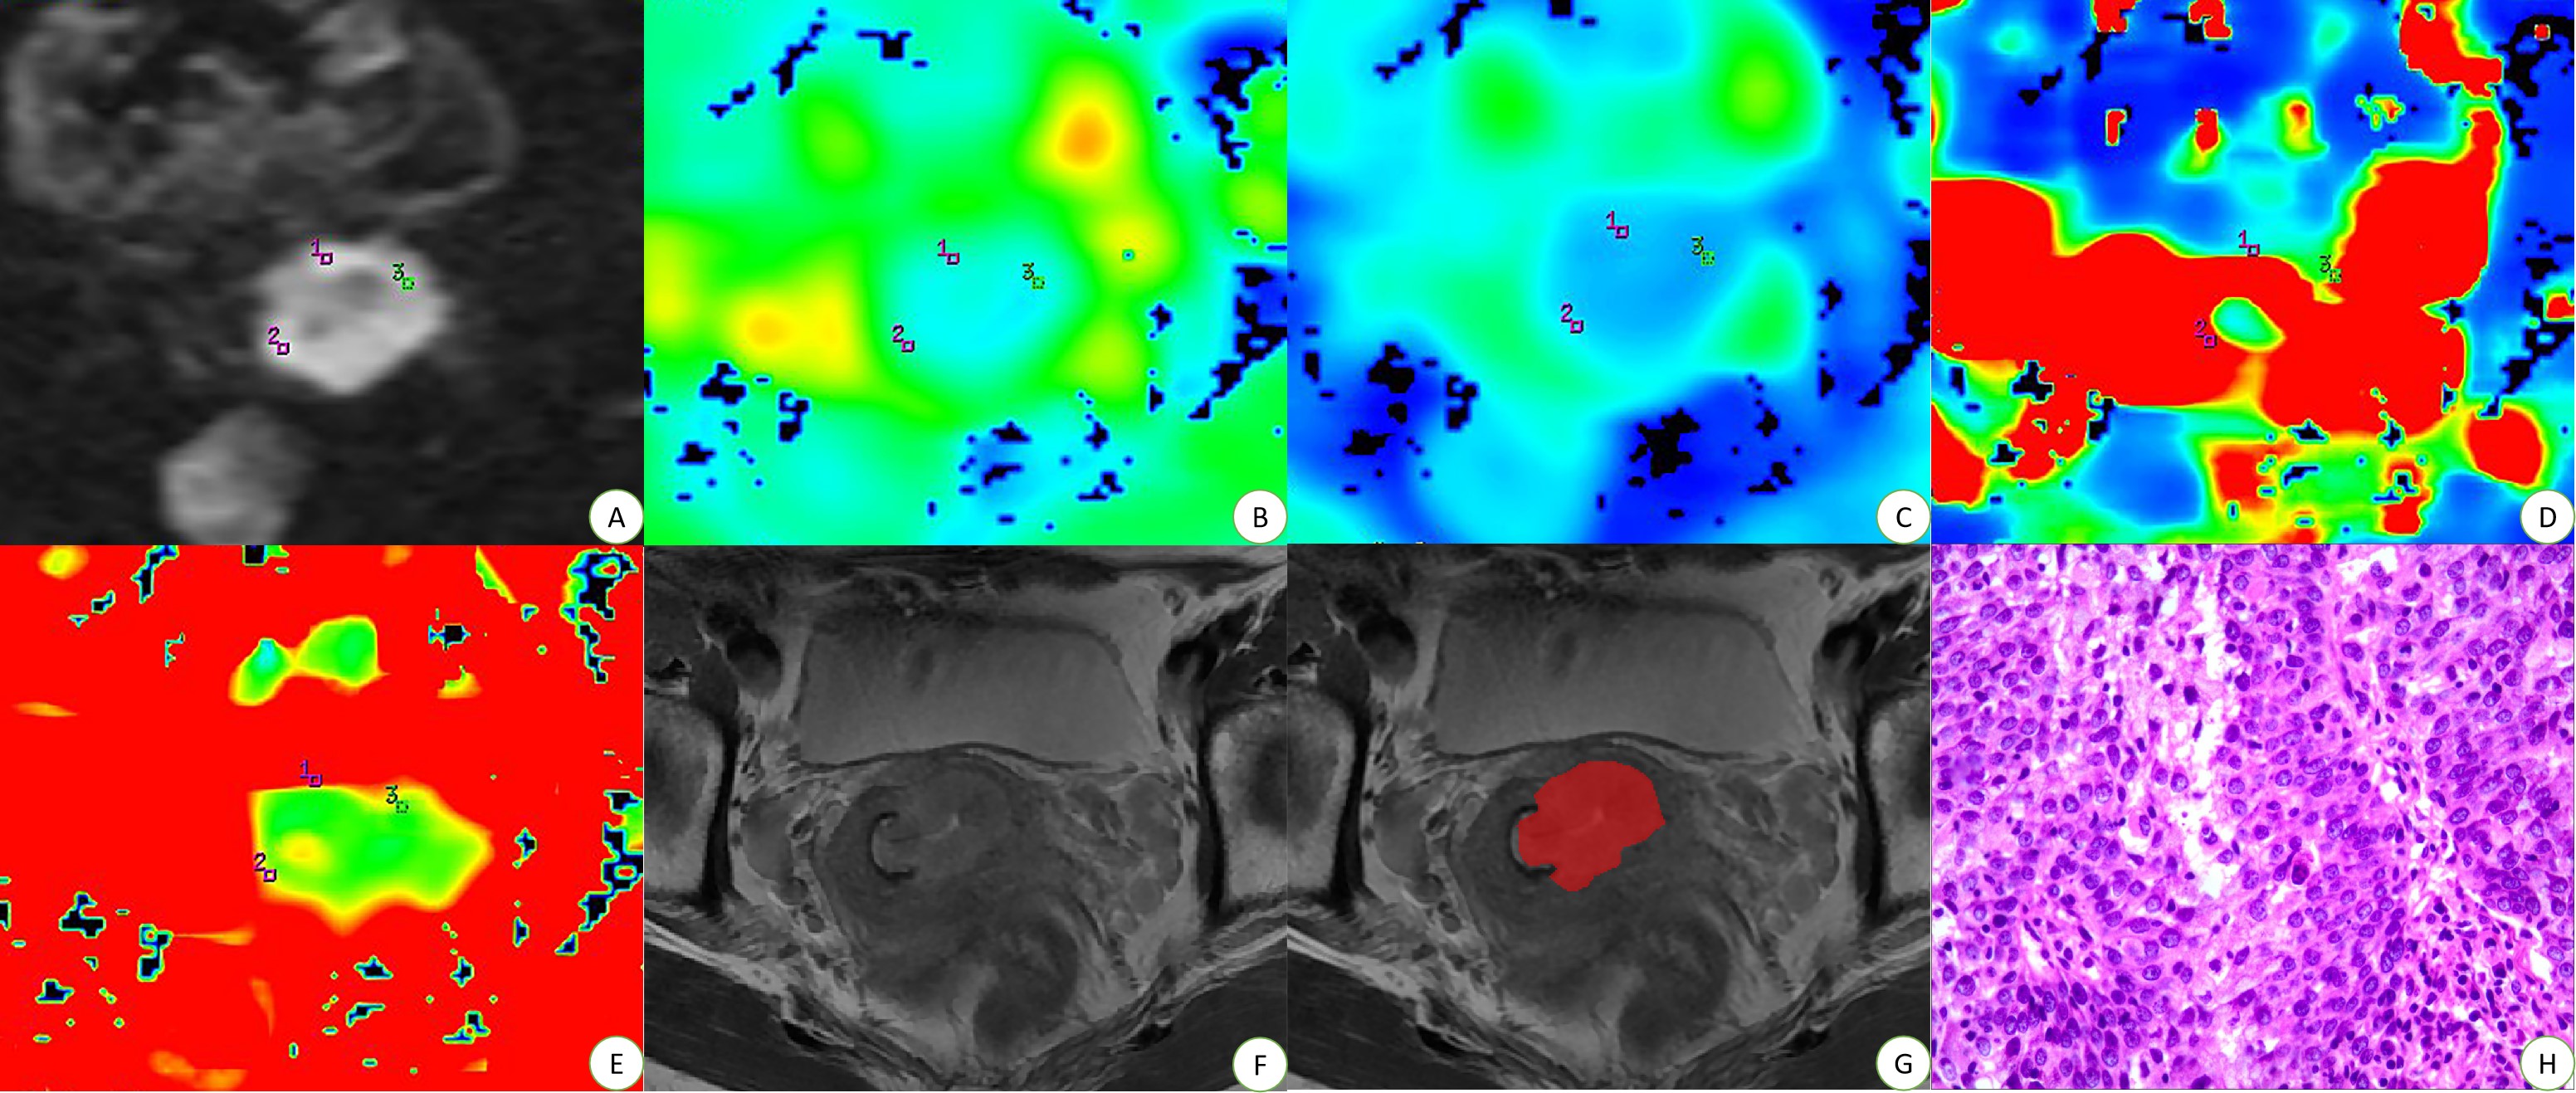
Fig. 2 Examples of Manually Drawing ROIs for Cervical Squamous Cell Carcinoma.
Panels A-H belong to a 50-year-old female with cervical squamous cell carcinoma of well differentiated. On panel A (IVIM-DWI at 1200 s/mm2), each radiologist drew ROI-1 (5mm²) three times to get the values on the maps of ADC, D, D* and f, respectively (panels B-E). Panel F is the maximum area of the lesion on T2WI, so the radiologist drew ROI-2 of the whole lesion on panel G. Panels H is the pathological performance, HE*400.
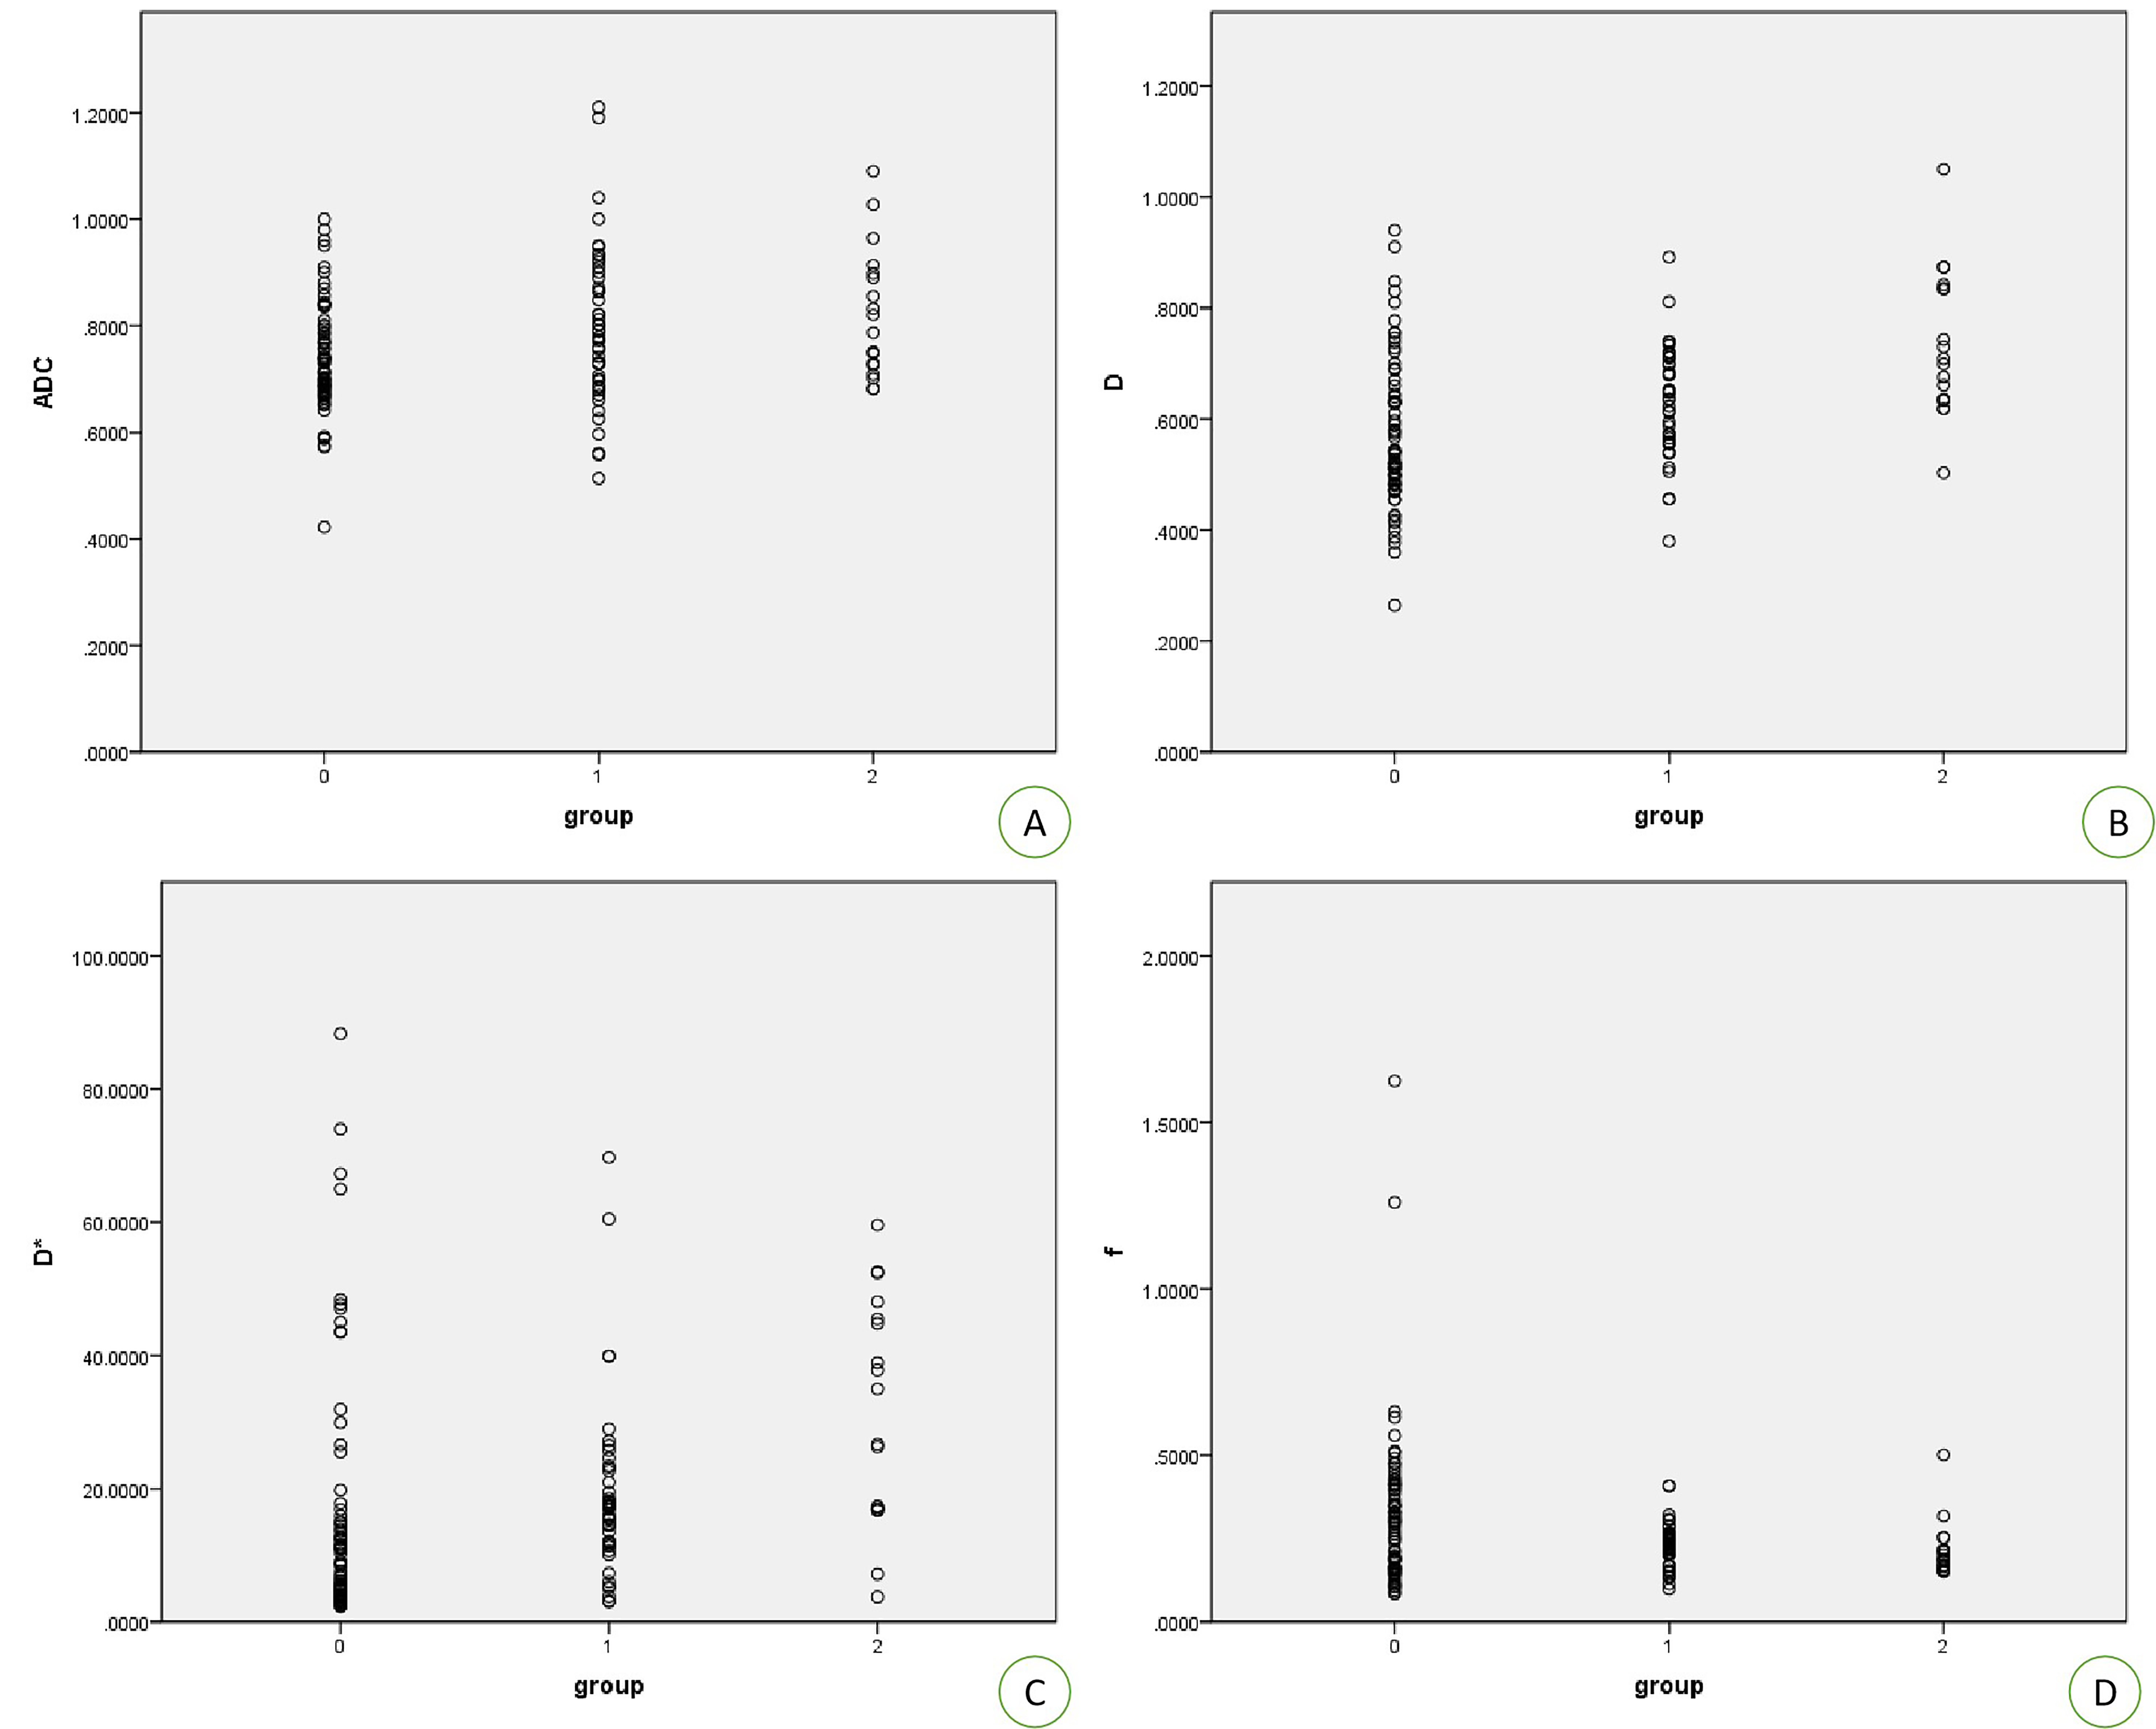
Fig. 3 Correlation Results of IVIM-DWI Based on Degree of Differentiation.
Panels A~D are the tendencies of the correlation between ADC, D, D*, f values and pathological differentiation visualized by scatter diagrams. The labels “0”, “1” and “2” represent the poorly, moderately and well differentiated groups, respectively.
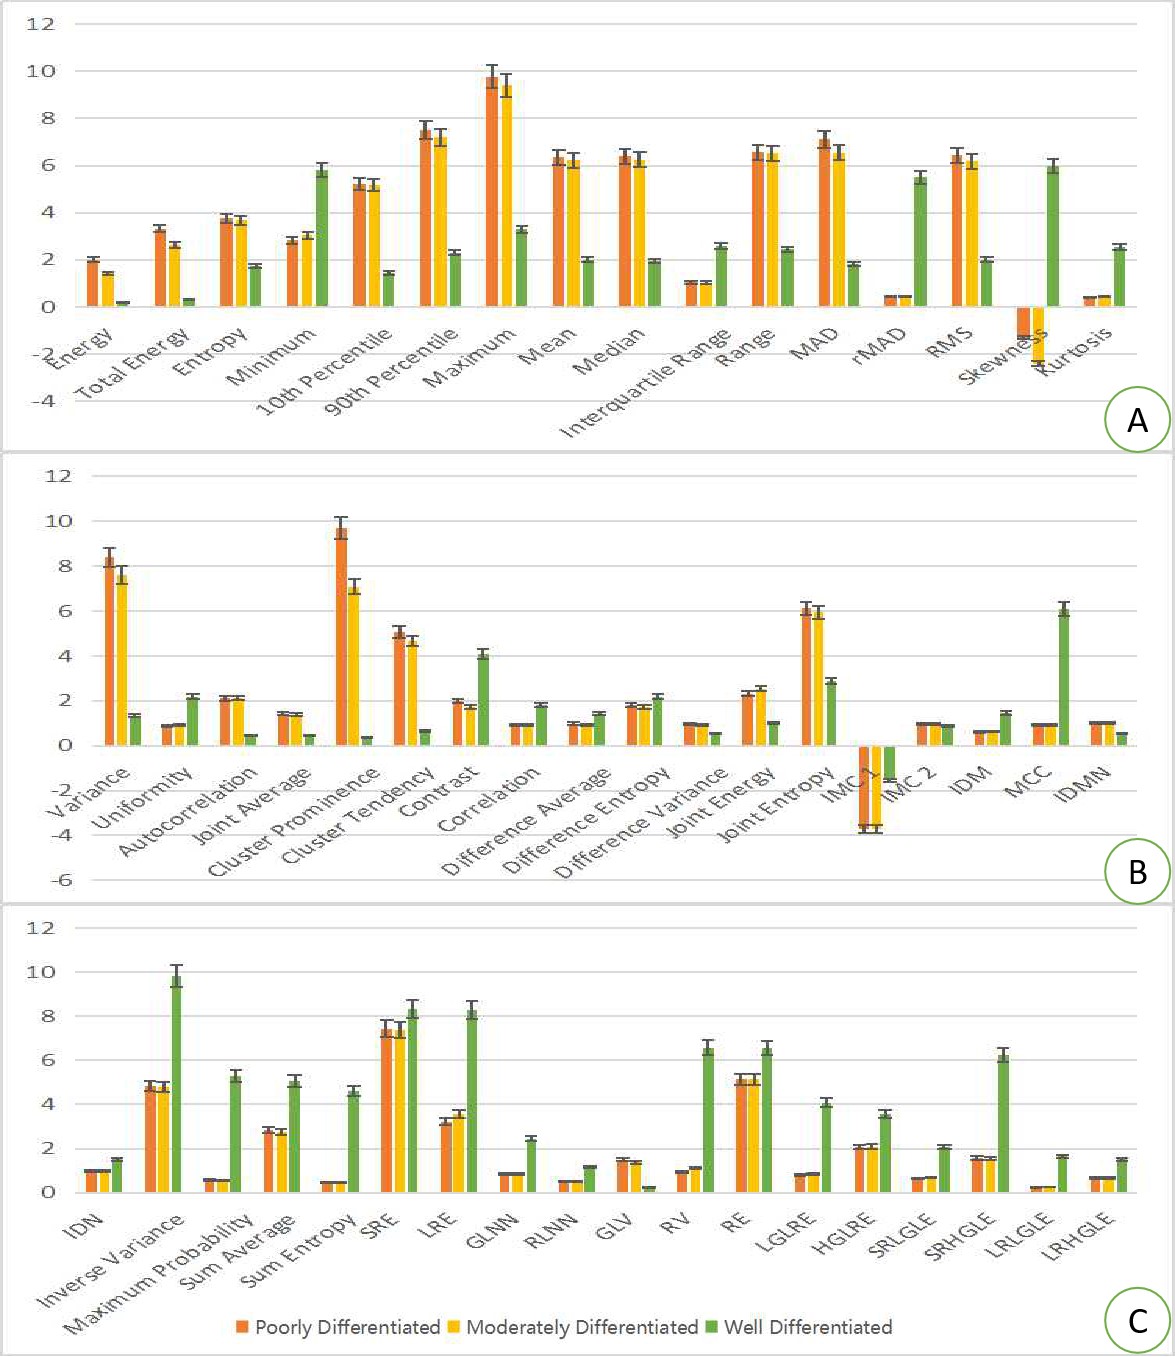
Fig. 4 Statistical Results of Multiple Comparison Analysis of Texture Features on T2WI.
Panels A~C are the column diagrams of significant texture features (p < 0.05). The red, yellow and green column represent the poorly, moderately and well differentiated groups, respectively. The abbreviations are listed in Table 2.
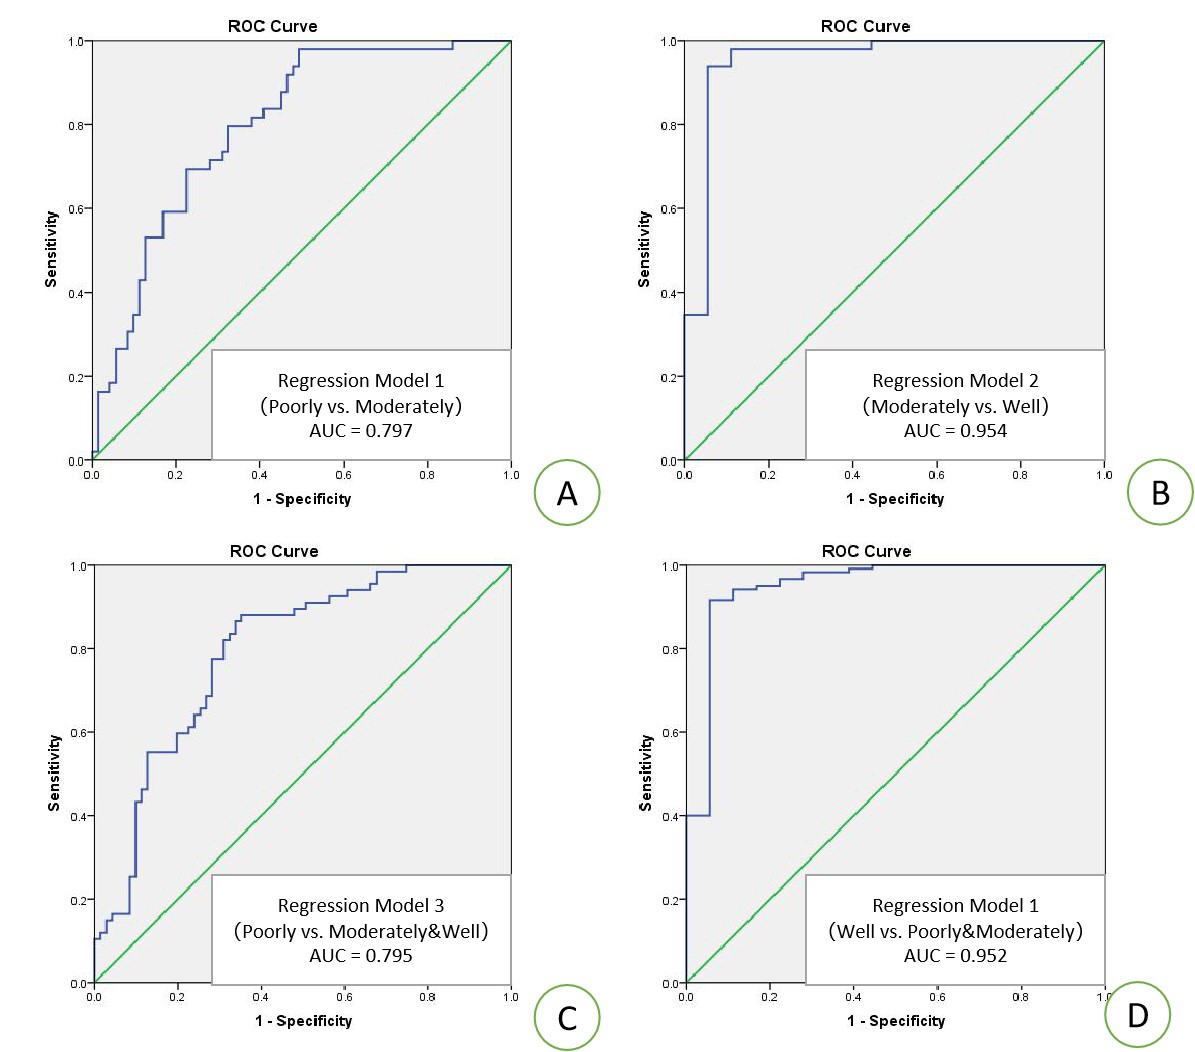
Fig. 5 Statistical Results of ROC Curves.
Panel A is the ROC curve of regression model 1 for the comparison of poorly vs. moderately groups. Panel B is the ROC curve of regression model 2 for the comparison of moderately vs. well groups. Panel C is the ROC curve of regression model 3 for the comparison of poorly vs. moderately&well groups. Panel D is the ROC curve of regression model 4 for the comparison of well vs. moderately&poorly groups.