3872
Quantitative Synthetic T1 and T2 Mapping in the Characterization of Cervical Squamous Cell Carcinoma1The University of Hong Kong, Hong Kong, Hong Kong, 2GE Healthcare, Taipei, Taiwan
Synopsis
T1 and T2 relaxation mapping of tissues could provide valuable information for pathologic characterization but is limited by long scan time and consequently hampered routine clinical integration. This study aimed to investigate the ability of T1 and T2 values derived from synthetic technique dubbed MAGnetic resonance image Compilation (MAGiC) in the characterization of cervical squamous cell carcinoma (SCC). Mean T2 value was significantly higher in FIGO stage III~IV than FIGO stage I~II which demonstrated that T2 value could be a potential imaging biomarker for FIGO staging in SCC.
Introduction
Quantitative maps of T1 and T2 allowing absolute quantification of tissue relaxation times are becoming popular tools that enable clinicians to accurately evaluate disease.1-5 However, conventional quantitative T1 and T2 mappings have not been applied in clinical routine, mainly due to the long acquisition time for separate acquisitions of qualitative and quantitative sequences. Synthetic MRI is a fast imaging technique that allows reconstruction of multiple image contrast and generates quantitative maps within one single scan.6 Previous studies have reported the clinical use of synthetic MRI, especially in brain and breast.1-5,7,8 However, few studies have evaluated its utility in pelvis. The purpose of this study was to investigate the ability of T1 and T2 values derived from synthetic MRI in the characterization of cervical squamous cell carcinoma (SCC), specifically in differentiating FIGO stages and nodal status.Methods
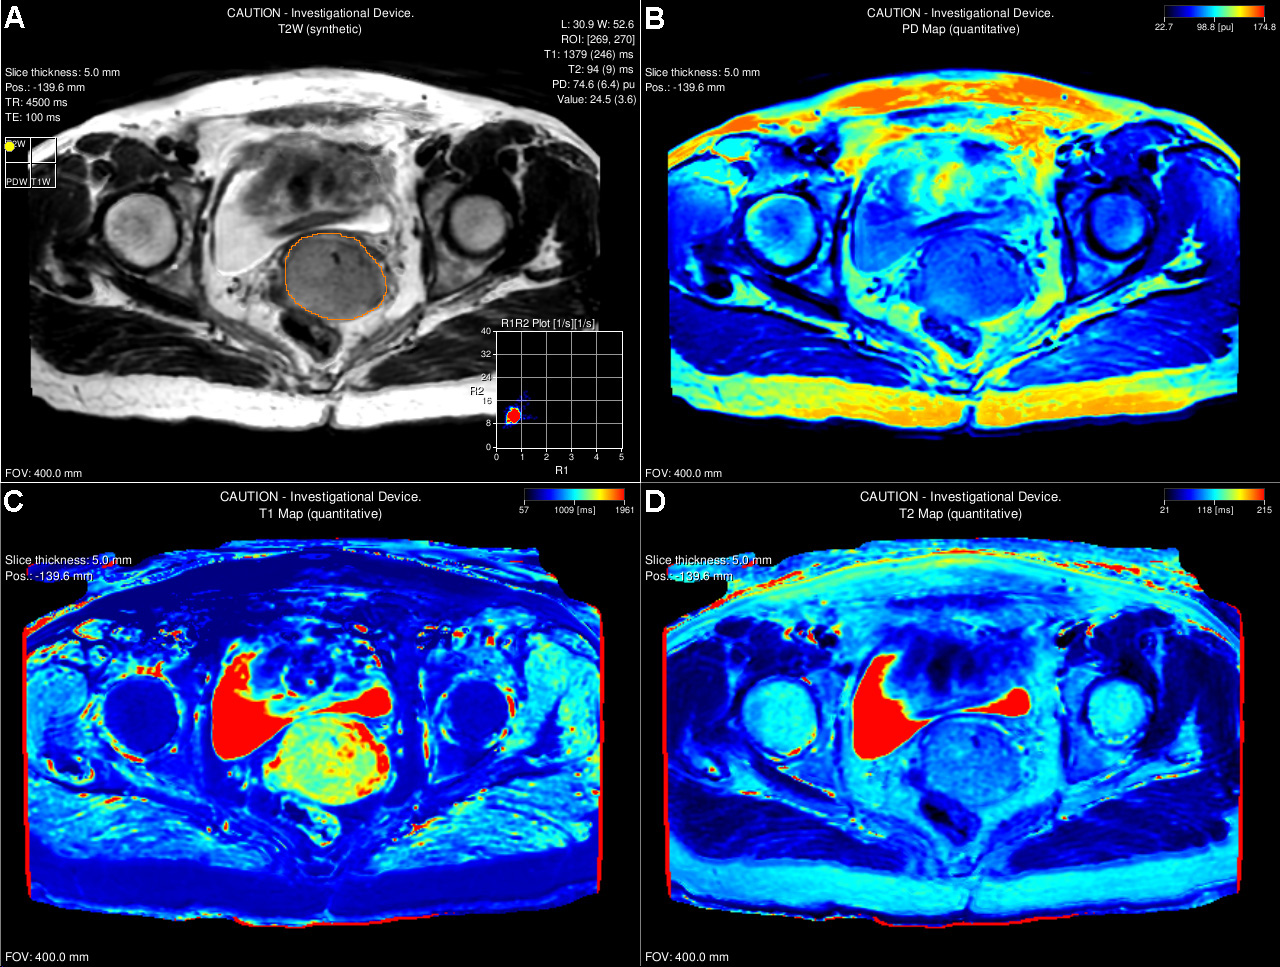
Twenty patients (53.5 ± 15.8 years) with histologically confirmed SCC (FIGO stage IB2~IVB) were prospectively recruited in this study. Baseline routine MRI and synthetic MRI named MAGnetic resonance imaging Compilation (MAGiC) sequence for T1, T2 and proton density (PD) mappings were performed on a 3.0T scanner (SIGNA Premier, GE Healthcare, Milwaukee, WI, USA) using anterior AIR 30-channels array coil and posterior spine 60-channels array coil as the signal detection covering pelvic region and whole-body coil for radio-frequency excitation. MAGiC was acquired using a 2D fast-spin echo based multi-saturation-delay multi-echo with the following parameters: FOV = 400 x 400 mm; matrix = 256 x 256; slice thickness = 5 mm; 20 slices. Largest single-slice region of interest (ROI) was manually contoured the border of tumor on synthetic T2-weighted images for each patient. Mean T1 and T2 values were calculated using MAGiC software on a 64-bit Advantage Workstation (Figure 1). Mann-Whitey U test was used for comparing the differences in T1 and T2 values between dichotomised FIGO stages (FIGO I~II vs. III~IV) and nodal status (positive vs. negative).Results
Mean T2 value was significantly higher in FIGO stage III~IV than FIGO stage I~II (85 ± 8 msec vs. 77 ± 4 msec, P = 0.014), while was not significantly different between nodal status. No difference was observed in mean T1 value between FIGO stages or nodal status in SCC (P > 0.05).Discussion
Mean T2 value could differentiate FIGO stages in SCC, with higher T2 value in high FIGO stages than low FIGO stages. T2 value largely reflects the interaction of water content and the extracellular matrix at molecular level.9 In our study, higher T2 value was observed in high FIGO stage, it might be due to the liquefactive necrosis within in the advanced tumors which was not able to be excluded from the ROIs contributed to a higher T2 value.10 Although mean T2 value was slightly higher in positive nodal status than negative status, the difference was not significant. In addition, mean T1 value showed no difference between FIGO stages or nodal status, suggesting that T1 value might be less sensitive compared to T2 value to detect the biologic variations in SCC.Conclusion
Mean T2 value derived from quantitative synthetic MRI has potential in differentiating FIGO stages of cervical SCC, with higher T2 value in high FIGO stages than low FIGO stages.Acknowledgements
NAReferences
1. Krauss W, Gunnarsson M, Nilsson M, Thunberg P. Conventional and synthetic MRI in multiple sclerosis: a comparative study. European radiology 2018;28(4):1692-1700.
2. Matsuda M, Tsuda T, Ebihara R, et al. Enhanced Masses on Contrast-Enhanced Breast: Differentiation Using a Combination of Dynamic Contrast-Enhanced MRI and Quantitative Evaluation with Synthetic MRI. J Magn Reson Imaging 2020.
3. Matsuda M, Kido T, Tsuda T, et al. Utility of synthetic MRI in predicting the Ki-67 status of oestrogen receptor-positive breast cancer: a feasibility study. Clin Radiol 2020;75(5):398.e391-398.e398.
4. Gao W, Zhang S, Guo J, et al. Investigation of Synthetic Relaxometry and Diffusion Measures in the Differentiation of Benign and Malignant Breast Lesions as Compared to BI-RADS. J Magn Reson Imaging 2020.
5. Jung Y, Gho SM, Back SN, Ha T, Kang DK, Kim TH. The feasibility of synthetic MRI in breast cancer patients: comparison of T(2) relaxation time with multiecho spin echo T(2) mapping method. The British journal of radiology 2018;92(1093):20180479.
6. Warntjes JB, Leinhard OD, West J, Lundberg P. Rapid magnetic resonance quantification on the brain: Optimization for clinical usage. Magn Reson Med 2008;60(2):320-329.
7. Ryu KH, Baek HJ, Moon JI, et al. Initial clinical experience of synthetic MRI as a routine neuroimaging protocol in daily practice: A single-center study. J Neuroradiol 2020;47(2):151-160.
8. Tanenbaum LN, Tsiouris AJ, Johnson AN, et al. Synthetic MRI for Clinical Neuroimaging: Results of the Magnetic Resonance Image Compilation (MAGiC) Prospective, Multicenter, Multireader Trial. AJNR Am J Neuroradiol 2017;38(6):1103-1110.
9. Nishioka H, Hirose J, Nakamura E, et al. T1ρ and T2 mapping reveal the in vivo extracellular matrix of articular cartilage. J Magn Reson Imaging 2012;35(1):147-155.
10. Sala E, Rockall A, Rangarajan D, Kubik-Huch RA. The role of dynamic contrast-enhanced and diffusion weighted magnetic resonance imaging in the female pelvis. European journal of radiology 2010;76(3):367-385.
Figures