3871
Grading of Cervical Cancer by Quantitative Maps from Synthetic MRI1The Second Hospital of Shanxi Medical School, Taiyuan, China, 2GE Healthcare, Beijing, China, 3GE Healthcare, MR Research China, Beijing, China
Synopsis
Cervical cancer remains the most common gynecological cancers. Histological subtype and grade of differentiation determines the course of the disease, the therapeutic outcome and survival of patient. Low-grade cervical cancers are associated with more favorable outcomes and lower tumor recurrence rates when compared to the high-grade cervical cancers.The multiple quantitative maps derived from synthetic magnetic resonance imaging (MRI) might have potential applications in describing the characteristics of cervical cancer.
Introduction
Cervical cancer remains the most common gynecological cancers [1]. Histological subtype and grade of differentiation determines the course of the disease, the therapeutic outcome and survival of patient. Low-grade cervical cancers are associated with more favorable outcomes and lower tumor recurrence rates when compared to the high-grade cervical cancers [2].The multiple quantitative maps derived from synthetic magnetic resonance imaging (MRI) might have potential applications in describing the characteristics of cervical cancer [3]. The aim of this study is to investigate the feasibility of quantitative longitudinal relaxation time (T1), transverse relaxation time (T2), and proton density (PD) maps derived from synthetic magnetic resonance imaging (MRI) for determining level of differentiation in cervical cancer.Methods
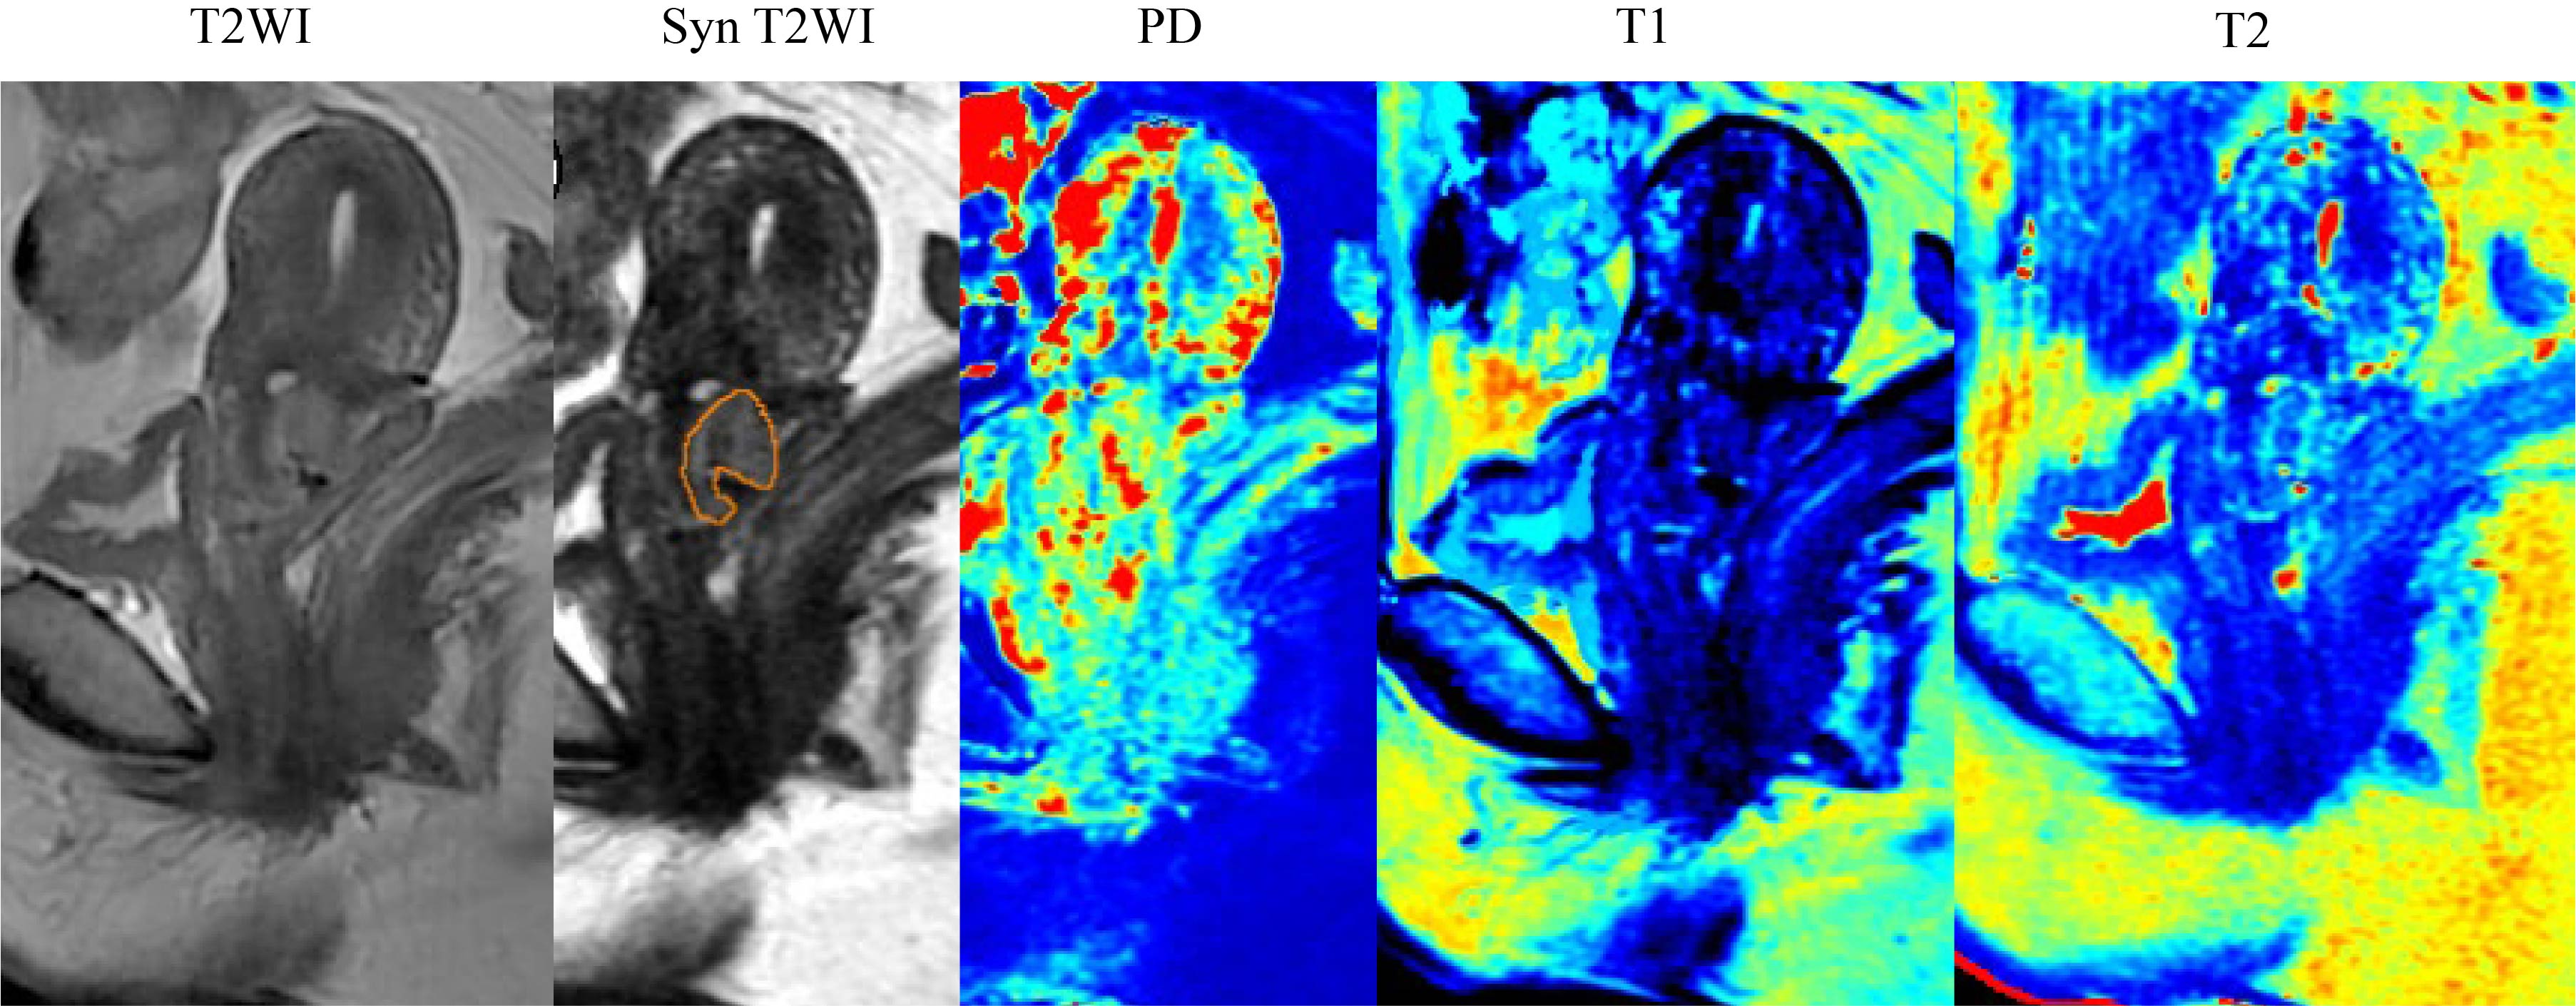
A total of 73 patients with pathologically confirmed cervical cancer underwent pretreatment synthetic MRI [multiecho acquisition of a saturation-recovery using turbo spin-echo readout (QRAPMASTER)], and T1, T2, and PD maps were obtained. Region of interests (ROI) were placed on the lesion and T1 - relaxation time, T2 - relaxation time, and PD were obtained (Fig. 1) and analyzed for differences based on tumor histology differentiation (24 poorly vs. 49 well/moderately differentiated). Receiver operating characteristic curve analysis was applied to determine the diagnostic efficacy.Results
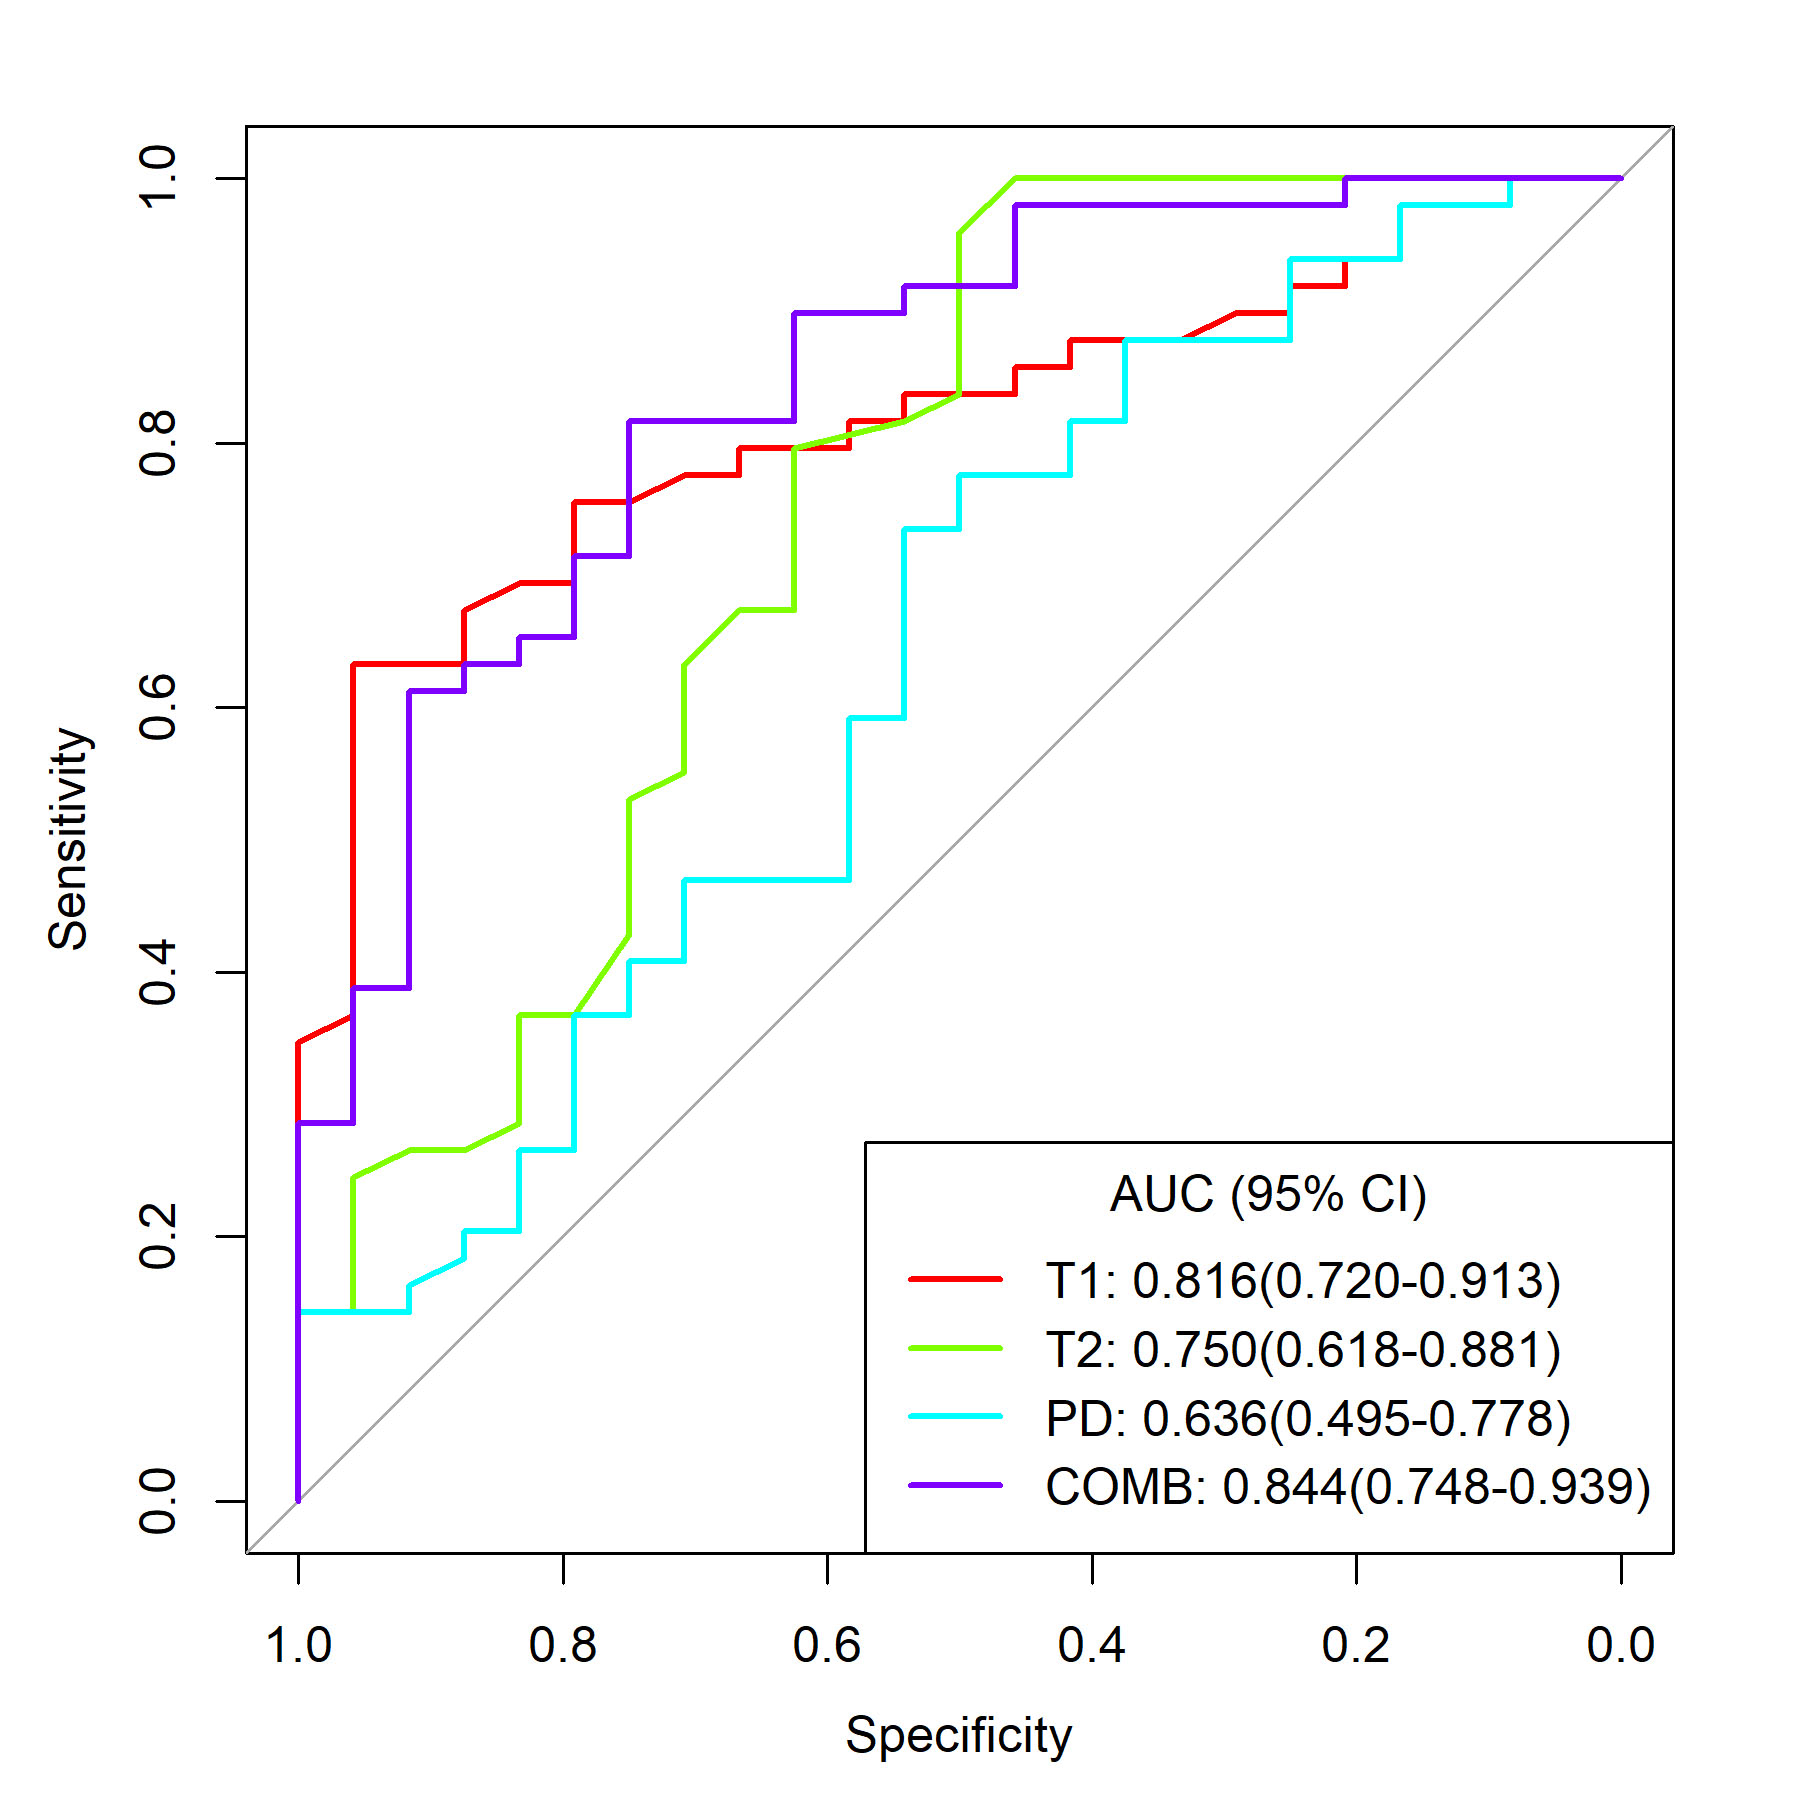
Significant shorter T1 - and T2 - relaxation time were detected in the poorly differentiated than those in well/moderately differentiated cervical cancer (all P < 0.001). In term of discriminating poorly from well/moderately differentiated cervical cancer, a combination of T1- and T2 -relaxation times was shown to have the higher AUC of 0.844 than those of T1- and T2-relaxation time in differentiating poorly from well/moderately cervical cancer (AUC = 0.816, P = 0.3328; AUC = 0.750, P = 0.0355, respectively) (Fig.2).Discussion
The significant shorter T1 and T2 -relaxation times were observed in poorly differentiated cervical cancer. Moreover, a combination of T1- and T2-relaxation times improve the performance for charactering differentiation level of cervical cancer. However, no significant difference was found in PD. This finding reflects that T1- and T2-relaxation times could offer a useful measurement to differentiate poorly from well/moderately differentiated cervical cancer.Conclusion
T1 and T2 parametric maps offered by synthetic MR may be noninvasive and effective markers to identify the pathological grade of cervical cancer.Acknowledgements
No acknowledgementsReferences
1 Marth C, Landoni F, Mahner S, McCormack M, Gonzalez-Martin A, Colombo N (2018) Cervical cancer: ESMO Clinical Practice Guidelines for diagnosis, treatment and follow-up. Ann Oncol 29:iv262
2 Heatley MK (1999) Systematic review and meta-analysis in anatomic pathology: the value of nuclear DNA content in predicting progression in low grade CIN, the significance of the histological subtype on prognosis in cervical carcinoma. Histol Histopathol 14:203-215
Figures