3869
Fat fraction and T2* evaluation of the Infrapatellar Fat Pad in Varying Degrees of Knee Osteoarthritis1The Third Affiliated Hospital, Southern Medical University, Guangzhou, China, 2China International Center, Philips Healthcare, Guangzhou, China
Synopsis
Knee osteoarthritis (KOA) is characterized by pain and limitation in the range of knee joint motion with resultant disability in a substantial proportion of elderly subjects, and infrapatellar fat pad (IPFP) alterations play an important role in the progress of KOA(1,2). IPFP damage causes a direct change in the proportion of fat in the tissue to water and could be evaluated by magnetic resonance imaging (MRI)(3,4). Fat fraction (FF) and the T2* relaxation time can detect the water and fat changes in IPFP. In this study, IPFP was quantitatively estimated by FF and T2* using modified DIXON (mDIXON) technique.
Purpose
The purpose of our study was to determine if FF and T2* can detect changes in IPFP and correlate with the severity of arthritis.Materials and Methods
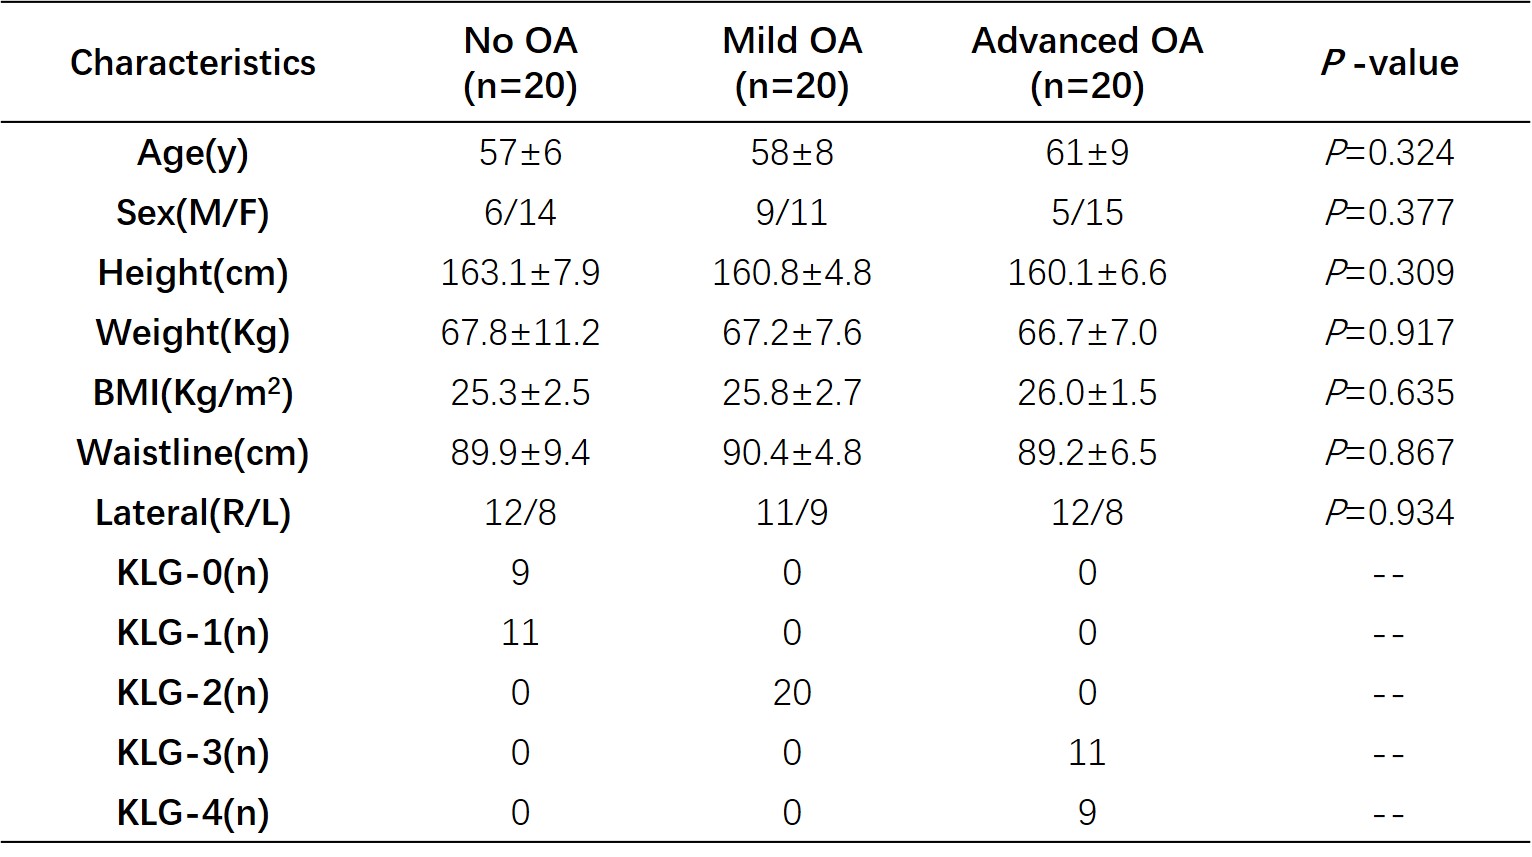
Study CohortThe study protocol was approved by the institutional review board of our institution. The requirement for written informed consent was waived because of the retrospective study design and the anonymity of the data. Between May and September 2020, 60 volunteers (age range 51-70 years old, 20 males, 40 females) participate in this prospective study. X-ray and MR examinations of the knee joint were performed on the same day. The subjects were divided into three groups according to Kellgren-Lawrence grading (KLG): no OA (KLG 0-1), mild OA (KLG 2), advanced OA (KLG 3-4). We matched the age, BMI, and gender of the study subjects between different groups, and obtained the subjects without inter-group differences. 20 subjects were involved in each group.
MRI Parameters and Processing
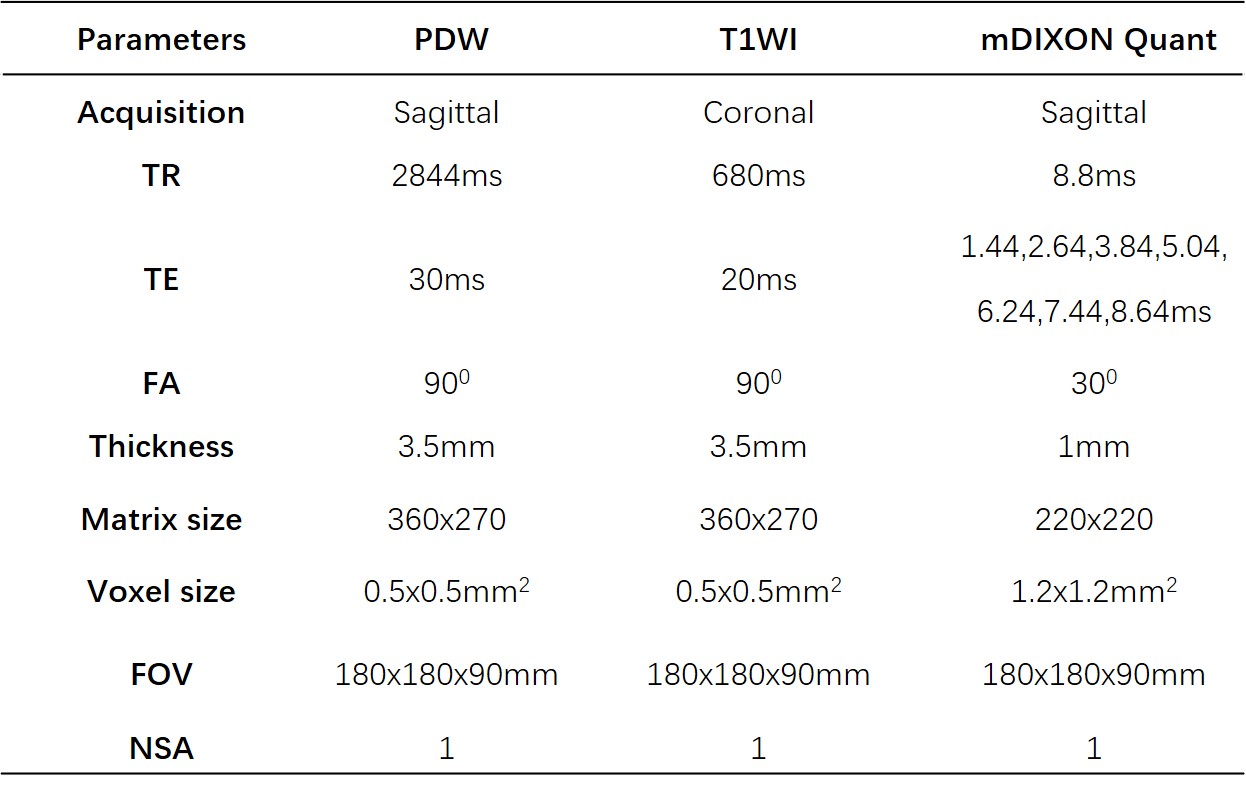
MR imaging of the knee was performed on a 3.0-T MR system (Philips, Achieva, The Netherlands) using an 8-channel knee coil. All subjects were examined in the supine position. Conventional T1WI and PDW-SPAIR sequences were first obtained for anatomical and morphological assessments of the knee joint. mDixon Quant sequence was used to quantify the changes in IPFP. Table 1 shows the scanning parameters for different sequences. All images were transferred to a postprocessing workstation (InterlliSpace™ Portal, Philips), and the fat fraction and T2* relaxation time were evaluated.
Results
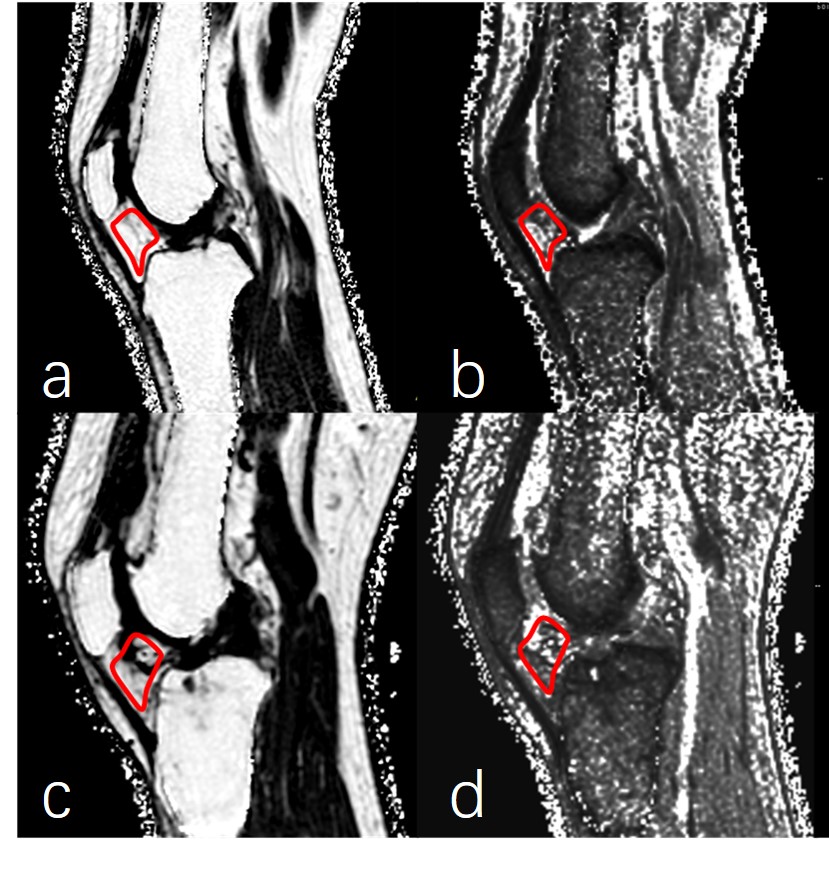
Table 2 shows the demographic and clinical characteristics of all the subjects. There were no statistically significant differences in age, sex, and basic physical factors among the groups.Figure 1 shows the measurements of FF and T2* for two representative cases of varying OA severity.
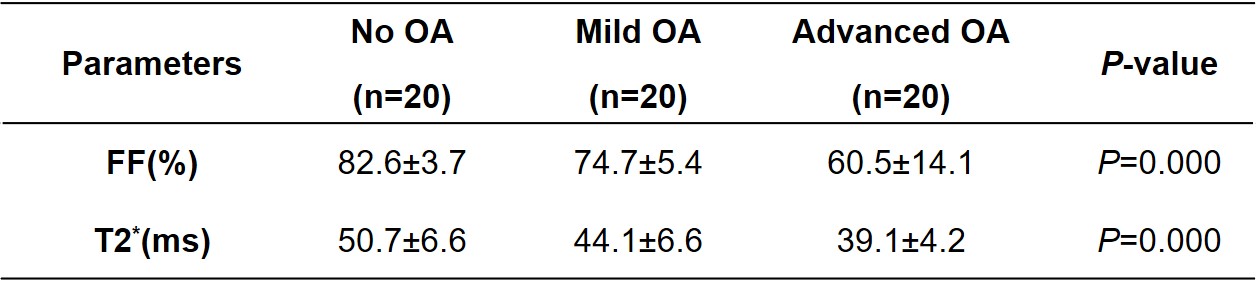
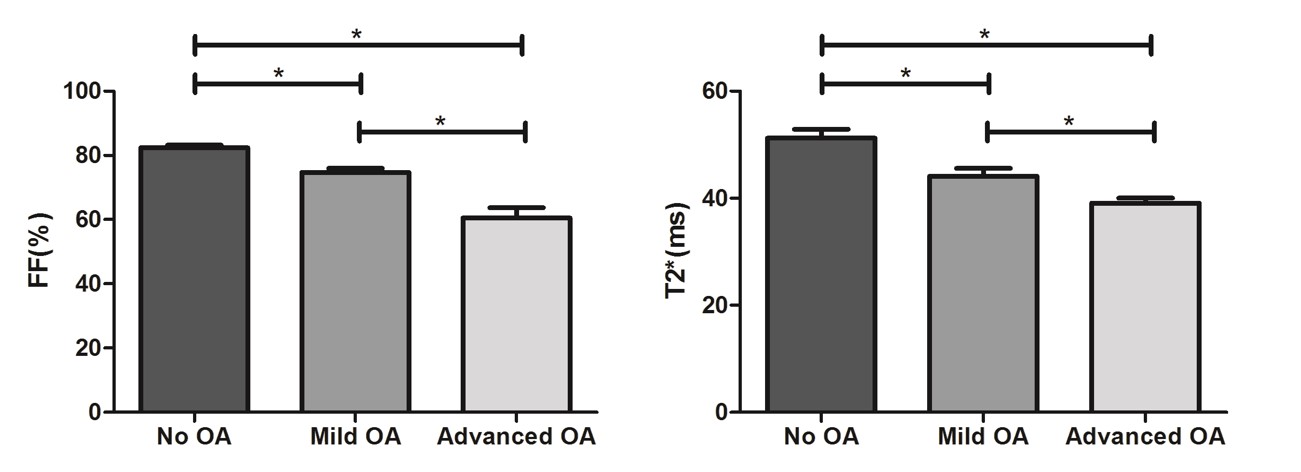
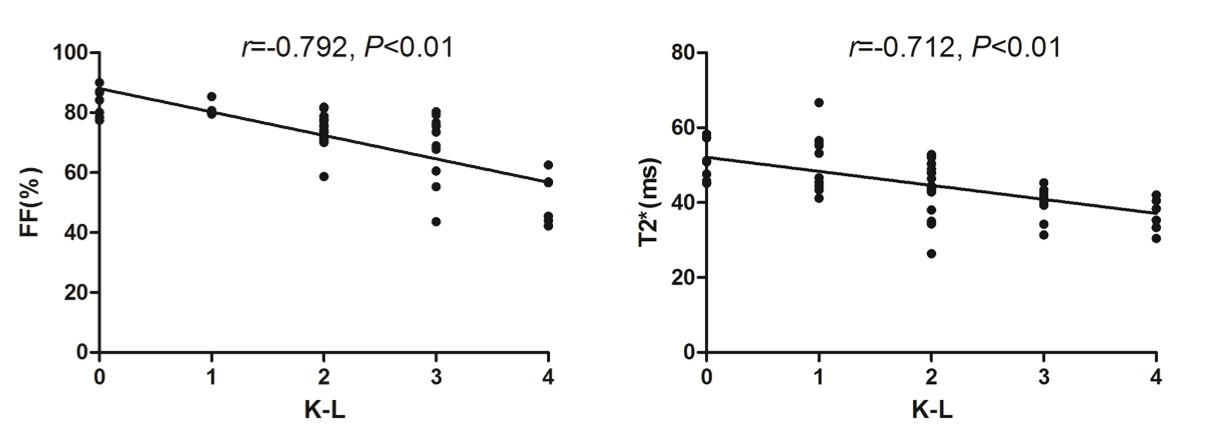
Table 3 shows the comparison of FF and T2* of the subjects in different groups with different K-L grading (no OA, mild OA, advanced OA), significant differences were found between groups for both two evaluating indicators (P=0.000, both). The averaged FF and T2* value of the subject with advanced OA is lower than the subject with mild OA and the no OA subjects (Figure 2). The coefficient of determination between FF and K-L grading is R = 0.792, T2* and K-L grading is R=0.712, demonstrating the high correlation between them (Figure 3).
Discussion
Although several studies were using IPFP signal intensity alteration as a surrogate for peripatellar synovitis in patients with knee OA(5,6), this is a comprehensive cohort study to investigate the association of FF and T2* in IPFP alteration with and severity of arthritis using KLG and symptoms in older adults. We found that cross-sectionally, IPFP was associated with increased knee symptoms and OA grading. Our findings suggest that IPFP content alteration may play an important role in knee osteoarthritic changes in older adults. Quantitative MR techniques using FF and T2* can be measured quantitatively and meaningfully. Though the exact function of IPFP in the knee joint is unknown, it has been considered as an active OA joint tissue and may play an important role in knee OA(7).Conclusion
Quantitative magnetic resonance technology such as FF and T2*can precisely provide an accurate and effective means of evaluation using a clinical MR scanner.Acknowledgements
Corresponding author:Xiaodong Zhang.
Funding:The National Natural Science Foundation of China (81801653, 81871349, and 61671228), Science and Technology Planning Project of Guangdong Province (2017B090912006) .
References
1. Martel-Pelletier J, Barr AJ, Cicuttini FM, Conaghan PG, Cooper C, Goldring MB, Goldring SR, Jones G, Teichtahl AJ, Pelletier JP. Osteoarthritis. Nature reviews Disease primers 2016;2:16072.
2. Ioan-Facsinay A, Kloppenburg M. An emerging player in knee osteoarthritis: the infrapatellar fat pad. Arthritis research & therapy 2013;15(6):225.
3. Zeng N, Yan ZP, Chen XY, Ni GX. Infrapatellar Fat Pad and Knee Osteoarthritis. Aging and disease 2020;11(5):1317-1328.
4. Han W, Aitken D, Zhu Z, Halliday A, Wang X, Antony B, Cicuttini F. Signal intensity alteration in the infrapatellar fat pad at baseline for the prediction of knee symptoms and structure in older adults: a cohort study. 2016;75(10):1783-1788.
5. Masaki T, Takahashi K, Hashimoto S, Ikuta F, Watanabe A, Kiuchi S, Okuaki T, Mochizuki Y, Takai S. Volume change in infrapatellar fat pad is associated not with obesity but with cartilage degeneration. Journal of orthopaedic research : official publication of the Orthopaedic Research Society 2019;37(3):593-600.
6. Yun SJ, Lim Y, Jin W, Park YS, Lee SH, Ryu KN. Validity of Radiograph-Based Infrapatellar Fat Pad Opacity Grading for Assessing Knee Synovitis: Correlation With Contrast-Enhanced MRI. AJR American journal of roentgenology 2017;209(6):1321-1330.
7. Heilmeier U, Mamoto K, Amano K, Eck B, Tanaka M, Bullen JA, Schwaiger BJ, Huebner JL, Stabler TV, Kraus VB, Ma CB, Link TM, Li X. Infrapatellar fat pad abnormalities are associated with a higher inflammatory synovial fluid cytokine profile in young adults following ACL tear. Osteoarthritis and cartilage 2020;28(1):82-91.
Figures