3868
Spatial Dependence of PDFF Measurement Bias using Chemical Shift Encoded MRI1Department of Radiology, University of Wisconsin-Madison, Madison, WI, United States, 2Calimetrix LLC, Madison, WI, United States, 3Department of Medical Physics, University of Wisconsin-Madison, Madison, WI, United States, 4Departments of Biomedical Engineering, Medicine, and Emergency Medicine, University of Wisconsin-Madison, Madison, WI, United States
Synopsis
A phantom placed alongside a patient, i.e., “pocket phantom,” can enable quality assurance of proton density fat fraction (PDFF) measurements. To determine the optimal positioning, the spatial dependence of PDFF measurements must be understood. To address this unmet need, we filled the bore of a 3T MRI with pocket phantoms. Though PDFF bias was low, it increased with distance from isocenter. Absolute bias was <2.5% within 18cm (in-plane) and within 10cm (z-direction). We conclude that the optimal position for a PDFF pocket phantom is on the table, centered below the patient at the level of the examined organ.
Introduction
Quality assurance (QA) of MR acquisitions is an important aspect of medical imaging. With the introduction of quantitative MRI into clinical routine, QA must go beyond qualitative assessment. In the case of proton density fat fraction (PDFF) measurements using advanced chemical shift encoded MRI (CSE-MRI), the use of standardized “pocket” phantoms with predefined PDFF values in a clinical scan would allow for QA on a patient-to-patient basis.With the patient positioned at isocenter, the pocket phantom position will necessarily be off-isocenter. Currently, the impact of off-isocenter PDFF-quantification is an important gap in knowledge. Thus, the purpose of this study is to establish the spatial dependence of PDFF measurement bias using CSE-MRI.
Methods
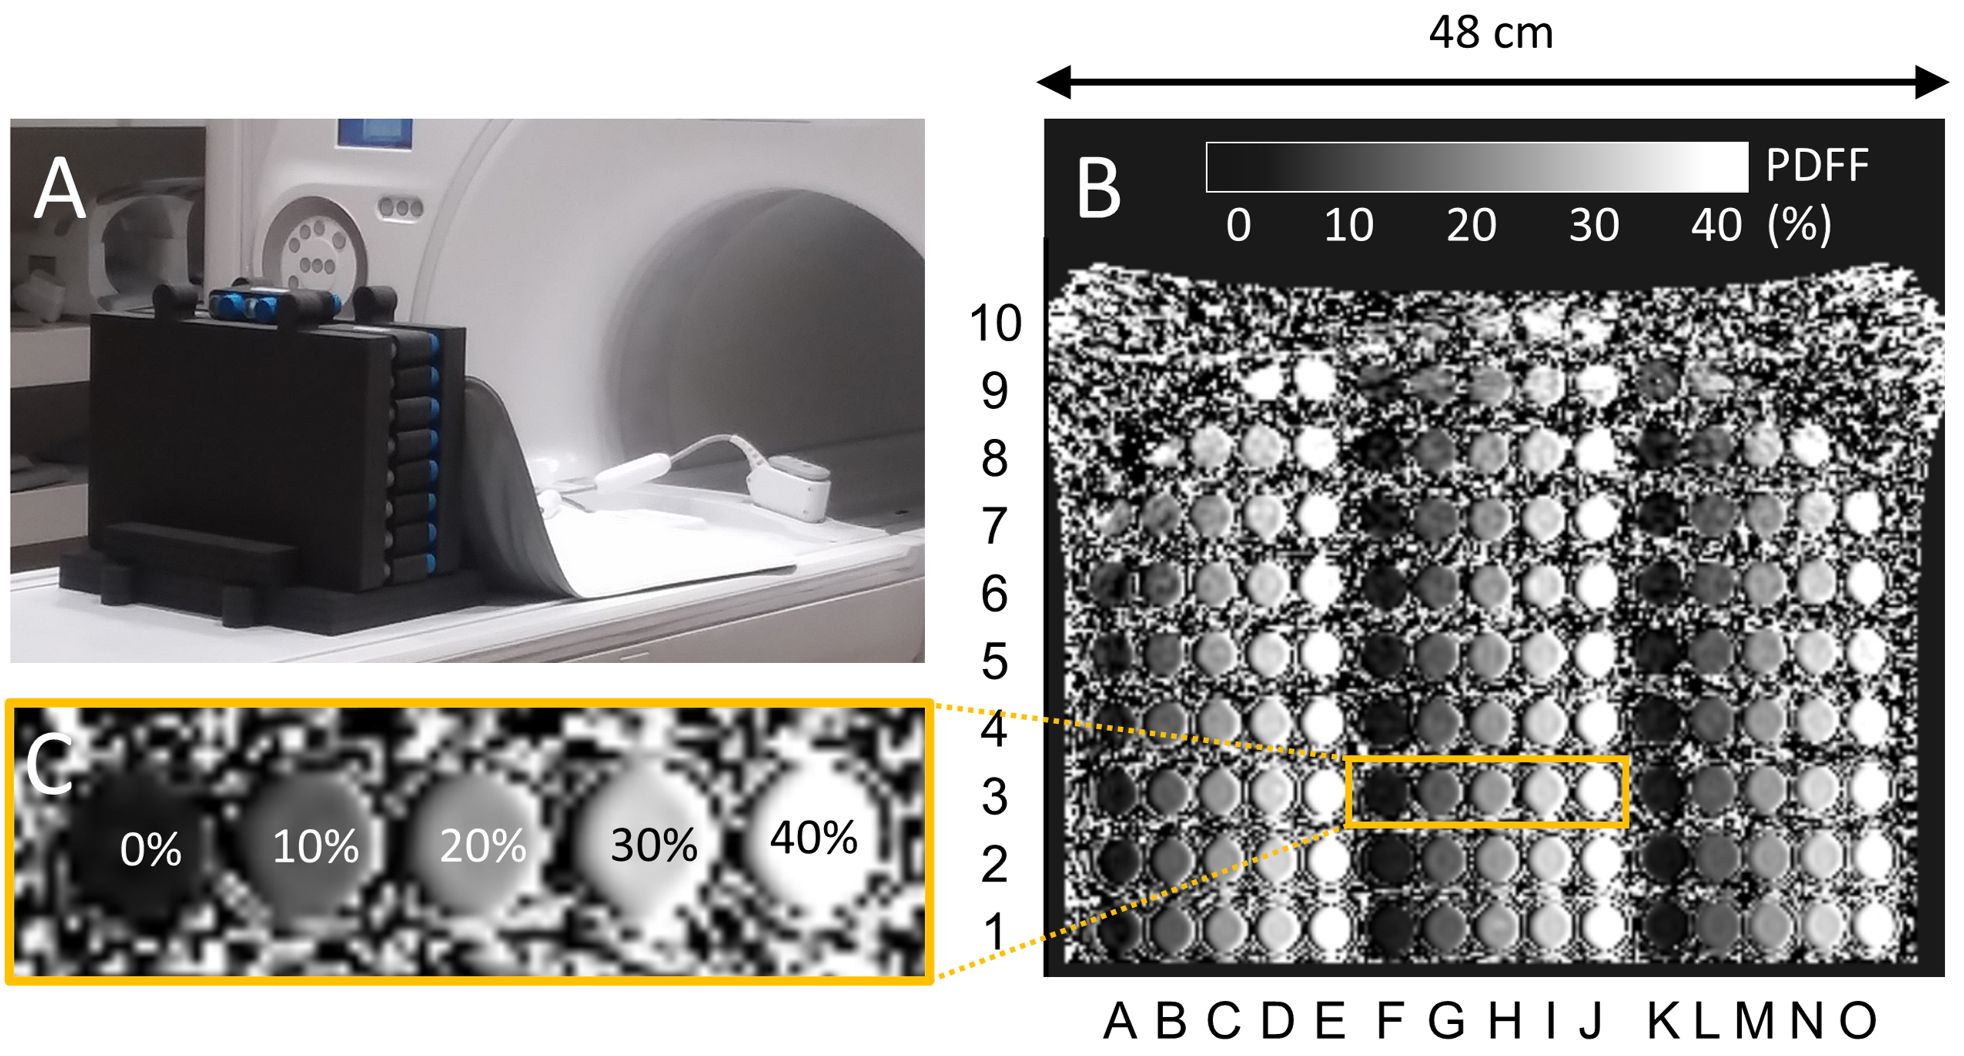
Phantom: Commercially available sets of vials-only pocket PDFF phantoms (Calimetrix, Madison, WI) were used. Each vial set contains 5 vials (each 25x25x91mm) with 0%,10%,20%,30%, and 40% PDFF concentration, respectively. 28 sets (140 vials) were stacked to fill the bore (Figure 1).Acquisition and Reconstruction: Acquisitions were performed on a clinical 3T MRI system (SIGNATM Premier, GE Healthcare, Waukesha, WI) with a 30-channel anterior array receiver coil using a commercial CSE-MRI method (IDEAL IQ, GE Healthcare) for PDFF quantification (TR/TE1/ΔTE = 9.5/1.1/0.9ms, flip angle=4°, pixel bandwidth=488Hz/pixel, FOV=48x38x8.8cm2, spatial resolution 3.0x3.0x3.0mm3). Acquisitions were repeated with different z-direction offsets (0cm,10cm,15cm,20cm). Subsequently, the whole phantom setup was rotated 180° around the y-axis and acquisitions repeated to facilitate measurement of different PDFF concentrations at the same locations. To avoid swap artifacts, confounder-corrected PDFF was reconstructed using a magnitude-based reconstruction where the iterative parameter estimation algorithm is initialized with the assumption that PDFF=0%. The confounding effects of T2* decay, spectral complexity of fat and temperature were also corrected1.
PDFF measurements: Regions of interest (ROI, 1cm²) were placed in the center of all vials using HorosTM (Horos Project, USA). ROIs were semi-automatically co-registered on three consecutive slices and measurements averaged.
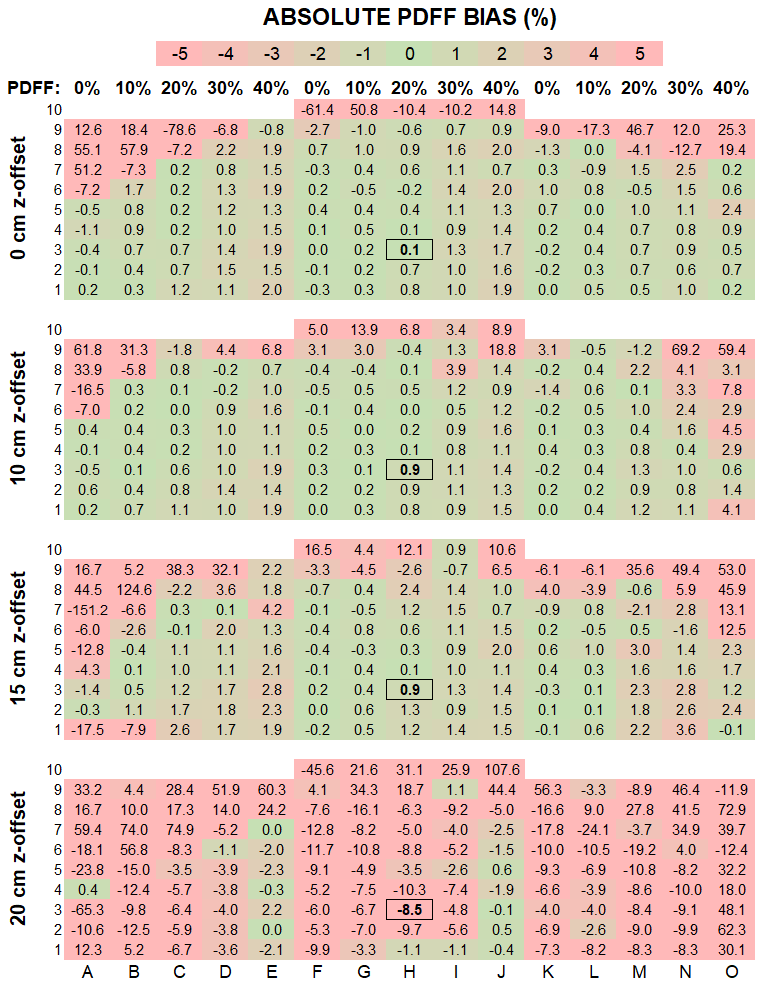
Statistics: Absolute and relative bias between the true PDFF of the vials and the PDFF measurements for each ROI were calculated and color-coded bias maps were created. Bias was plotted against the distance from isocenter in-plane for all z-offsets. Bias per PDFF value as a function of z-offset was depicted in boxplots.
Results
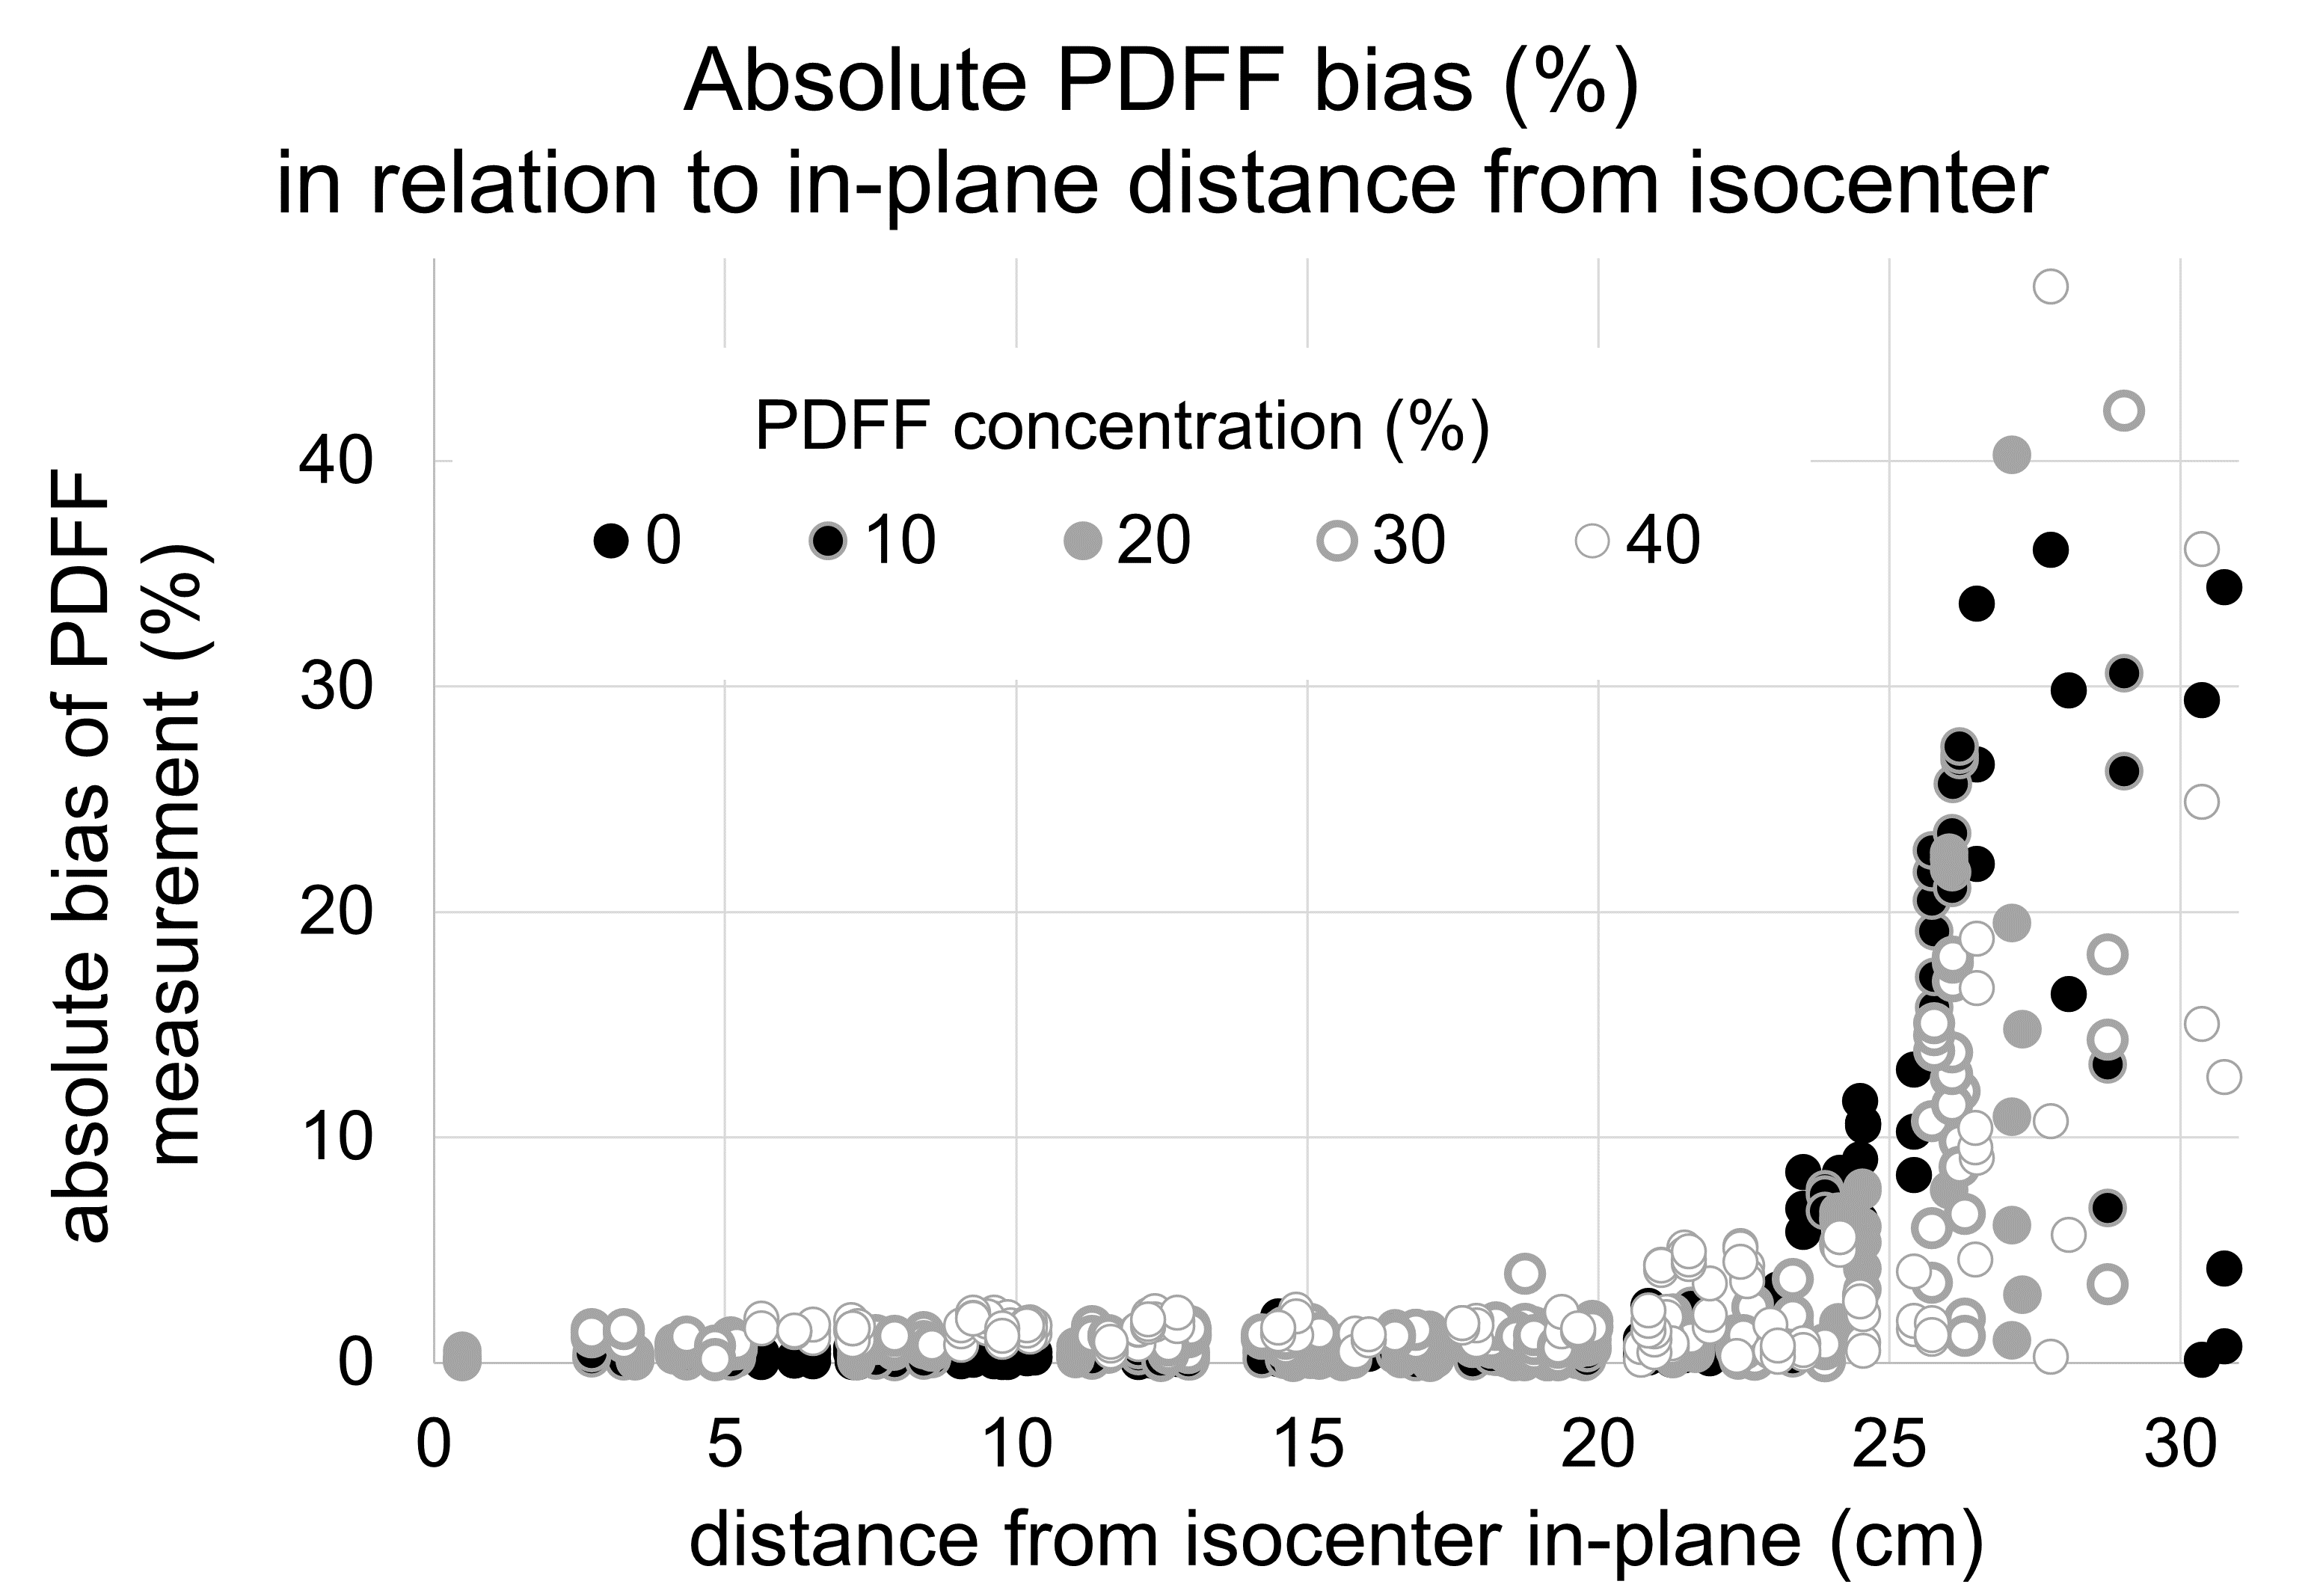
Bias maps: PDFF measurement bias increased with distance from isocenter in-plane and along the z-axis (Figure 2). The absolute measurement bias was <2.5% for 81% of vials with no z-offset and 84% for 10cm z-offset. This value dropped to 71% and 15% with increasing z-offset of 15cm and 20cm, respectively. For all z-offsets, high bias was recorded in the upper edges of the FOV.In-plane distance from isocenter: Absolute PDFF measurement bias was <2.5% (<5%) for in-plane distance from isocenter of <18cm (<21cm) with no offset in z-direction. For distances >21cm, bias increased steeply (Figure 3). The same trend was observed for higher z-offsets but occurred closer to isocenter in-plane (bias <5% at <18cm, 17cm, 0cm in-plane distance to isocenter for z-offset of 10cm, 15cm, and 20cm, respectively).
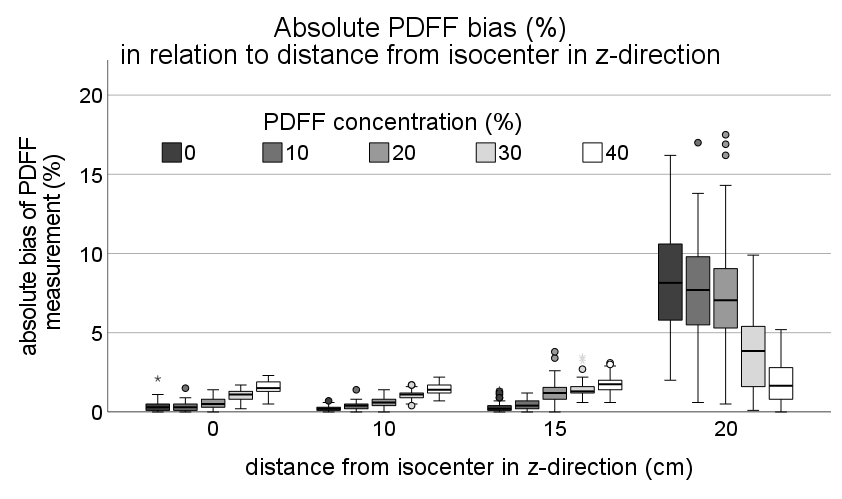
Distance from isocenter along z-axis: Absolute PDFF measurement bias was <2.5% (<5%) for offsets in z-direction of <10cm (<15cm) when measurements within a 17cm in-plane radius from isocenter were made. With 20cm z-offset, the bias increased steeply (Figure 4).
Discussion
We examined the effects of off-isocenter imaging on bias in PDFF measurements using CSE-MRI. Overall, bias was very low but increased with increasing distance from isocenter. We found that a distance from isocenter of up to ±18cm in-plane and up to ±10cm in z-direction translates into clinically acceptable PDFF measurement bias of <2.5%. Practically, this means that pocket PDFF phantoms should be placed under the patient, centered in left-right direction. Further, care must be taken to align the pocket phantom within ±10cm of the examined organ in z-direction.Although small, bias related to off-isocenter imaging may be related to several factors. Concomitant gradients are known to impact PDFF estimation, depending on the characteristics of the echo train2. B0 inhomogeneities are naturally accounted for with CSE-MRI which naturally estimates them as part of PDFF estimation. B1 inhomogeneities are generally avoided through low flip angles. Spatially dependent eddy currents or gradient timing delays could potentially introduce bias in PDFF estimation, although these should be avoided using magnitude-based CSE-MRI fitting.
With between-scan variability of PDFF being as low as 1%3 and cut-offs for the prediction of metabolic syndrome ranging between 3-5%4,5, a low bias for low PDFF values (0-10%) is essential. For these PDFF values, we demonstrated that the absolute bias for vials within the range of 12-15cm distance to isocenter in-plane for a z-offset of 0-10cm was <1%. Hence, the spatial constraints of low PDFF measurements are narrower than for higher PDFF. Finally, we note that these results are study-specific and may depend on specific sequence parameters and hardware. Further work with a wider variety of acquisition and reconstruction parameters is needed.
Conclusion
Based on this study, the optimal location for placing a pocket PDFF phantom lies within 18cm distance to isocenter in-plane and 10cm distance to isocenter in z-direction allowing for maximum absolute bias of 2.5%. We therefore propose to place the phantom below the patient centered on the table and at the level of the examined organ.Acknowledgements
We wish to thank Calimetrix for use of the pocket phantoms for this study. Further, we wish to acknowledge support from the NIH (NIH R01 DK088925, R44EB025729), UW Institute for Clinical and Translational Research, and the Clinical and Translational Science Award of the NCATS/NIH, as well as GE Healthcare who provides research support to the University of Wisconsin. Finally, Dr. Reeder is a Romnes Faculty Fellow, and has received an award provided by the University of Wisconsin-Madison Office of the Vice Chancellor for Research and Graduate Education with funding from the Wisconsin Alumni Research Foundation.
David Rutkowski, PhD, and Jean Brittain, PhD, are employees of Calimetrix LLC. Scott Reeder, MD, PhD, Diego Hernando, PhD, and Jean Brittain, PhD have ownership interests in Calimetrix LLC.
References
1. Reeder SB, Cruite I, Hamilton G, Sirlin CB. Quantitative Assessment of Liver Fat with Magnetic Resonance Imaging and Spectroscopy. J. Magn. Reson. Imaging 2011;34:729-49.
2.Colgan TJ, Hernando D, Sharma SD, Reeder SB. The effects of concomitant gradients on chemical shift encoded MRI. Magn. Reson. Med. 2017;78:730-8.
3. Colgan TJ, Van Pay AJ, Sharma SD, Mao L, Reeder SB. Diurnal Variation of Proton Density Fat Fraction in the Liver Using Quantitative Chemical Shift Encoded MRI. J. Magn. Reson. Imaging 2020;51:407-14.
4. Puchner SB, Lu MT, Mayrhofer T, et al. High-risk coronary plaque at coronary CT angiography is associated with nonalcoholic fatty liver disease, independent of coronary plaque and stenosis burden: results from the ROMICAT II trial. Radiology 2015;274:693-701.
5. Rehm JL, Wolfgram PM, Hernando D, Eickhoff JC, Allen DB, Reeder SB. Proton density fat-fraction is an accurate biomarker of hepatic steatosis in adolescent girls and young women. Eur. Radiol. 2015;25:2921-30.
Figures