3867
Bone Marrow Adiposity Evaluation using Dixon MRI Fat Fraction with Machine Leaning Segmentation in the UK Biobank – Initial Validation
David M Morris1, Chengjia Wang1, Giorgos Papanastasiou2, Calum Gray3, Scott IK Semple1, Tom MacGillivray1, and William Cawthorn1
1Centre for Cardiovascular Science, University of Edinburgh, Edinburgh, United Kingdom, 2University of Essex, Colchester, United Kingdom, 3Edinburgh Imaging, University of Edinburgh, Edinburgh, United Kingdom
1Centre for Cardiovascular Science, University of Edinburgh, Edinburgh, United Kingdom, 2University of Essex, Colchester, United Kingdom, 3Edinburgh Imaging, University of Edinburgh, Edinburgh, United Kingdom
Synopsis
The UK Biobank is a research tissue data bank that contains genetic, health and MRI data. This includes 2-point Dixon sequences allowing for the assessment of fat fraction to evaluate bone marrow adiposity. Bone marrow adipose tissue is a potential biomarker of diseases including osteoporosis and endocrine disorders. Manual processing of this big data is not feasible and automated processes must be developed and validated. Machine Learning has been developed for the automated segmentation of anatomically appropriate bone marrow regions of interest and the extracted Fat Fraction values validated against expected values across different subject groups.
Introduction
Bone Marrow Adipose Tissue (BMAT) comprises over 10% of adult fat content and increases with aging and diseases including obesity, diabetes and osteoporosis. BMAT is implicated in the regulation of haematopoiesis (the production of blood cells and platelets) and, by modulating the functions of osteoblasts and osteoclasts, may impact skeletal remodelling and bone loss. BMAT might also influence systemic metabolic health as a site of glucose uptake and source of hormones, such as adiponectin 1. Changes in marrow function due to changes in BMAT can affect all these processes and indicate that evaluation of the amount of the BMAT may be an important clinical biomarker 2. Magnetic Resonance Imaging (MRI) can measure the proton density Fat Fraction (FF) 3.The UK Biobank is a research tissue bank set up to facilitate large-scale prospective epidemiological studies. A total of 500,000 volunteers have been recruited with full genetic screening and medical information. A further imaging study is being carried out that aims to recruit 100,000 volunteers, currently 49,000 at end of 2020. This study includes MRI FF sequences from shoulder to knee and DEXA scans of the bones, in addition to the health information collected at enrollment and continuously updated. This resource provides the data to investigate the impact of BMAT physiological function and pathological conditions. Establishing these roles of BMAT will reveal its utility as a clinical biomarker 4.
Methods
MRI data was collected at UK Biobank Limited with a 1.5 T Aera Scanner (Siemens Healthineers, Erlangen, Germany) using a two point Dixon technique 5.To provide training data for a machine learning approach, manual (MAN) segmentation was performed of physiologically relevant areas of bone marrow in the femur (Figure 2) and spine. The areas identified in the femur were the head, neck, epiphysis region (between the greater and lesser trochanters) and diaphysis (located at the narrowest point of the femoral shaft). Spinal marrow was defined for vertebra in the imaging block containing the L1 vertebra. This was 8-10 vertebra, of which 60-80% are thoracic depending on patient height.
Automatic region segmentation was achieved with a U-net convolutional neural network 6. Dice Scores were used to evaluate the success of the models comparing the overlap between the then MAN segmenations used for training and the machine learning (ML) segmentations generated. A number of the MAN segmentations were not used in training so the evaluation was carried out on unseen data.
Fat and water images are available from UK Biobank and these were used to calculate FF maps 7 to which the segmentations (MAN and ML) were applied. When calculating the FF, Gaussian smoothing (3 x 3) was applied in-plane to the fat and water images to reduce the effect of noise on FF values. To minimise contamination of non-bone marrow tissue (i.e. bone) in-plane erosion of the outer voxels was applied to each region.
Dice Scores assess the agreement between MAN and ML regions but do not asses the anatomical appropriateness of the regions particularly, when there would be variability between observers in the ground truth segmentations. To evaluate this both MAN and ML regions were applied to the FF maps and the values compared.
Further validation of the automated process to generate FF values was carried out by analyzing a group of MAN segmentations consisting of male and female subjects (aged 60-69) split into clinically relevant groups: obese, non-osteoporotic (BMI > 30, T-score >-2.5 for bone mineral density (BMD) of the spine); non-obese osteoporotic (BMI<25, Spine BMD T-score <-2.5); and normal (BMI<25, Spine BMD T-score >-2.5).
Results
The Dice Scores for all the segmentations are shown in Figure 3. The Diaphysis score is considerably lower due to the limited features present the the images and requires more advanced machine learning.The ML and MAN segmentations are compared for the spine and femoral head, neck and epiphysis. These results are shown in Figure 4 and show average agreements of ≈ 1% for FF measurements between ML & MAN segmentations.
The validation of the processing for the ML segmentations is shown in Figure 5. Currently the low number of samples prevents statistical significance being reached for differences, FF greater in normal females than in normal males; greater in osteoporotic vs normal subjects of either sex; and greater in obese vs normal for males.
Discussion
Validation of methodology for the automated analysis of large MRI data sets is required to leverage the power of big data, particularly the additional genetic and health information, to understand the information provided by MRI biomarkers. Practical considerations have been addressed including the presence of image artifacts and deviations from the scanning protocol. These cause erroneous FF results and manual error checking is impractical. Further Investigation in a larger data set (≈ 2000 subjects) where results can be investigated individually will identify sources of error and allow for the implementation of automatic error checking before application to the full data set.Conclusion
Automatic segmentation has been achieved and automated techniques generate physiologically plausible results for Bone Marrow FF 7,8. Using an MRI biomarker, the influence of BMAT on human health will be investigated on a population level in the UK Biobank.Acknowledgements
This research is supported by a grant from the Medical Research Council (MR/S010505/1) and has been conducted using the UK Biobank Resource under Application Number 48697.References
- Cawthon, W.P. & Macdougald O.A. (2017) WHY ARE OUR BONES FULL OF FAT? THE SECRETS OF BONE MARROW ADIPOSE TISSUE. The Endocrinologist Issue 126 Winter 2017, 9-10.
- Veldhuis-Vlug, A. G., and Rosen, C. J. (2018) Clinical implications of bone marrow adiposity. J. Intern. Med. 283, 121-139.
- Karampinos, D. C., Ruschke, S., Dieckmeyer, M., Diefenbach, M., Franz, D., Gersing, A. S., et al. (2018) Quantitative MRI and spectroscopy of bone marrow. J. Magn. Reson. Imaging 47, 332-353.
- OPTIMAT: Population-level Imaging, genomic and phenotypic analyses to determine how bone marrow adiposity impacts human health https://www.ukbiobank.ac.uk/ retrieved 12/12/2020.
- Dixon, W.T. Simple proton spectroscopic imaging. (1984) Radiology; 153:189-194.
- Ronneberger O., Fischer P., Brox T. (2015) U-Net: Convolutional Networks
for Biomedical Image Segmentation. In: Navab N., Hornegger J., Wells
W., Frangi A. (eds) Medical Image Computing and Computer-Assisted
Intervention – MICCAI 2015. MICCAI 2015. Lecture Notes in Computer
Science, vol 9351. Springer, Cham.
- Gondim Teixeira, P.A., Cherubin, T., Badr, S. et al. (2019) Proximal femur fat fraction variation in healthy subjects using chemical shift-encoding based MRI. Sci Rep 9, 20212 .
- Chang, R., Ma, X., Jiang, Y. et al. (2020) Percentage fat fraction in magnetic resonance imaging: upgrading the osteoporosis-detecting parameter. BMC Med Imaging 20, 30.
Figures
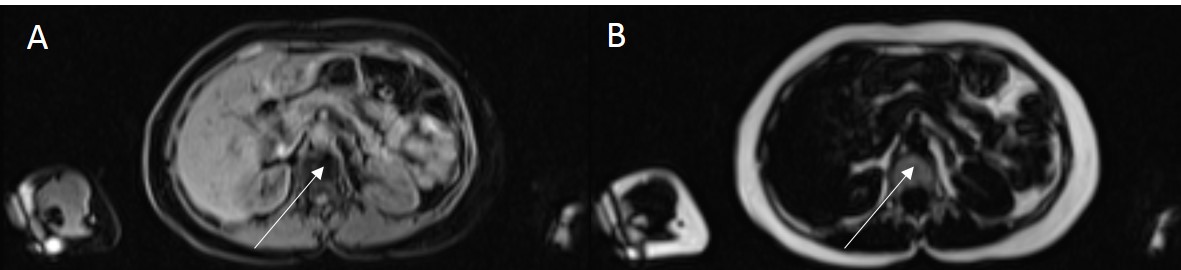
Fig 1. Example water (A) and fat (B) images of
the abdomen with the marrow fat in the vertebra indicated by the arrows
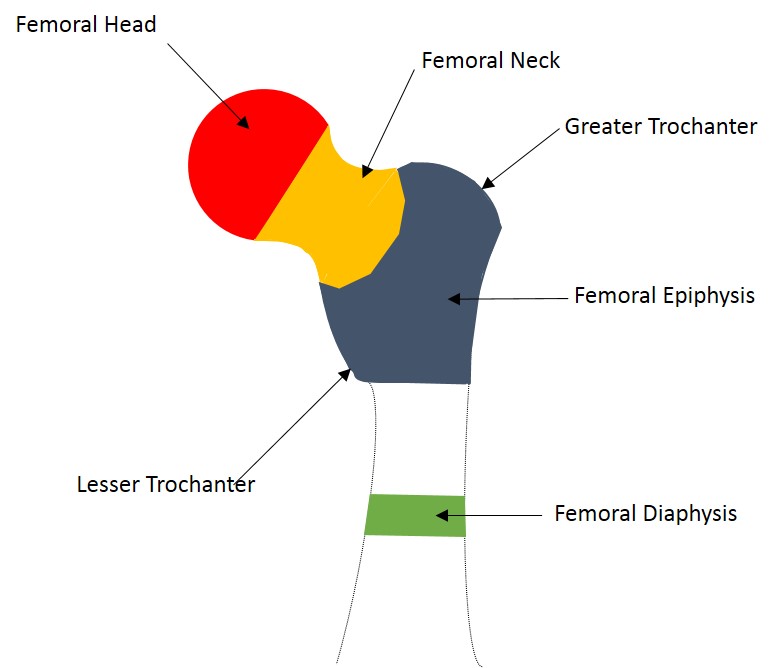
Fig 2. Femoral regions: Head (red), Neck
(orange), Epiphysis (blue) & Diaphysis (green)
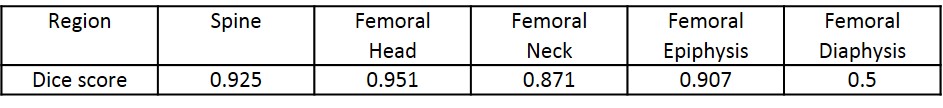
Fig 3. Dice Scores for UNET Machine Learning
of femoral segmentations
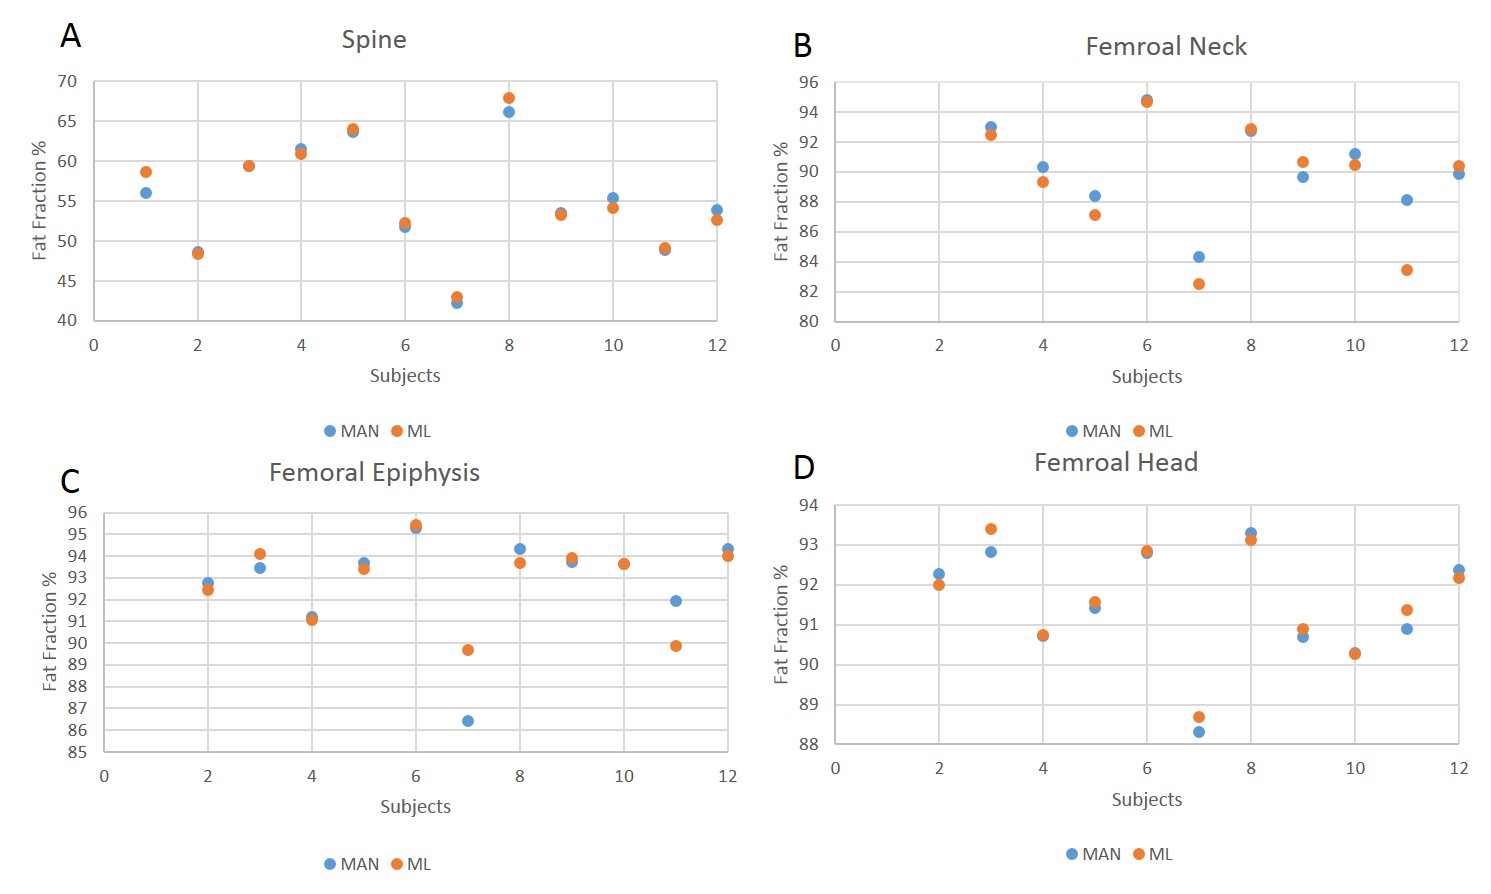
Fig 4. Comparison of Fat Fraction values for
manual (blue) and machine learning (orange) segmentations for the Spine (A),
Femoral Neck (B), Femoral Epiphysis (C) & Femoral Head (D)
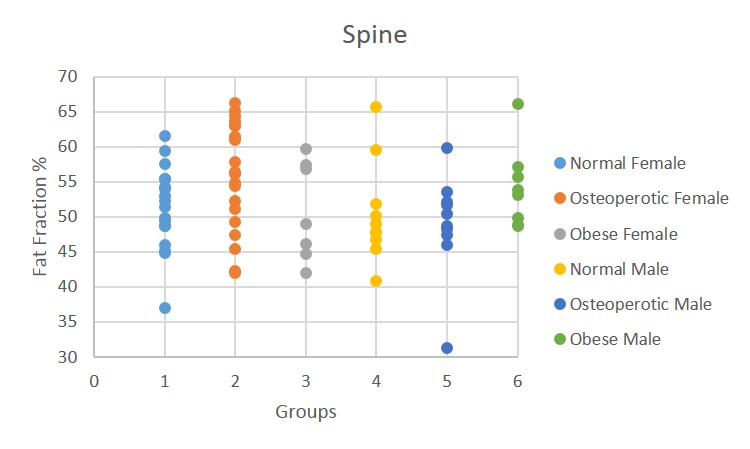
Fig 5. Spinal Fat Fraction for different subject
groups: Normal Female (light blue), Osteoporotic Female (orange), Obese Female
(grey), Normal Male (yellow), Osteoporotic Male (dark blue) & Obese Male
(green)