3864
Magnetic resonance thermometry in activated interscapular brown adipose tissue of rats with various dose of norepinephrine1Shenzhen Institutes of Advanced Technology,Chinese Academy of Sciences, Shenzhen, China
Synopsis
Magnetic Resonance thermometry (MRT) in activated brown adipose tissue (BAT) is able to measure the BAT function directly. A previous proposed fat-referenced 1H proton resonance frequency shift MRT method is adopted to compare the thermogenic capacity of rats injected with different dose of norepinephrine (NE). It is found that the rats with 2mg/kg and 1mg/kg NE injection had comparable maximum temperature rises after NE injection (7.1oC vs. 6.7oC), while temperature rises for rats with NE of 0.5mg/kg was significantly lower (3.8oC).
Introduction
Magnetic resonance thermometry (MRT) is able to measure the temperature change in the activated BAT, which is the most direct and accurate way to reflect BAT function1,2. Our previous studies have proposed a fat-referenced proton resonance frequency shift (PRFS) method to measure BAT temperature in vivo rat experiments at clinical 3.0T MR scanner with precision of 0.86oC calibrated by a fluorescent thermometer3. The intention of the study is to show whether the thermogenesis capacity of rat iBAT can be reflected by the proton based MRT with different dose of NE injection.Methods
Twenty rats with averaged weight 634g (standard deviation: ±39.6g) were randomly divided into four groups with different dose of NE injection: Group1 with 5 rats of 2mg/kg NE, Group2 with 6 rats of 1mg/kg NE, Group3 with 5 rats of 0.5mg/kg NE and Group4 with 4 rats of 1ml/kg saline instead of NE. Before NE or saline injection, the rats were placed in the MR room over 30min for acclimation. During the experiments, the rats were continuous anesthetized by isoflurane and the rectal temperatures were monitored by an MR-compatible fluorescent optic-fiber thermometer. The body temperature of rats was kept by a warm water circulation system to prevent them from dying due to long-time anesthesia.All MRI scans in the present study were completed on a clinical 3.0T scanner (uMR 790, Shanghai United Imaging healthcare, Shanghai, China) using an 8-echo 2D gradient-echo sequence with bipolar acquisition. The imaging slices were located in the interscapular brown adipose tissue (iBAT). The basic protocol was TR = 235 ms, TE1/ΔTE = 2.99/1.79ms, slice thickness = 2.1 mm, flip angle = 30° and pixel resolution = 0.47 × 0.47 mm2. The acquisition time for each measurement was 5min and a total of 36 successive measurements were acquired with a 12-channel rat/mouse coil and NE or saline was injected immediately after 6th measurement by intraperitoneal injection.
All of data processing were performed in MATLAB (MathWorks, Natick, MA). The current eddy induced phase error in multi-echo images due to bipolar acquisition was corrected using a hierarchical iterative linear-fitting algorithm (HILA) proposed by our group4. The temperature map of each measurement in the iBAT area was calculated using a fat-referenced dual-step iterative temperature estimation (DITE) proton resonance frequency shift (PRFS) method proposed in our previous study5.
Results
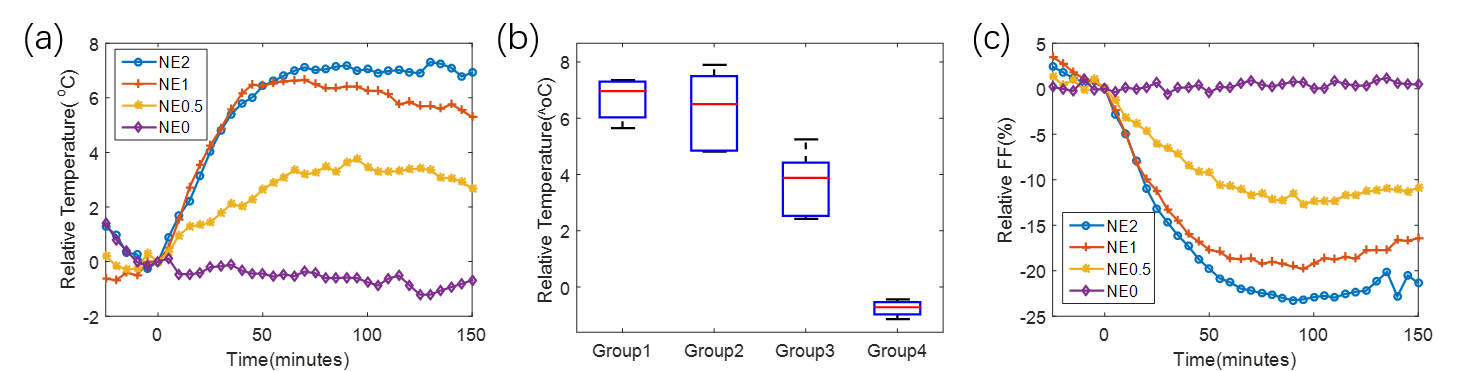
The temperature change maps of iBAT area at the 30 and 60 minutes after NE or saline injection relative to the ones just before NE injection of four representative rats from different groups are shown in Figure 1. Meanwhile, Figure 1 also shows the FF images of these four rats at the same time points. As shown, the temperature distribution was inhomogeneous within iBAT for each rat. It seems that the rats with more NE injection would have higher temperature rise and more FF decrease. The mean temperature change curves, mean maximum temperature and FF change curves of iBAT area for the rats from the same groups were calculated and shown in Figure 2. It is found that Group1 and Group2 have comparable temperature rises after NE injection with maximum value of 7.1oC vs. 6.7oC, while there exists significant lower temperature rises for Group3. As expected, iBAT in Group4 is not activated with no temperature increase. In fact, there exists a decrease in temperature of this group which may be due to a decrease in core body temperature in low-temperature environment. Although the maximum temperature changes were close for Group1 and Group2 after NE injection, the temperature change in Group1 lasted around the maximum value a long time (more than 100 minutes), while the temperature decreased gradually in Group2. The similar pattern is also observed in FF curves and the rats with higher NE dosage would cause more fatty acid consumption, which results in lower FF in brown adipocytes after NE injection.Discussion and conclusions
Injecting NE to activate BAT function is a commonly used method in rodent study. The present study evaluated the thermogenic capacity of iBAT in rats with different dose of NE injection. As expected, the maximum temperature change was positively correlated to the NE dosage, yet the maximum temperature change become “saturated” when NE dosage>1mg/kg. However, the thermogenic capacity of the group with 2mg/kg NE could be maintained at the maximum level for longer time. This study demonstrated the feasibility of the 1H-based MRT method in evaluating BAT function in vivo. In our next work, we will examine the consistency between MRT and histological results in BAT study.Acknowledgements
This research was supported by the Natural Science Foundation of China (No. 61901462), the Guangdong Grant ‘Key Technologies for Treatment of BrainDisorders’ (2018B030332001) and Shenzhen Double Chain Grant ([2018]256)References
1. Branca R T, He T, Zhang L, et al. Detection of brown adipose tissue and thermogenic activity in mice by hyperpolarized xenon MRI[J]. Proceedings of the National Academy of Sciences, 2014, 111(50): 18001-18006.
2. Wu M, Junker D, Branca R T, et al. Magnetic resonance imaging techniques for brown adipose tissue detection[J]. Frontiers in Endocrinology, 2020, 11: 421. doi: 10.3389/fendo.2020.00421
3. Cheng C, Wan Q, Qiao Y, et al. Validation of accuracy of fat-referenced PRFS thermometry on activated brown adipose tissue in rat in vivo. In: Proceedings of 2020 International Society for Magnetic Resonance in Medicine Virtual Conference & Exhibition (2020).
4. Zou C, Cheng C, Qiao Y, et al. Hierarchical iterative linear-fitting algorithm (HILA) for phase correction in fat quantification by bipolar multi-echo sequence[J]. Quantitative Imaging in Medicine and Surgery, 2019, 9(2): 247-262.
5. Cheng C, Zou C, Wan Q, et al. Dual‐step iterative temperature estimation method for accurate and precise fat‐referenced PRFS temperature imaging[J]. Magnetic Resonance in Medicine, 2019, 81(2): 1322-1334.
Figures