3862
Linearity and Bias of Liver and Bone Marrow Proton Density Fat Fraction (PDFF) in the setting of Ferumoxytol MRI1Radiology and Medical Physics, University of Wisconsin-Madison, Madison, WI, United States, 2Radiology, University of Wisconsin-Madison, Madison, WI, United States, 3Radiology, Medical Physics, Biomedical Engineering, Medicine, Emergency Medicine, University of Wisconsin-Madison, Madison, WI, United States
Synopsis
We evaluated the robustness of measuring liver and bone marrow PDFF by chemical shift encoded (CSE) MRI measured before and 1-3 days after intravenous (IV) administration of ultra-small superparamagnetic iron oxide (USPIO) particles, i.e., ferumoxytol, as IV contrast. Among the eight included subjects, there was strong linearity and no significant bias between pre- and post-ferumoxytol CSE-MRI liver PDFF (R2=0.99, slope=0.99 and intercept=0.38%; mean bias [limits of agreement]=0.4% [±1.7] at 1.5T, and 0.2% [±1.7] at 3.0T. However, CSE-MRI bone marrow PDFF suffered from bias and overestimation post-ferumoxytol (R2=0.85, slope=0.85, intercept=12.8%, mean bias [LOA]=5.4% [±6.2] at 1.5T and 4.4% [±6.5] at 3.0T).
Introduction
Proton density fat fraction (PDFF) is the leading noninvasive quantitative biomarker of fatty liver. Accurate PDFF measurements require minimization of and correction for several confounders, including R2* [1,2], since iron accumulates in the liver and bone marrow via the mononuclear phagocytic system. PDFF measurements by 3D axial multi-echo chemical shift encoded MRI (CSE-MRI) have been demonstrated to be robust to changes in R2* after administration of a superparamagnetic iron oxide (SPIO) contrast agent [3]. However, PDFF reproducibility after administration of ferumoxytol (Feraheme, AMAG Pharmaceuticals, Waltham, MA, USA), which is increasingly utilized as a contrast agent and is composed of ultra-small superparamagnetic iron oxide particles (USPIO) has not been demonstrated. We investigated PDFF measurement of the liver and spine bone marrow using CSE-MRI in patients who underwent abdominal MRI with ferumoxytol (feMRI).Methods
This IRB-approved, retrospective study reviewed all abdominal feMRI studies at a single institution since October 2014. All patients were referred for characterization of a pancreatic tail mass. MRI was performed on various 1.5 and 3.0T clinical scanners using 8-32 channel phased array torso coils (GE Healthcare, Waukesha, WI).For each patient, an initial MRI (MR#1) was followed by intravenous administration of ferumoxytol (slow infusion of 3 mg/kg body weight after 5-fold dilution with normal saline) and a delayed MRI (MR#2) at 24-72 hours on the same MRI system [4]. As part of the MRI protocol, a commercial CSE-MRI method was used (IDEAL IQ, GE Healthcare, Waukesha, WI) with the following acquisition parameters: TR 6.6-13.8 ms, TE 1.7-1.9 ms, 3-5° flip angle, 3-7 mm slice, 6-8 echoes per TR. CSE-MRI acquisitions were obtained in a single breath-hold with identical scanning parameters during both MR#1 and MR#2 sessions.
PDFF and R2* maps were exported, anonymized, reviewed, and analyzed by a fellowship-trained abdominal radiologist on an image processing software (Horos, v. 4.0.0 RC3). For each patient, 3 circular regions of interest (ROIs) measuring 2 cm in diameter were placed in the liver on the R2* map: one in the left lobe, one in the right lobe anterior segment, and one in the right lobe posterior segment. Care was taken to avoid major vessels and artifacts, and to visually match the ROI locations between MR#1 and MR#2 as closely as possible. Further, in each of the T11, T12, and L1 vertebral bodies, a circular ROI (1.6 cm in diameter) was placed on the R2* map, avoiding degenerative changes, central vascular plexus, or lesions.
All ROIs were copied and pasted from the R2* map to their corresponding PDFF map. Average R2* and PDFF values for each ROI were recorded. Scatterplots were used to assess for linearity and Bland-Altman analysis was used to assess for bias.
Results
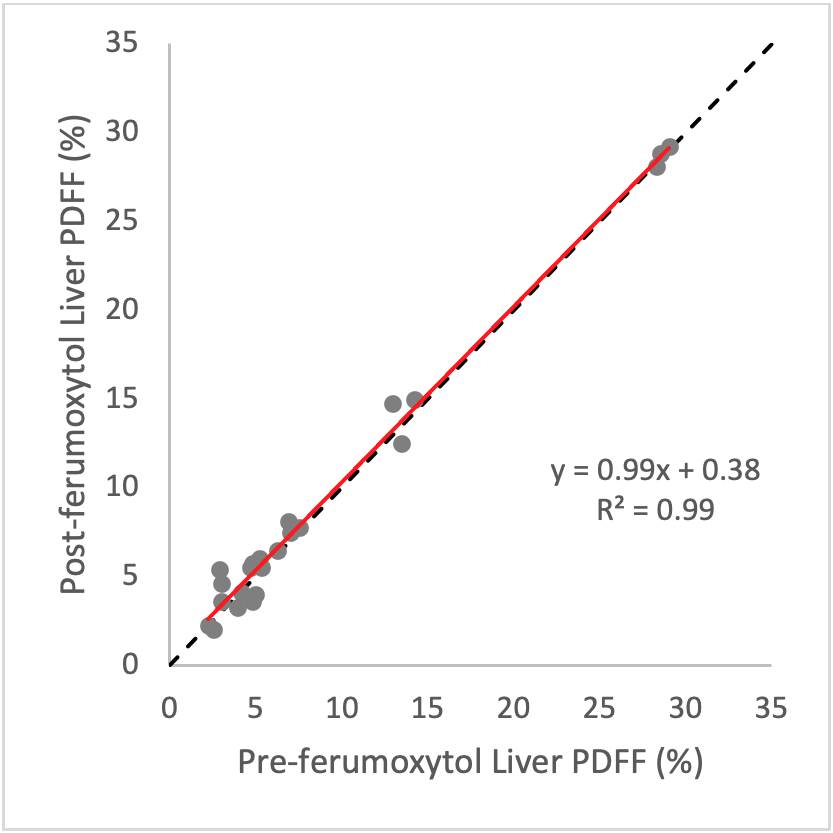
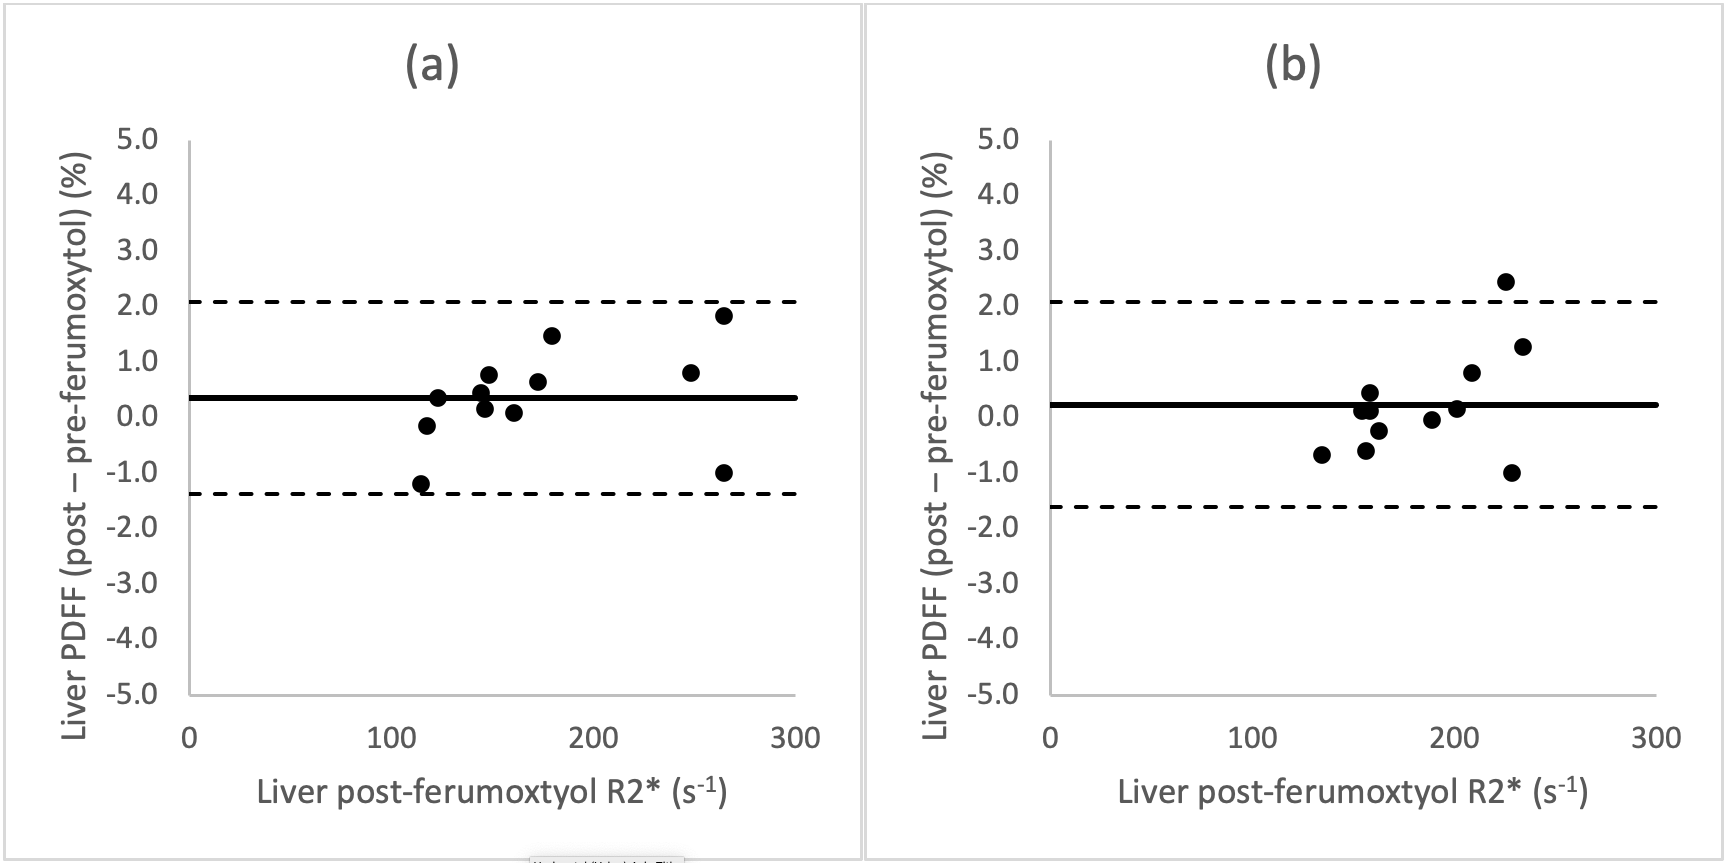
Nine subjects underwent successful feMRI; one was excluded due to different acquisition parameters between MR#1 and MR#2. Eight MRI exams (four exam on 1.5T and four on 3.0T platforms) from eight subjects were included: average age 63 years, 2 female, 6 male.Average increase in liver R2* post-ferumoxytol at 1.5T and 3.0T were respectively 139 and 133 s-1. Figure 1 demonstrates strong linearity between pre- and post-ferumoxytol liver PDFF (R2=0.99), with the linear fit demonstrating a slope of near-unity (slope=0.99) and an intercept near zero (intercept=0.38%). Bland-Altman analyses demonstrated mean bias [± limits of agreement (LOA)] of 0.4% [±1.7] at 1.5T, and 0.2% [±1.7] at 3.0T (Figure 2).
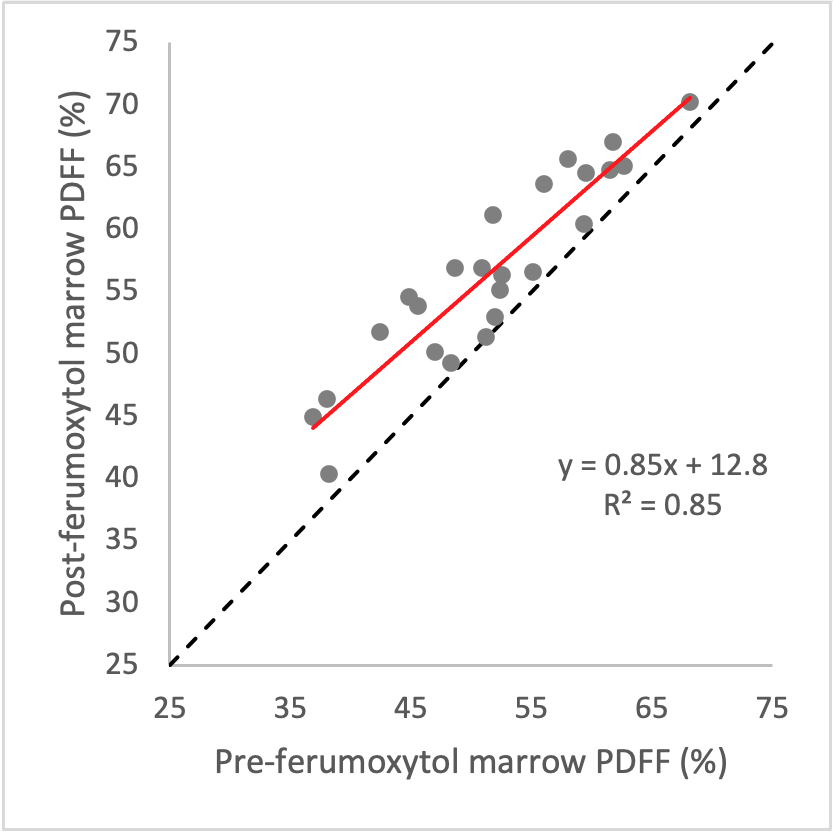
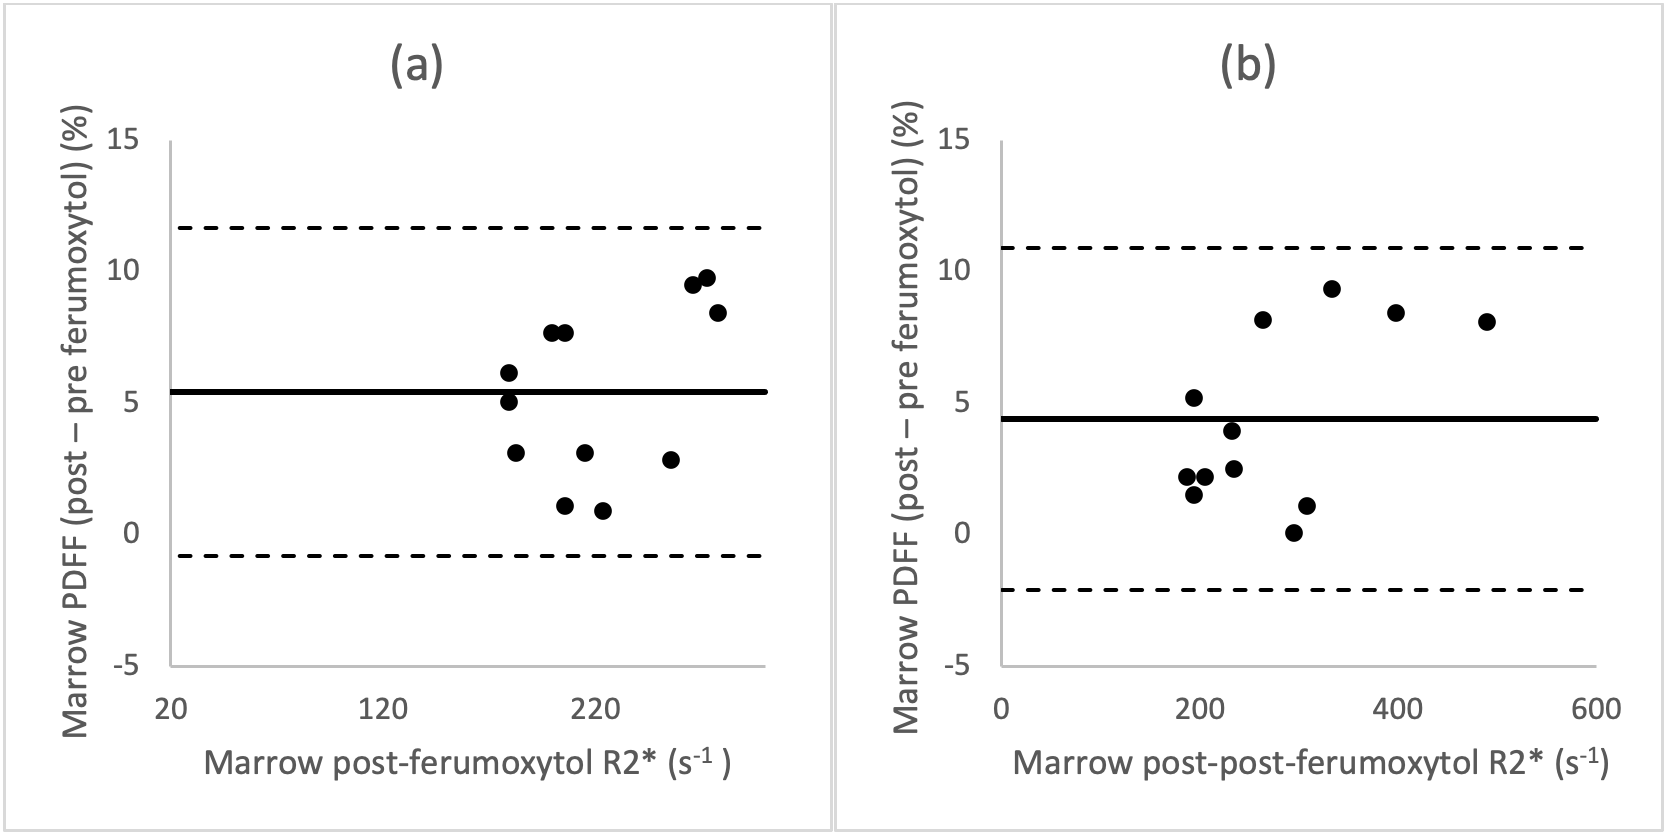
Average increase in bone marrow R2* values at 1.5T and 3.0T post-ferumoxytol were respectively 163 and 133 s-1. Figure 3 demonstrates strong linearity between pre- and post-ferumoxytol liver PDFF measurements (R2=0.85). However, the slope deviates from unity (slope=0.85) with an intercept of 12.8%. Bland-Altman analyses demonstrated mean bias [LOA] of 5.4% [±6.2] at 1.5T and 4.4% [±6.5] at 3.0T (Figure 4).
Discussion/Conclusion
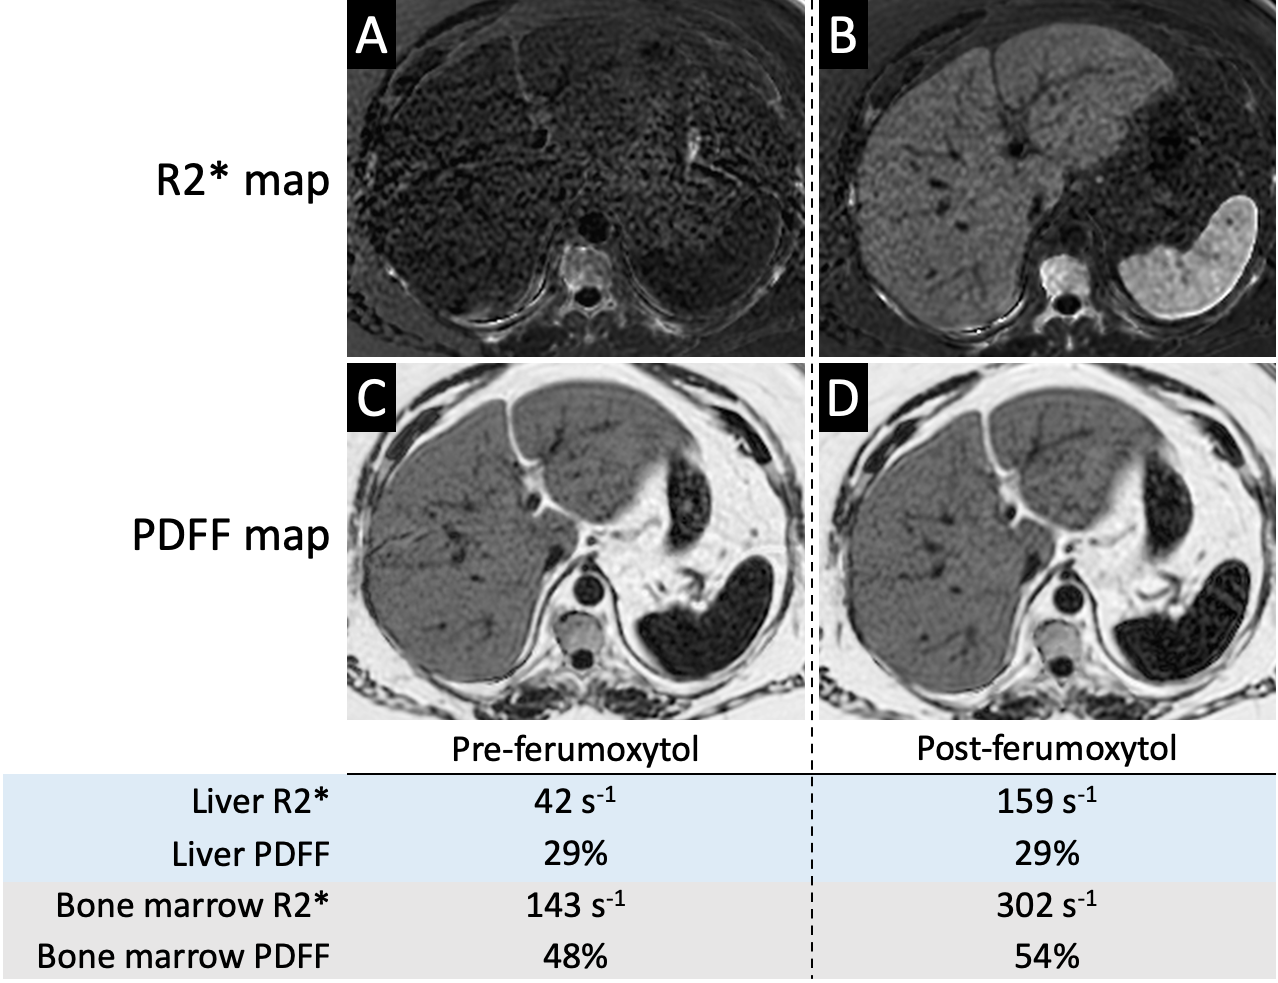
CSE-MRI-based measurement of liver PDFF is robust to intravenous administration of ferumoxytol with strong linearity, no clinically meaningful bias, and is within the expected reproducibility of liver PDFF measurements [5]. Interestingly, however, bone marrow PDFF suffers from bias after ferumoxytol administration (Figure 5). Although this may seem discordant with a prior report by Liau et al.[3], there are differences in methodology between the two reports, including differences in contrast agents (SPIO vs. USPIO particles), different post-infusion delay times (2 hours vs. 24-72 hours), and less pronounced changes in bone marrow R2* (22.7 s-1 at 3.0T vs. 163 s-1 in our cohort). Our results in bone marrow are concordant with the demonstrated failure of single-R2* correction models when calculating PDFF [6]. Limitations of our study include its retrospective design, small sample size, and absence of correlation with histopathology. Furthermore, we could not account for possible changes in liver and marrow PDFF between the two study days, but we expect the intrasubject changes in PDFF to average to near-zero when observed across the study cohort. In conclusion, while CSE-MRI-based PDFF measurements are robust to the presence of USPIO particles, they are susceptible to bias in the bone marrow, which is an important consideration when evaluating for changes in marrow fat content.Acknowledgements
The authors wish to acknowledge support from the NIH (R01‐DK117354, R01‐DK100651, and R01‐DK088925). In addition, GE Healthcare provides research support to the University of Wisconsin-Madison. Finally, Dr. Reeder is a Romnes Faculty Fellow, and has received an award provided by the University of Wisconsin-Madison Office of the Vice Chancellor for Research and Graduate Education with funding from the Wisconsin Alumni Research Foundation.References
1. Hines CDG, Agni R, Roen C, Rowland I, Hernando D, Bultman E, Horng D, Yu H, Shimakawa A, Brittain JH, Reeder SB (2012) Validation of MRI biomarkers of hepatic steatosis in the presence of iron overload in the ob/ob mouse. 35 (4):844-851. doi:10.1002/jmri.22890
2. Yu H, McKenzie CA, Shimakawa A, Vu AT, Brau ACS, Beatty PJ, Pineda AR, Brittain JH, Reeder SB (2007) Multiecho reconstruction for simultaneous water-fat decomposition and T2* estimation. J Magn Reson Imaging 26 (4):1153-1161. doi:10.1002/jmri.21090
3. Liau J, Shiehmorteza M, Girard OM, Sirlin CB, Bydder M (2013) Evaluation of MRI fat fraction in the liver and spine pre and post SPIO infusion. Magn Reson Imaging 31 (6):1012-1016. doi:10.1016/j.mri.2013.01.016
4. Vasanawala SS, Nguyen K-L, Hope MD, Bridges MD, Hope TA, Reeder SB, Bashir MR (2016) Safety and technique of ferumoxytol administration for MRI. Magn Reson Med 75 (5):2107-2111. doi:10.1002/mrm.26151
5. Yokoo T, Serai SD, Pirasteh A, Bashir MR, Hamilton G, Hernando D, Hu HH, Hetterich H, Kuhn JP, Kukuk GM, Loomba R, Middleton MS, Obuchowski NA, Song JS, Tang A, Wu X, Reeder SB, Sirlin CB, Committee R-QPB (2018) Linearity, Bias, and Precision of Hepatic Proton Density Fat Fraction Measurements by Using MR Imaging: A Meta-Analysis. Radiology 286 (2):486-498. doi:10.1148/radiol.2017170550
6. Karampinos DC, Ruschke S, Dieckmeyer M, Eggers H, Kooijman H, Rummeny EJ, Bauer JS, Baum T (2015) Modeling of T 2 * decay in vertebral bone marrow fat quantification. NMR Biomed 28 (11):1535-1542. doi:10.1002/nbm.3420
Figures