3861
Temperature-Corrected Proton Density Fat Fraction Estimation using Magnitude, Complex, and Hybrid Chemical Shift-Encoded MRI in Phantoms
Ruvini Navaratna1,2, Ruiyang Zhao1,2, Timothy J Colgan2, Houchun Harry Hu3, Mark Bydder4, Takeshi Yokoo5, Mustafa R Bashir6,7,8, Michael S Middleton9, Suraj D Serai10, Dariya Malyarenko11, Thomas Chenevert11, Mark Smith3, Walter Henderson9, Gavin Hamilton9, Yunhong Shu12, Claude B Sirlin9, Jean Tkach13, Andrew T Trout13,14, Jean H Brittain15, Diego Hernando1,2, and Scott B Reeder1,2,16,17,18
1Medical Physics, University of Wisconsin - Madison, Madison, WI, United States, 2Radiology, University of Wisconsin - Madison, Madison, WI, United States, 3Radiology, Nationwide Children's Hospital, Columbus, OH, United States, 4Radiological Sciences, University of California - Los Angeles, Los Angeles, CA, United States, 5Radiology, University of Texas - Southwestern Medical Center, Dallas, TX, United States, 6Radiology, Duke University Medical Center, Durham, NC, United States, 7Division of Hepatology, Duke University Medical Center, Durham, NC, United States, 8Center for Advanced Magnetic Resonance Development, Duke University Medical Center, Durham, NC, United States, 9Radiology, University of California - San Diego, San Diego, CA, United States, 10Radiology, Children's Hospital of Philadelphia, Philadelphia, PA, United States, 11Radiology, University of Michigan, Ann Arbor, MI, United States, 12Radiology, Mayo Clinic, Rochester, MN, United States, 13Radiology, Cincinnati Children's Hospital and Medical Center, Cincinnati, OH, United States, 14Radiology, University of Cincinnati College of Medicine, Cincinnati, OH, United States, 15Calimetrix, LLC, Madison, WI, United States, 16Biomedical Engineering, University of Wisconsin - Madison, Madison, WI, United States, 17Medicine, University of Wisconsin - Madison, Madison, WI, United States, 18Emergency Medicine, University of Wisconsin - Madison, Madison, WI, United States
1Medical Physics, University of Wisconsin - Madison, Madison, WI, United States, 2Radiology, University of Wisconsin - Madison, Madison, WI, United States, 3Radiology, Nationwide Children's Hospital, Columbus, OH, United States, 4Radiological Sciences, University of California - Los Angeles, Los Angeles, CA, United States, 5Radiology, University of Texas - Southwestern Medical Center, Dallas, TX, United States, 6Radiology, Duke University Medical Center, Durham, NC, United States, 7Division of Hepatology, Duke University Medical Center, Durham, NC, United States, 8Center for Advanced Magnetic Resonance Development, Duke University Medical Center, Durham, NC, United States, 9Radiology, University of California - San Diego, San Diego, CA, United States, 10Radiology, Children's Hospital of Philadelphia, Philadelphia, PA, United States, 11Radiology, University of Michigan, Ann Arbor, MI, United States, 12Radiology, Mayo Clinic, Rochester, MN, United States, 13Radiology, Cincinnati Children's Hospital and Medical Center, Cincinnati, OH, United States, 14Radiology, University of Cincinnati College of Medicine, Cincinnati, OH, United States, 15Calimetrix, LLC, Madison, WI, United States, 16Biomedical Engineering, University of Wisconsin - Madison, Madison, WI, United States, 17Medicine, University of Wisconsin - Madison, Madison, WI, United States, 18Emergency Medicine, University of Wisconsin - Madison, Madison, WI, United States
Synopsis
Chemical shift-encoded (CSE) MRI is a well-established technique to quantify proton density fat-fraction (PDFF) as a quantitative imaging biomarker of hepatic steatosis. However, temperature is known to affect the accuracy and precision of PDFF quantification in phantoms. Previous work has demonstrated the benefit of temperature-correction using magnitude-based CSE-MRI PDFF estimation. However, the effect of temperature correction on complex- and hybrid-based CSE-MRI PDFF estimation is unknown. In this study, we aim to compare the effects of PDFF temperature-correction for magnitude-based, complex-based, and hybrid-based CSE-MRI using simulations, temperature-controlled phantom experiments, and a multi-center phantom study.
Introduction
Chemical shift-encoded (CSE) MRI is a well-established technique to quantify proton density fat-fraction (PDFF) as a quantitative imaging biomarker of hepatic steatosis.1 However, temperature can bias PDFF estimation by changing the proton resonance frequency of water.2–4If temperature is known, PDFF can be reconstructed using a temperature-corrected multi-peak spectral model, $$$S_{est}(TE)$$$.5 Magnitude6 or complex7 fitting can estimate the complex signal amplitudes of water $$$(W)$$$ and fat $$$(F)$$$, the bulk field shift $$$(f_B)$$$, and $$$R_2^*$$$. PDFF can then be calculated using magnitude discrimination.8 Hybrid fitting9 performs a weighted combination of magnitude and complex PDFF, combining the stability of complex methods with the low bias of magnitude methods.
Previous work has proposed a technique to minimize temperature-related PDFF bias in phantoms (generally imaged at ambient/unknown temperature) without any a priori temperature information using magnitude-based CSE-MRI.10 A global temperature value, $$$T_G$$$, is estimated from the measured signal, $$$S_{meas}(TE)$$$: $$\begin{equation}\widehat{T_G}=\underset{T_G}{\operatorname{argmin}}\left[\sum_\mathbf{r}\underset{W,F,f_B,R_2^*}{\operatorname{argmin}}\left[\sum_{TE}|S_{est,TE}(T_G, W(\mathbf{r}), F(\mathbf{r}), f_B(\mathbf{r}), R_2^*(\mathbf{r}))-S_{meas,TE}|^2\right]\right]\tag{1}\end{equation}$$ where $$$\mathbf{r}$$$ is the voxel location. $$$T_G$$$ is subsequently used in the temperature-corrected signal model for all voxels to minimize PDFF bias.
While the benefit of this method has been demonstrated for magnitude-based CSE-MRI,10 the effects on complex- and hybrid-based CSE-MRI are unknown. Therefore, the purpose of this work is to compare the performance of temperature correction on PDFF estimation using magnitude-, complex-, and hybrid-based CSE-MRI.
Methods
Simulations: Noiseless multi-echo spoiled gradient echo (SGRE) signals were simulated in fat-water voxels at 1.5T and 3T with $$$R_2^*=40s^{-1}$$$ and $$$f_B=50Hz$$$ at temperatures from 0°C to 40°C for PDFF values of 0, 10, 20, and 50 (%). Six echoes with typical PDFF estimation echo times were used. For magnitude-based CSE-MRI simulations, an initial TE of 2.3ms (1.15ms) and TE of 2.3ms (1.15ms) at 1.5T (3T) were used. For complex- and hybrid-based simulations, an initial TE of 1.0ms (1.0ms) and TE of 1.6ms (0.8ms) at 1.5T (3T) were used. PDFF was quantified using magnitude-, complex-, and hybrid- fitting without temperature correction.Temperature-controlled phantom experiments: A fat-fraction phantom11 was constructed including 12 vials with PDFF values of 0, 4.1, 4.2, 7.6, 10.1, 14.3, 19.2, 23.3, 26.7, 35.6, 44.2, 100 (%). The phantom was imaged at 1.5T and 3T (1.5T 450w, 3T Signa Premier, GE Healthcare, Waukesha, WI) using standard head coils (1.5T-8 channel brain coil, 3T-48 channel head coil) at three temperatures, nominally 10°C, 20°C, and 40°C. Phantom temperature was measured using a thermometer (Serial No. 308756, Thermco, Lafayette, NJ) inserted into its interior. Acquisition parameters are listed in Table 1.
Multi-center phantom experiments: A separate commercial fat-fraction phantom (Model 300, Calimetrix, Madison, WI) with PDFF values of 0, 3.5, 5.6, 7.6, 10.0, 14.6, 19.3, 23.4, 28.6, 37.4, 47.5, 100 (%) was imaged as part of the QIBA PDFF phantom study.12 128 (68 magnitude, 60 complex/hybrid) datasets were acquired from 26 unique MR systems (12 GE, 7 Siemens, 7 Philips), at both 1.5T (10 MR systems) and 3T (16 MR systems) at 9 sites across the United States at approximately room temperature. Acquisition parameters are listed in Table 2.
Reconstruction and analysis: PDFF maps were generated using magnitude, complex, or hybrid fitting, assuming temperatures from 0°C to 40°C. $$$T_G$$$ was estimated using Eq. 1 and used in the temperature-corrected signal model.
To perform validation, the PDFF averaged in ROIs centered in the 12 vials was recorded for PDFF maps: (1) before correction, (2) after correction using Eq. 1, and (3) after correction using a temperature of 20°C (for the multi-center study). For each set of PDFF maps, the linear regression slope of a plot of MRI PDFF vs. true PDFF was calculated and slope difference (i.e., slope of the identity line [1.0] minus regression slope) was recorded for each dataset (Figure 2). The mean ($$$\mu$$$) and standard deviation ($$$\sigma$$$) of the slope differences before and after corrections were also calculated.
Results
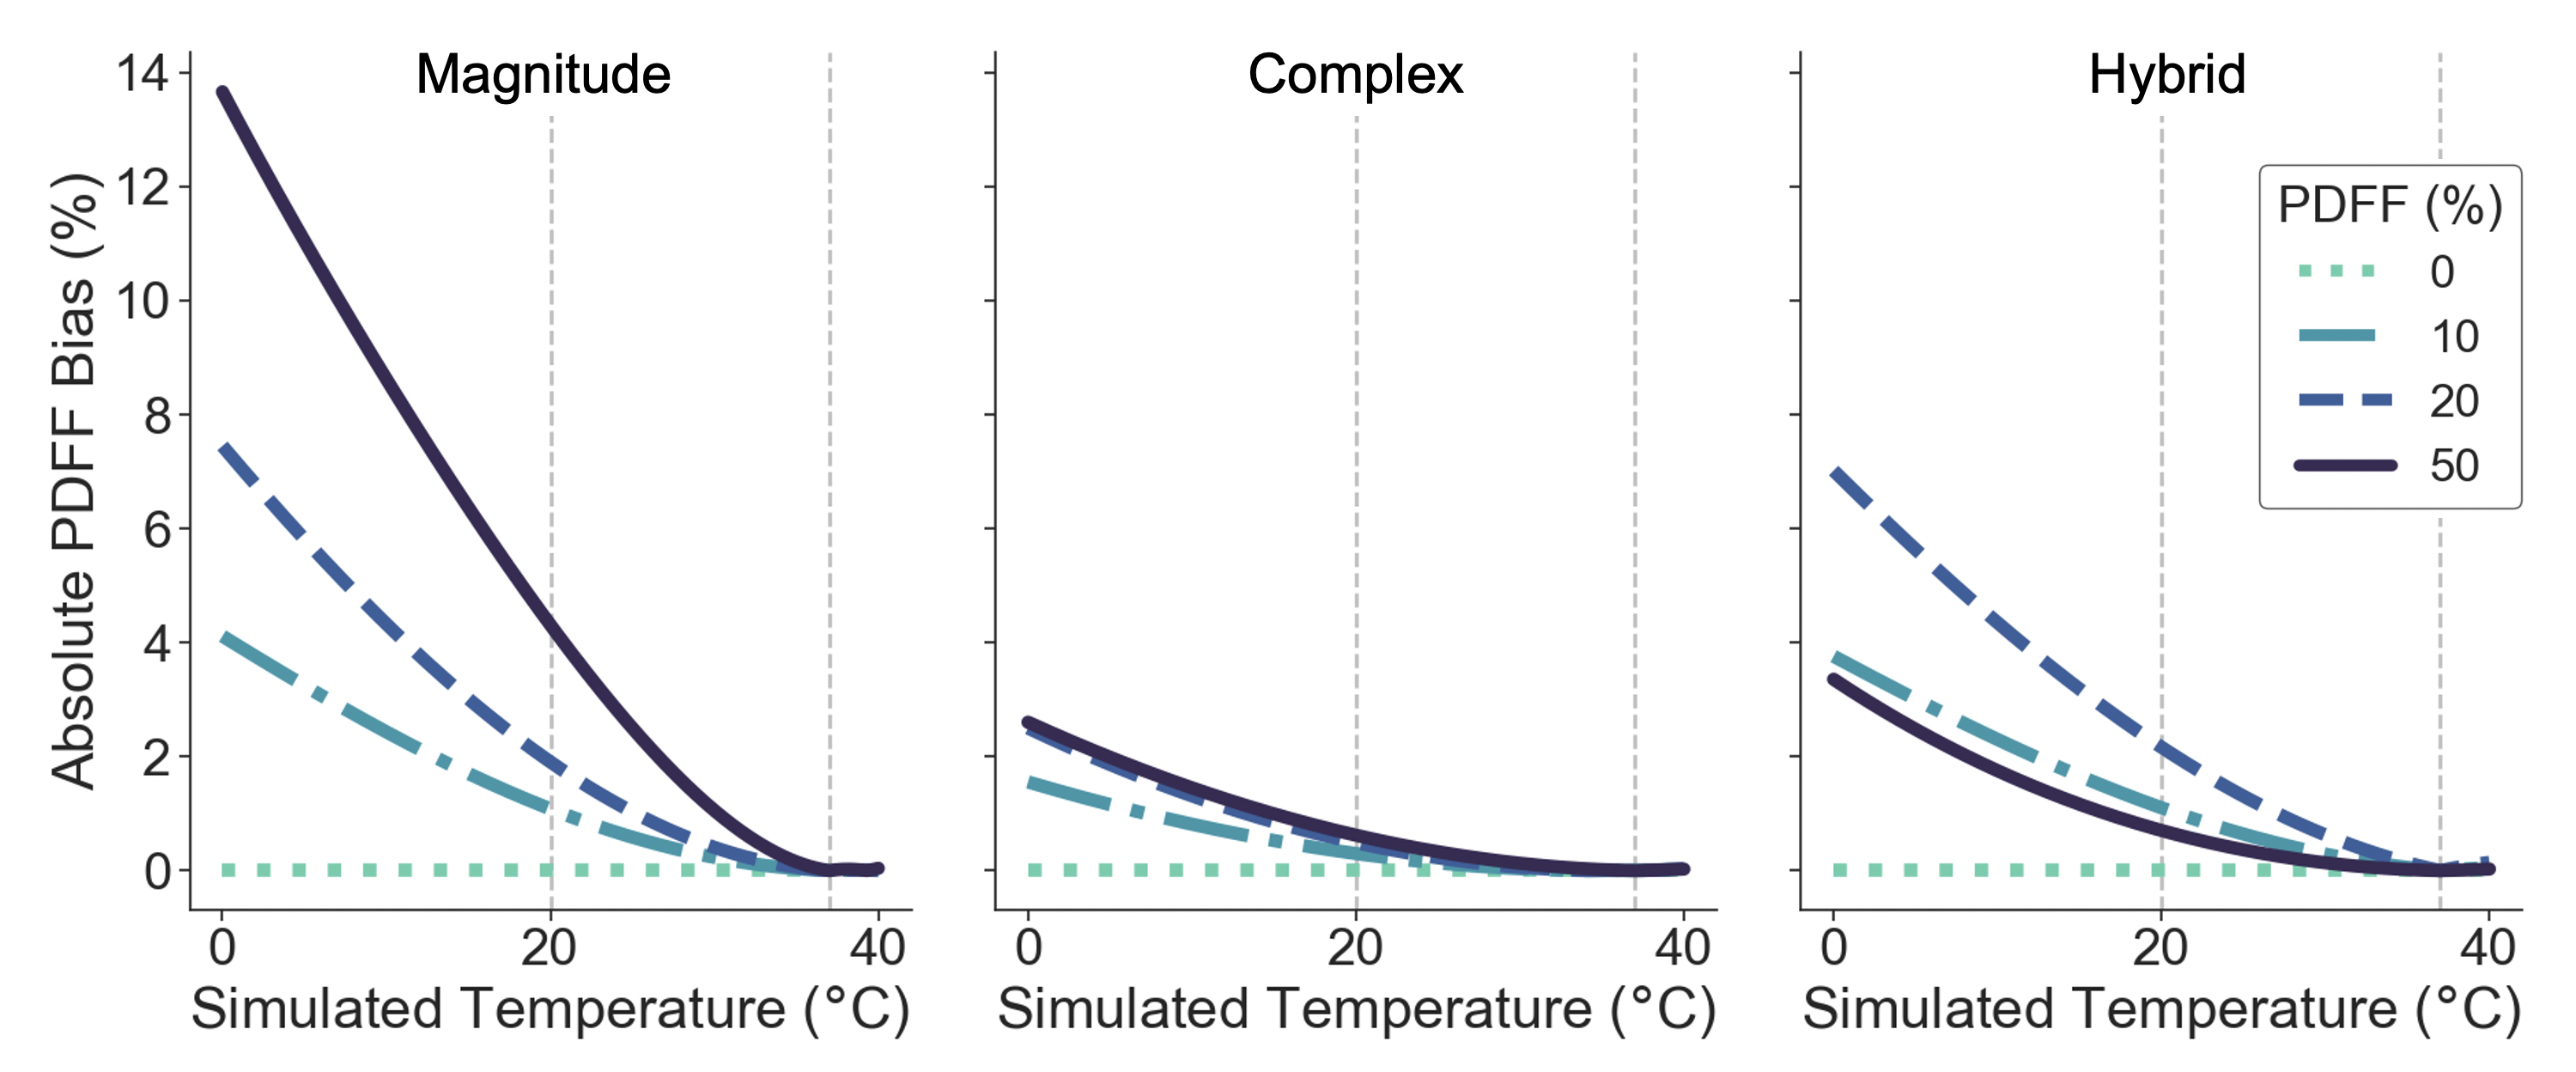
Simulations: 1.5T simulations demonstrate PDFF bias increases as the temperature deviates away from 37°C and at higher true PDFF as shown in Figure 1. Especially at PDFF approaching 50%, magnitude-based CSE-MRI has greater bias than complex/hybrid methods. Similar results are seen at 3T.Temperature-controlled phantom experiments: For the temperature-controlled experiments, slope difference is reduced using temperature correction, especially when the true temperature of the vials deviates further from body temperature and when using magnitude-based methods (Figure 2).
Multi-center phantom experiments: Temperature correction reduced overall PDFF bias and variability across acquisitions, as assessed by the slope difference (Figure 3). For magnitude-based CSE-MRI, temperature correction reduced the slope difference standard deviation from $$$\sigma=0.128$$$ to $$$\sigma=0.027$$$ using 20°C and $$$\sigma=0.042$$$ using $$$T_G$$$. Similar results were observed at a trend level for complex and hybrid fitting, though differences in standard deviation were generally less.
Discussion and Conclusions
In this work, we investigated the effects of temperature-correction using magnitude-, complex-, and hybrid-based CSE-MRI on the accuracy of PDFF estimation in phantoms. A correction based on automatically estimating a global phantom temperature was evaluated with simulations, temperature-controlled experiments, and a multi-center, multi-vendor phantom study. PDFF bias was reduced without any a priori information about the phantom temperature, especially in magnitude-based CSE-MRI. Complex and hybrid-based CSE-MRI are generally more robust to the effects of temperature and therefore saw less of a reduction of PDFF bias.Acknowledgements
The authors wish to acknowledge support from the NIH (R41 EB025729, R44 EB025729, R01 DK088925, K24 DK102595, R01 DK117354, R01 DK100651), as well as GE Healthcare who provides research support to the University of Wisconsin, and from Calimetrix for providing use of the phantom used in the multi-center study. Finally, Dr. Reeder is a Romnes Faculty Fellow, and has received an award provided by the University of Wisconsin-Madison Office of the Vice Chancellor for Research and Graduate Education with funding from the Wisconsin Alumni Research Foundation.References
- Yokoo T, Serai SD, Pirasteh A, et al. Linearity, Bias, and Precision of Hepatic Proton Density Fat Fraction Measurements by Using MR Imaging: A Meta-Analysis. Radiology. 2018;286(2):486-498. doi:10.1148/radiol.2017170550
- Kuroda K, Mulkern RV, Oshio K, et al. Temperature mapping using the water proton chemical shift: Self-referenced method with echo-planar spectroscopic imaging. Magn Reson Med. 2000;43(2):220-225
- Sprinkhuizen S, Konings M, Bom M, Viergever M, Bakker C, Bartels L. Temperature-Induced Tissue Susceptibility Changes Lead to Significant Temperature Errors in PRFS-Based MR Thermometry During Thermal Interventions. Magn Reson Med. 2010;64:1360-1372. doi:10.1002/mrm.22531
- Soher BJ, Wyatt C, Reeder SB, MacFall JR. Noninvasive temperature mapping with MRI using chemical shift water-fat separation. Magn Reson Med. 2010;63(5):1238-1246. doi:10.1002/mrm.22310
- Hernando D, Sharma SD, Kramer H, Reeder SB. On the confounding effect of temperature on chemical shift-encoded fat quantification. Magn Reson Med. 2014;72(2):464-470. doi:10.1002/mrm.24951
- Bydder M, Yokoo T, Hamilton G, et al. Relaxation effects in the quantification of fat using gradient echo imaging. Magn Reson Imaging. 2008;26(3):347-359. doi:10.1016/j.mri.2007.08.012
- Yu H, Shimakawa A, McKenzie CA, Brodsky E, Brittain JH, Reeder SB. Multiecho water-fat separation and simultaneous R2* estimation with multifrequency fat spectrum modeling. Magn Reson Med. 2008;60(5):1122-1134. doi:10.1002/mrm.21737
- Liu C-Y, McKenzie CA, Yu H, Brittain JH, Reeder SB. Fat quantification with IDEAL gradient echo imaging: Correction of bias from T1 and noise. Magn Reson Med. 2007;58(2):354-364. doi:10.1002/mrm.21301
- Yu H, Shimakawa A, Hines CDG, et al. Combination of Complex-Based and Magnitude-Based Multiecho Water-Fat Separation for Accurate Quantification of Fat-Fraction. Magn Reson Med. 2011;66(1):199-206. doi:10.1002/mrm.22840
- Navaratna R, Colgan TJ, Zhao R, et al. Multi-Center Phantom Validation of a Novel Method for Temperature Correction in PDFF Estimation using Magnitude Chemical Shift-Encoded MRI. In Proceedings of the 28th Annual Meeting of ISMRM. No. 1009. ; 2020.
- Hines CDG, Yu H, Shimakawa A, McKenzie CA, Brittain JH, Reeder SB. T1 independent, T2* corrected MRI with accurate spectral modeling for quantification of fat: Validation in a fat-water-SPIO phantom. J Magn Reson Imaging. 2009;30(5):1215-1222. doi:10.1002/jmri.21957
- Hu HH, Yokoo T, Hernando D, et al. Multi-Site, Multi-Vendor, and Multi-Platform Reproducibility and Accuracy of Quantitative Proton-Density Fat Fraction (PDFF) at 1.5 and 3 Tesla with a Standardized Spherical Phantom: Preliminary Results from a Study by the RSNA QIBA PDFF Committee. In Proc. Intl. Soc. Mag. Reson. Med. 1023.; 2019.
Figures
Figure
1. Absolute PDFF bias increases as temperature deviates away from the
assumed 37°C. Simulations show absolute PDFF bias as a function of simulated
temperature for four different true PDFF values with no temperature correction
at 1.5T using a) magnitude-based b) complex-based c) hybrid-based methods. Note
for hybrid methods, the PDFF bias is similar
to that
of complex methods at PDFFs near 50% and similar
to that
of magnitude methods otherwise due to how hybrid methods are defined.9
Similar results were seen at 3T.
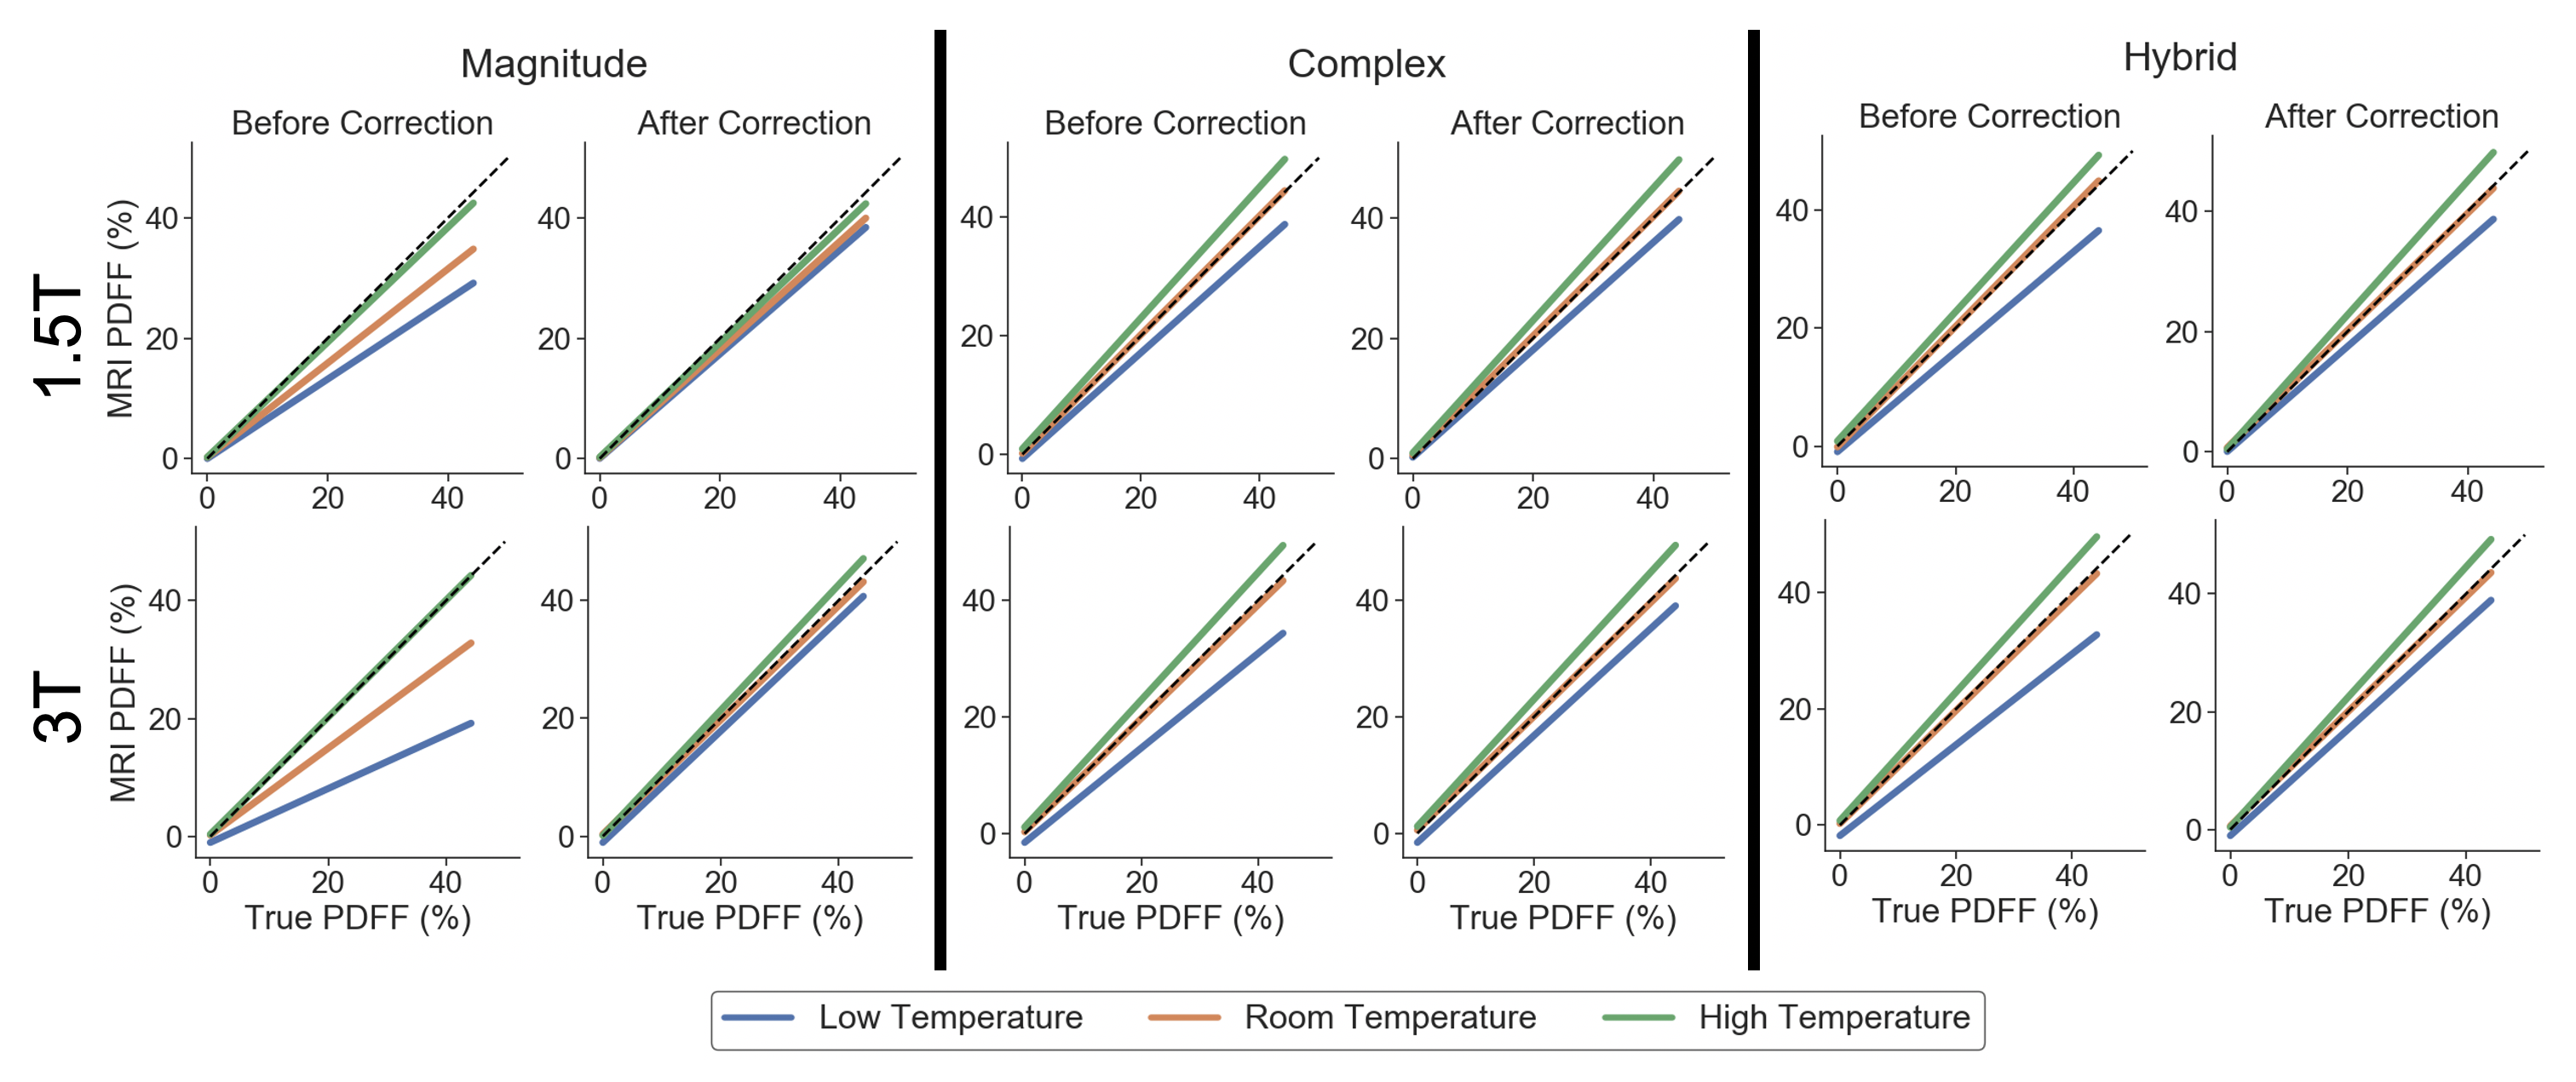
Figure
2. PDFF bias is reduced for all true phantom temperatures using the
proposed temperature-correction method. Linear regression plots of MRI PDFF as
a function of the true PDFF are shown for the temperature-controlled
experiments at 1.5T and 3T, before and after temperature correction, using
magnitude-based, complex-based, and hybrid-based methods. The identity line is plotted as a dashed line.
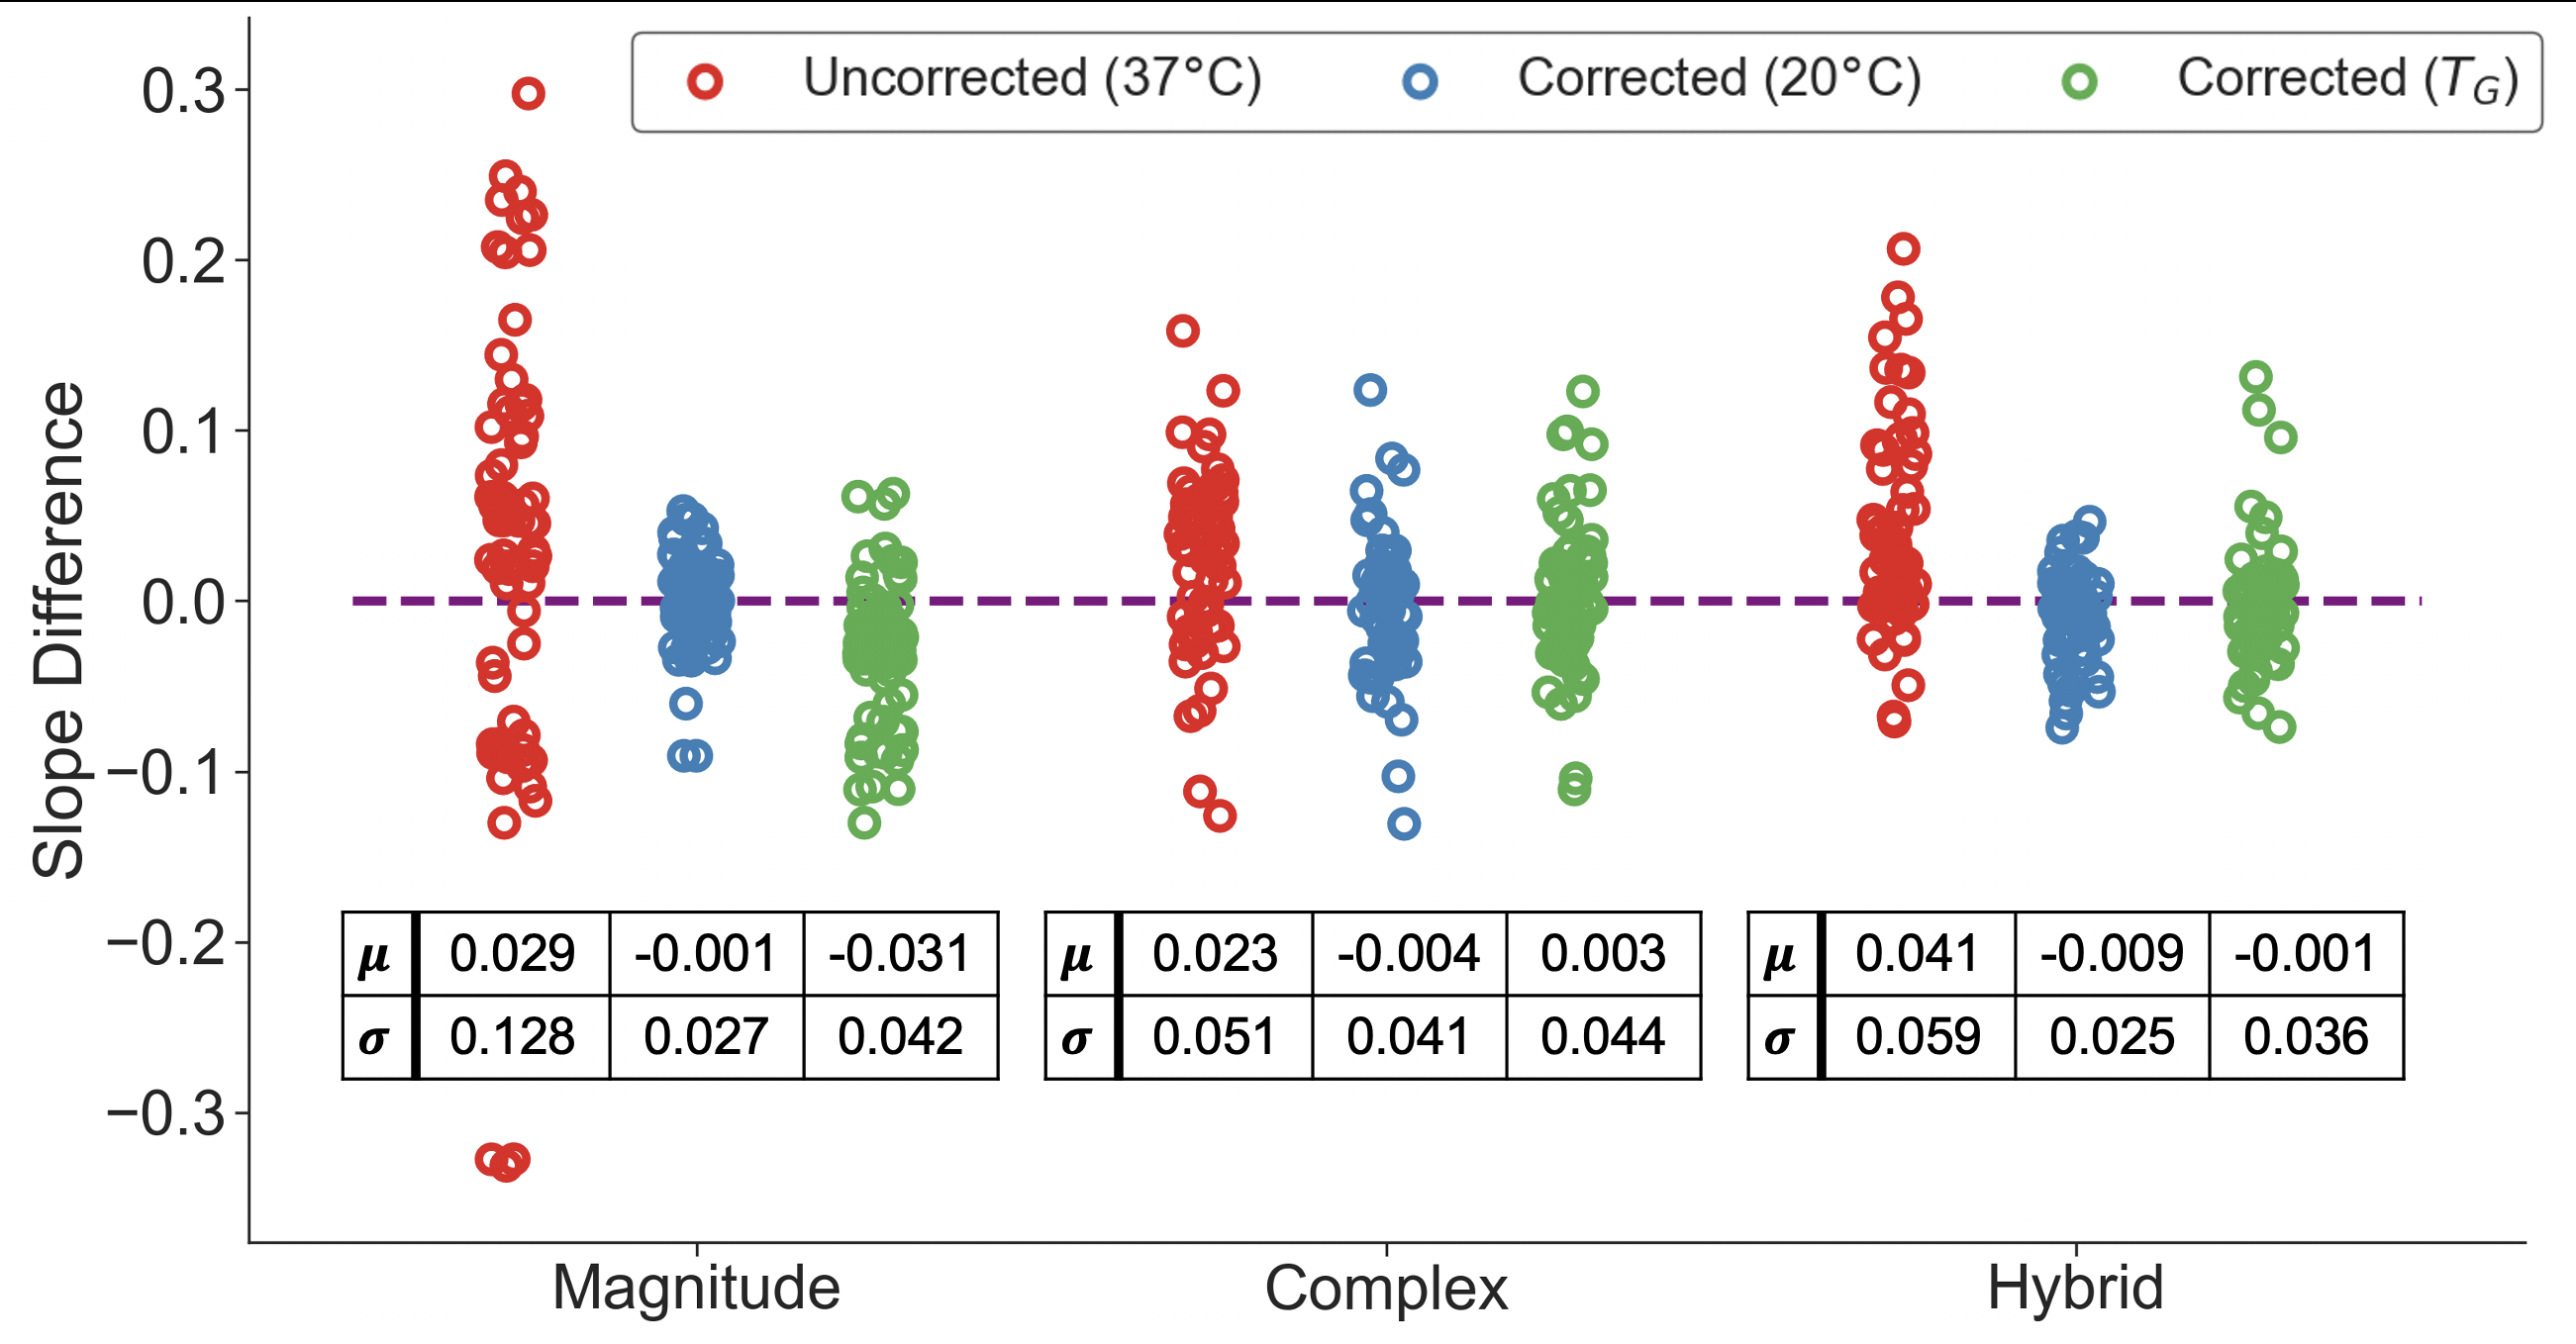
Figure
3. Slope differences for all scans from the QIBA study (acquired at room
temperature) are reduced using temperature-correction (using 20°C or the
automatically estimated temperature, TG)
compared to no correction. The mean (μ) and standard deviation (σ) of
the uncorrected and corrected slope differences are also shown.
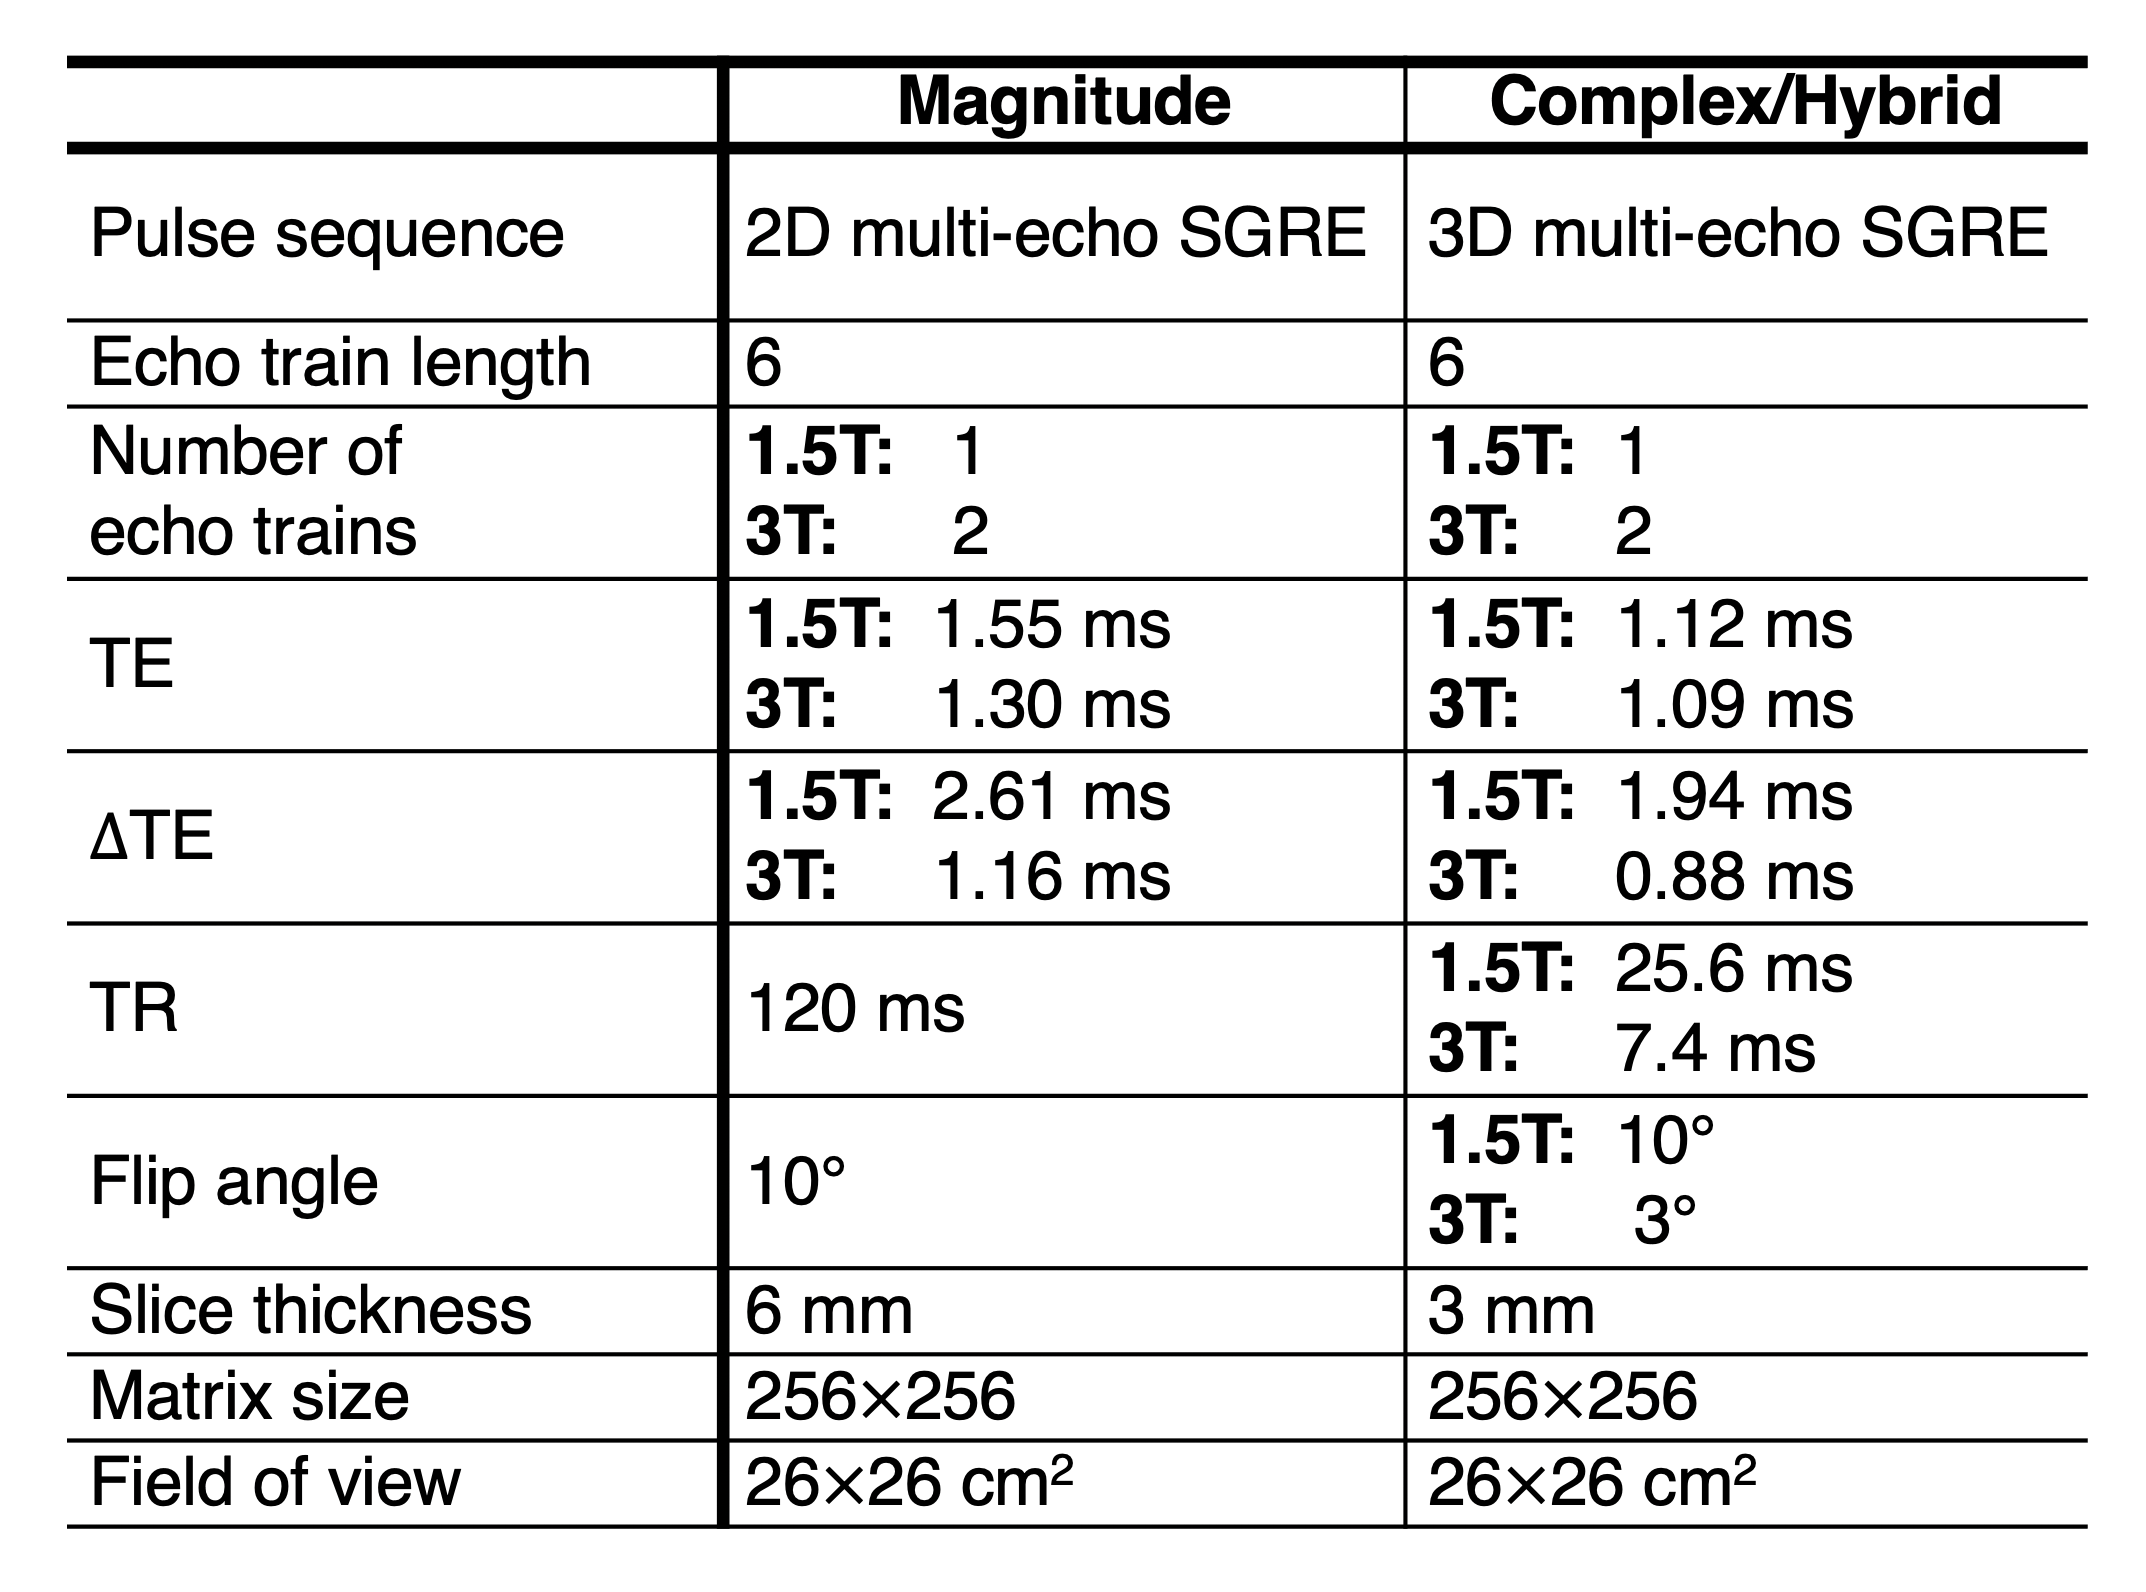
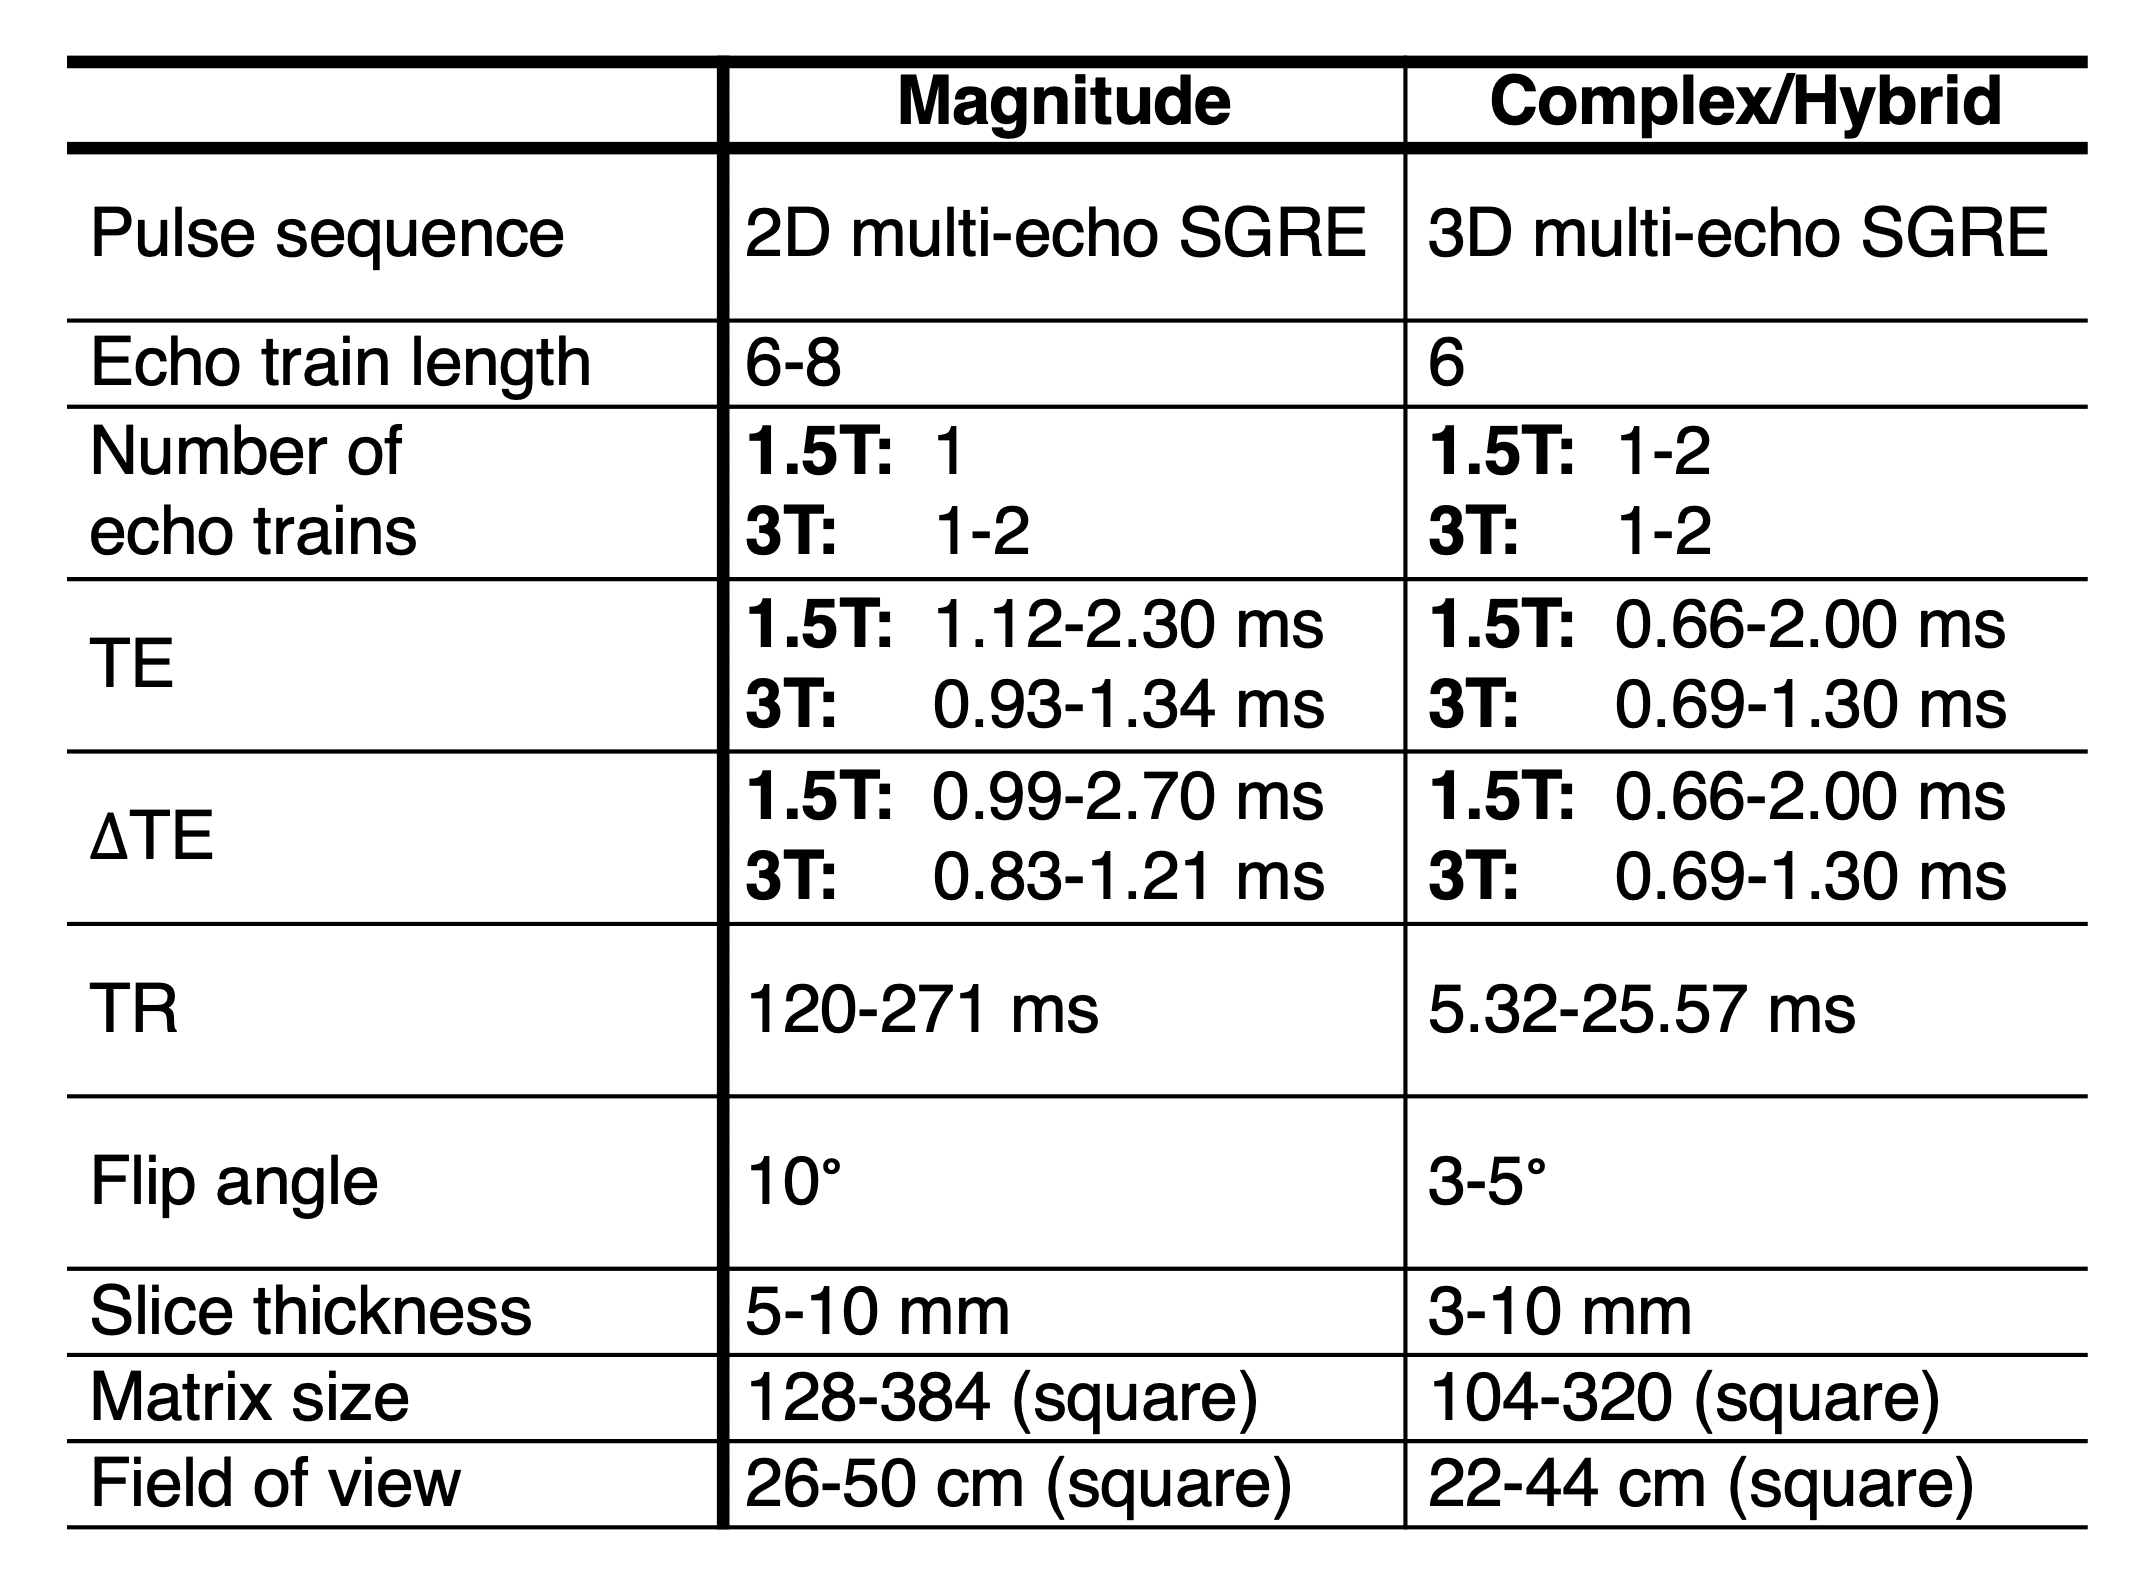
Table
1: Acquisition parameters for the temperature-controlled experiments. For all acquisitions, vials were oriented along B0.
Table
2: Summarized acquisition parameters for the QIBA multi-center study. For all acquisitions, vials were oriented along B0.