3859
3D FACT Sequence Based Proton Density Fat Fraction Combined with Marrow R2* for Osteopenia and Osteoporosis Assessment1Department of Radiology, Yueyang Hospital of Integrated Traditional Chinese and Western Medicine, Shanghai University of Traditional Chinese Medicine, Shanghai, China, 2Central Research Institute, United Imaging Healthcare, Shanghai, China, 3Shanghai Key Laboratory of Magnetic Resonance, School of Physics and Electronics Science, East China Normal University, Shanghai, China
Synopsis
Marrow proton density fat fraction (PDFF) and R2* at the lumbar spine in postmenopausal females of widely varying bone density were simultaneously measured with a 3D Fat Analysis & Calculation Technique (FACT) Sequence at 3.0T. Discrimination of osteopenia and osteoporosis can be improved with a combination of the PDFF and R2*.
Introduction
Marrow fat expansion has been suggested to be associated with osteoporosis, diabetes and related cardiovascular complications, etc1-3. Therefore, quantification of marrow fat content is promising to help with the diagnosis of such disease and evaluating therapeutic efficacy. Conventional marrow fat quantification method MR spectroscopy has its inherent limitations, such as technically demanding, time-consuming, and small volume coverage. Therefore, quantitative chemical shift-encoding based water-fat MRI is emerging to noninvasively evaluate marrow proton density fat fraction (PDFF), a promising quantitative imaging biomarker for estimating tissue fat concentration4,5. In addition, MRI-determined R2* mapping has been found to demonstrate promising results for the quantification of osteoporosis6,7. With multi-echo reconstruction technique, simultaneous water-fat decomposition and T2* decay can be achieved, which provides T2*-corrected PDFF estimation and fat-corrected R2* quantification8-10. In this study, we simultaneously measured marrow PDFF and R2* at the lumbar spine in postmenopausal females with widely varying bone density and evaluated the diagnostic performance of combining PDFF and R2* for predicting osteopenia and osteoporosis using a 3D Fat Analysis & Calculation Technique (FACT) sequence at 3.0T.Methods
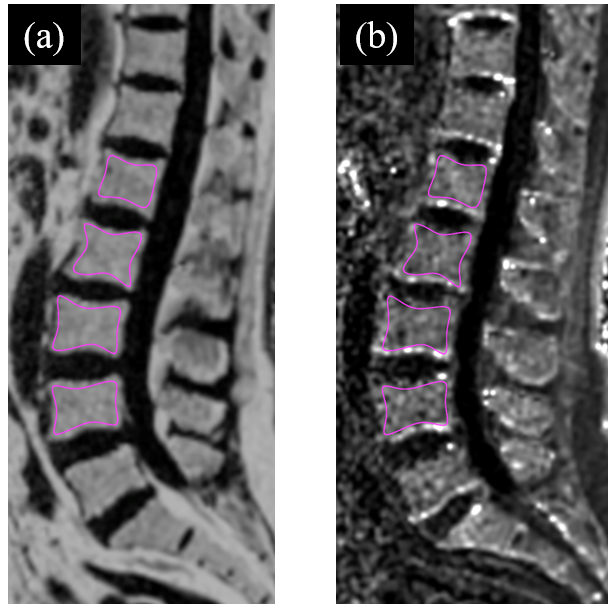
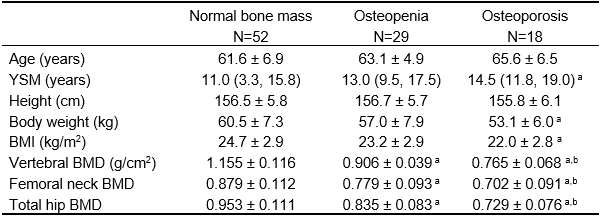
Ninety-nine postmenopausal women (mean age 62.8, standard deviation [SD], 6.4; range, 50-82.6) were included in this study, including 52 normal bone mass, 29 osteopenia and 18 osteoporosis. Age, years since menopause (YSM), height and weight were collected for each subject. Bone mineral density (BMD) of the total hip, femoral neck and lumbar spine (L1-L4) was determined in all participants by dual-energy X-ray absorptiometry (DXA, Prodigy Lunar; GE Healthcare, Waukesha, WI, USA). Based on the DXA BMD T-scores, the participants were categorized into those with normal bone mass (T-score ≥ –1.0 SD), osteopenia (T-score between –2.5 and –1.0 SD) and osteoporosis (T-score ≤ –2.5 SD) using the WHO classification11. All participants underwent MRI examination the same day as BMD measurements. MRI was performed on a 3.0T scanner (uMR 780, United Imaging Healthcare, Shanghai, China). Chemical-shift water-fat images were acquired by a 3D gradient recalled echo (GRE) FACT sequence. The imaging parameters were as following: bipolar readouts and flyback gradients; TR=13.67ms; 6 TEs (TEinit=1.76ms; ∆TE=1.5ms); flip angle=3°; field of view (FOV)=400 × 200 mm, matrix = 256 × 256, slice=3mm. The PDFF and R2* maps were automatically generated from FACT images on a postprocessing workstation from the 6echo-FACT examination. Vertebral bone marrow PDFF was calculated as the average measurements of four regions of interest (ROIs) (Figure 1). To assess the inter-observer and intra-observer reliability, two raters independently analyzed all the PDFF and R2* maps, and two measurements of the primary rater on two separate occasions 2 months apart were compared. Both the observers were blinded to the results obtained earlier. Statistical analysis including Shapiro-Wilks test, one-way ANOVA, Bonferroni post-hoc multiple comparisons, Kruskal-Wallis test with Bonferroni correction and Pearson’s correlation test was performed with SPSS (v.26) and MedCalc (v.11.4). Intra-class correlation coefficient (ICC) was utilized to test inter-observer and intra-observer reliability. Odds ratio (OR) and area under the receiver operating characteristic curve (AUC) were also evaluated.Results
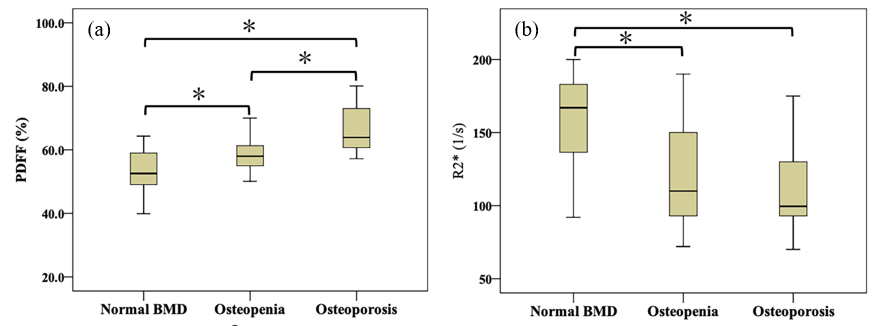
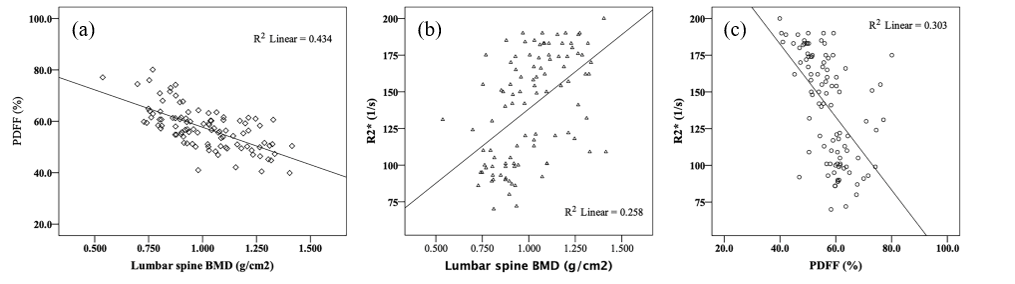
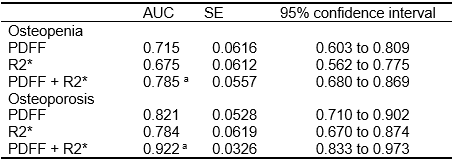
As shown in Table 1, there were no significant differences in age and height among different groups with varying BMD. There were significant differences in the average PDFF among the three groups even after adjustment for age, YSM and BMI. Subjects with osteopenia and osteoporosis had lower R2* values than that of normal bone mass (all P < 0.01) (Figure 2). BMD had a moderate inverse correlation with PDFF (r=﹣0.659) but a positive association with R2* (r=0.508, all P<0.001). There was a significantly negative correlation between the PDFF and R2* (r=﹣0.551, P<0.001) (Figure 3). Each SD higher marrow PDFF and R2* were statistically significant to predict the nature of osteopenia and osteoporosis adjusted for age, YSM and BMI (PDFF: OR 2.851, 95% CI 1.411-5.759, P = 0.003; R2*: OR 0.413, 95% CI 0.226-0.755, P = 0.004). The AUCs for the PDFF for the prediction of osteopenic and osteoporotic subjects were 0.715 (SE 0.062) and 0.821 (SE 0.053), respectively. R2* shows AUC of 0.675 (SE 0.061) for osteopenia and AUC of 0.784 (SE 0.062) for osteoporosis, and did not differ significantly from PDFF according to the Hanley-McNeil test. Discrimination of postmenopausal women with osteoporosis from normal bone mass was improved when vertebral R2* rate was added to PDFF (P<0.05). Similar results were obtained to differentiate osteopenia from healthy controls as shown in Table 2.Discussion
It is found FACT sequence has excellent reliability for R2* measurements across readers. The results are consistent with the existing literature that showed a positive correlation between marrow R2* and BMD, and a negative association between marrow PDFF and BMD14-16. It is shown the R2* map can be employed to assess osteopenia and osteoporosis, and Simultaneous estimation of marrow R2* and PDFF improve identification of low bone mass in clinical practice.Conclusion
Simultaneous measurements of PDFF and R2* in the bone marrow based on chemical shift–encoded FACT sequence have shown great promise as quantitative imaging biomarkers for osteoporosis assessment. Discrimination of osteopenia and osteoporosis from controls may be improved when marrow PDFF is combined with R2* value.Acknowledgements
This study was funded by the Shanghai Health and Family Planning Commission (201840034), National Natural Science Foundation of China (81874497), and Project within Budget of Shanghai University of Traditional Chinese Medicine (2019LK027).References
1. Pham TT, Ivaska KK, Hannukainen JC, et al. Human Bone Marrow Adipose Tissue is a Metabolically Active and Insulin-Sensitive Distinct Fat Depot. J Clin Endocrinol Metab 2020;105: dgaa216.
2. Martel D, Leporq B, Bruno M, Regatte RR, Honig S, Chang G. Chemical shift-encoded MRI for assessment of bone marrow adipose tissue fat composition: Pilot study in premenopausal versus postmenopausal women. Magn Reson Imaging 2018;53:148-155.
3. Santopaolo M, Gu Y, Spinetti G, Madeddu P. Bone marrow fat: friend or foe in people with diabetes mellitus? Clin Sci (Lond) 2020;134:1031-1048.
4. Schmeel FC, Vomweg T, Traber F, et al. Proton density fat fraction MRI of vertebral bone marrow: Accuracy, repeatability, and reproducibility among readers, field strengths, and imaging platforms. J Magn Reson Imaging 2019;50:1762-1772.
5. Kim HJ, Cho HJ, Kim B, et al. Accuracy and precision of proton density fat fraction measurement across field strengths and scan intervals: A phantom and human study. J Magn Reson Imaging 2019;50:305-314.
6. Wehrli FW, Ford JC, Haddad JG. Osteoporosis: clinical assessment with quantitative MR imaging in diagnosis. Radiology 1995;196:631-641.
7. Wehrli FW, Hilaire L, Fernandez-Seara M, et al. Quantitative magnetic resonance imaging in the calcaneus and femur of women with varying degrees of osteopenia and vertebral deformity status. J Bone Miner Res 2002;17:2265-2273.
8. Schmeel FC, Luetkens JA, Enkirch SJ, et al. Proton density fat fraction (PDFF) MR imaging for differentiation of acute benign and neoplastic compression fractures of the spine. Eur Radiol 2018;28:5001-5009.
9. Karampinos DC, Ruschke S, Dieckmeyer M, et al. Modeling of T2 * decay in vertebral bone marrow fat quantification. NMR Biomed 2015;28:1535-1542.
10. Ergen FB, Gulal G, Yildiz AE, Celik A, Karakaya J, Aydingoz U. Fat fraction estimation of the vertebrae in females using the T2*-IDEAL technique in detection of reduced bone mineralization level: comparison with bone mineral densitometry. J Comput Assist Tomogr 2014;38:320-324.
11. Zebaze R, Osima M, Bui M, et al. Adding Marrow Adiposity and Cortical Porosity to Femoral Neck Areal Bone Mineral Density Improves the Discrimination of Women With Nonvertebral Fractures From Controls. J Bone Miner Res 2019;34:1451-1460.
Figures