3854
Breathing-induced B0 fluctuations bias proton density fat fraction and T2* mapping of brown adipose tissue in the supraclavicular fossa1Department of Diagnostic and Interventional Radiology, School of Medicine, Technical University of Munich, Munich, Germany, 2Division of Infectious Diseases and Tropical Medicine, University Hospital, LMU Munich, Munich, Germany, 3Philips Research Lab, Hamburg, Germany, 4Division of Endocrinology and Einthoven Laboratory for Experimental Vascular Medicine, Department of Medicine, Leiden University Medical Center, Leiden, Netherlands, 5Department of Radiology, C.J. Gorter Center for High Field MRI, Leiden University Medical Center, Leiden, Netherlands, 6Philips Healthcare, Hamburg, Germany, 7Else Kröner Fresenius Center for Nutritional Medicine, School of Life Sciences, Technical University of Munich, Munich, Germany, 8Institute for Nutritional Medicine, School of Medicine, Technical University of Munich, Munich, Germany
Synopsis
Proton density fat fraction and T2* mapping have been used to characterize fat tissue in the human supraclavicular fossa with the aim of detecting brown adipose tissue and its response to activation by changes of the two. However, chemical shift encoding-based water-fat separation in that region has been primarily performed in free-breathing mode. The present work reports on breathing-induced B0 fluctuations in the human supraclavicular fossa, and the severe bias introduced on both PDFF and T2* quantification, as shown with simulated B0 fluctuation effects. The effect of respiratory triggering on artefact reduction is investigated in a cohort of 13 volunteers.
Purpose
In the pursuit of understanding the role of brown adipose tissue (BAT) in humans various MR methods have been applied1. Mapping the proton density fat fraction (PDFF) and T2* relaxation have become very popular methods due to their wide availability despite inconclusive findings of whether or not BAT presence can be detected. Recent publications suggested that in the process of BAT activation some voxels are predominantly decreasing in PDFF, representing beta oxidation of fat, while other areas show increasing PDFF behavior, which may be attributed to glucose uptake and neogenesis of fat2,3. The importance of the underlying fat model and the number of sampled echo times, especially for T2* mapping in the supraclavicular fossa has been investigated before4. In addition to potential tissue displacement of the scanned ROI, significant influence from breathing-induced B fluctuations can be expected, as previously reported from T2* mapping or spectroscopy in the brain, the breast and the cervical spinal cord5-7. In MR scans of body parts that are known to be severely affected by motion, such as abdominal scans, the k-space is sampled irregularly to reduce ghost artefacts, with the drawback of a more blurred image. However, to track down above mentioned local changes of PDFF a high spatial resolution is favorable. The majority of studies reporting on PDFF and T2* values in the BAT region do free breathing scans without considering respiratory motion. Two publications implemented breath-hold scans. However, one used stacks of 2D slices with a large slice thickness of 7.5mm8, and the other acquired only 2-point Dixon data in 3D in several breath-holds9. At the same time, the impact of B0 fluctuations on T2* mapping in regions such as the brain and the neck has been corrected by exploiting the coil consistency properties5,10. Here, we investigate the influence of B0 fluctuations in the context of imaging with chemical-shift separation for PDFF and T2* estimation in regions containing BAT.Methods
All scans were performed on a 3T system(Ingenia Elition/Philips/Netherlands) in supine position. Image reconstruction, analysis and simulations were performed using MATLAB(TheMathWorks) and ReconFrame(GyroTools LLC/Switzerland). The field mapping procedure was done according to11 and the chemical shift encoding-based water-fat separation was done according to12.B0 fluctuation quantification: Both the breathing-induced tissue displacement and B0 fluctuation were investigated by acquiring a low resolution 2DGRE consecutively for 60 seconds in two subjects (0.3sec/frame, TE=5ms). Scans were acquired in axial, and coronal plane and the magnitude and phase image evolution were assessed within the FOV typically included during BAT imaging.
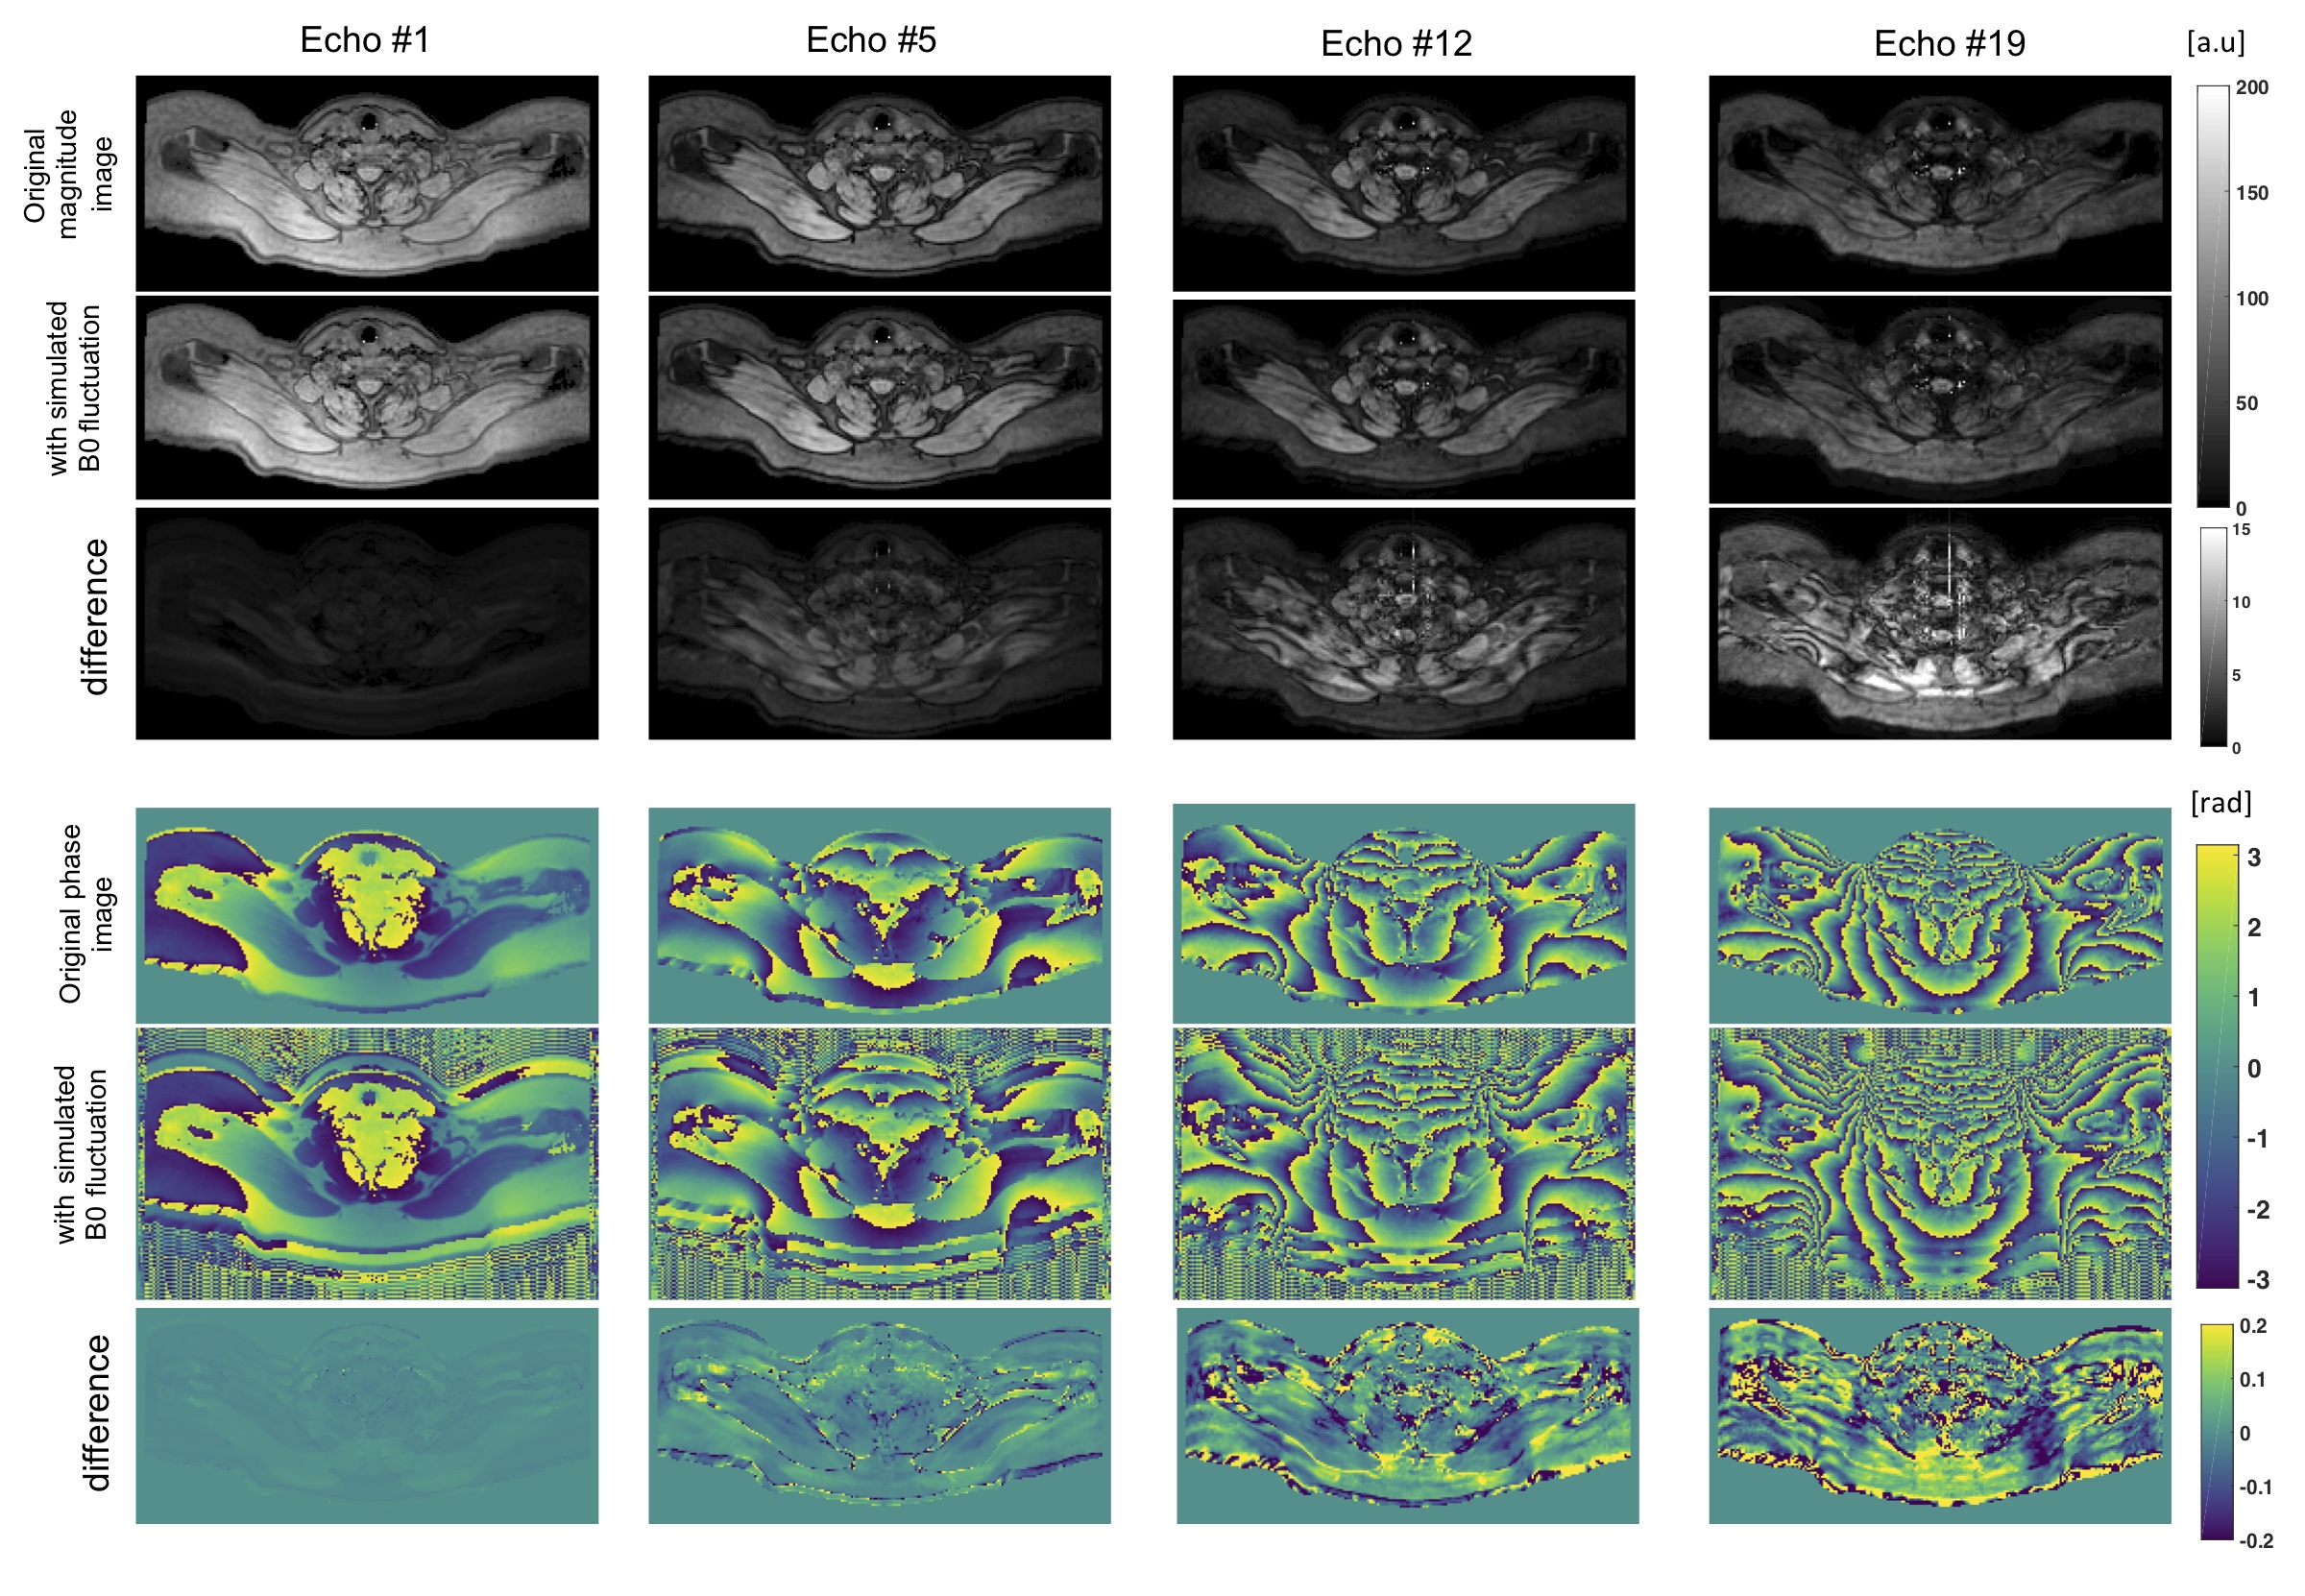
Simulations: A respiratory triggered 20 echo scan served as the basis for the simulation. After reconstructing PDFF and T2* values by fitting to the measured signal, artificial echo images were generated based on the fitted parameters. All echo images were then transformed into k-space where the influence of B0 fluctuations was simulated by adding a sinusoidal phase evolution, with a periodicity of 15min-1 and a spatially constant B0. The k-space profile order was ky, kz, with kz being the inner loop.
Study: In total 13 healthy subjects were scanned once with and once without respiratory triggering. A 3D monopolar time-interleaved GRE sequence was used with TR/TE1/deltaTE(ms)=26/1.5/1.0, flip angle=5°, TFE factor=40, FOV(LRxAPxFH)=400x300x80mm, acquisition voxel size=2mm isotropic, SENSE(AP)=2.5.
Results
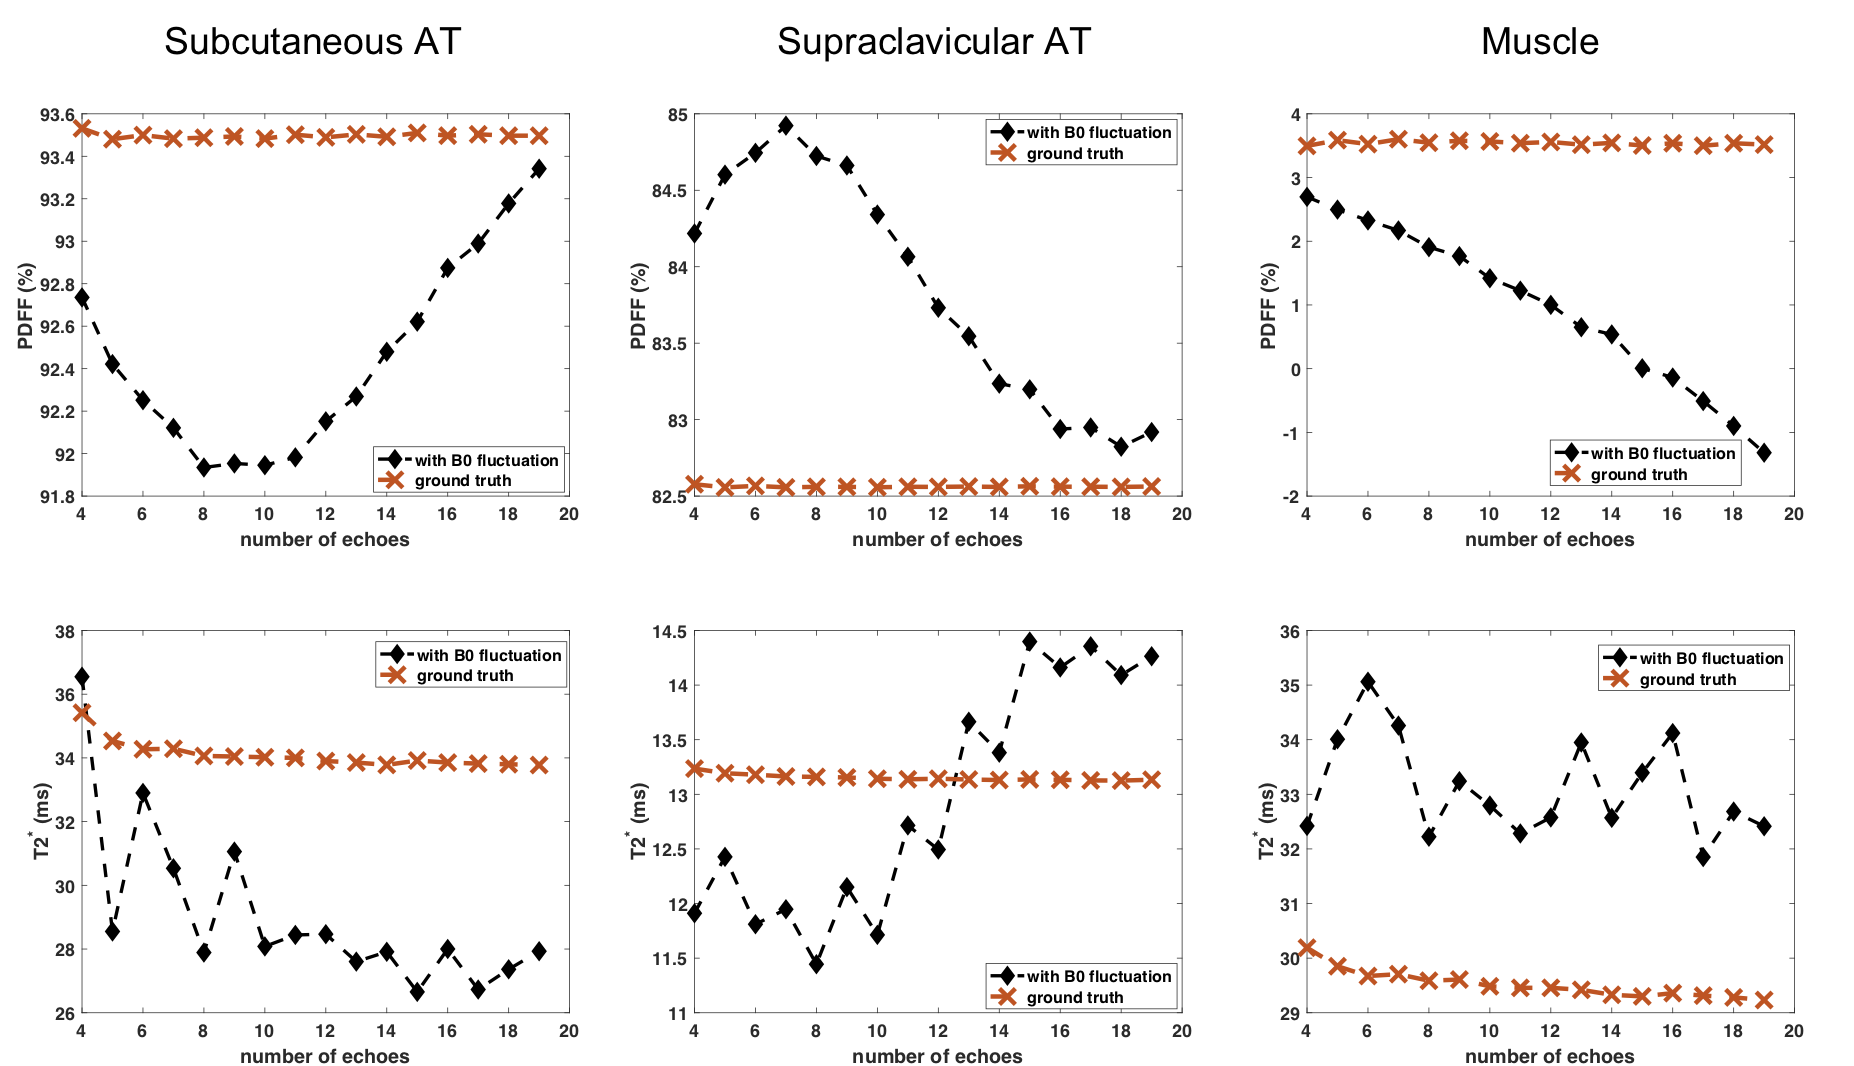
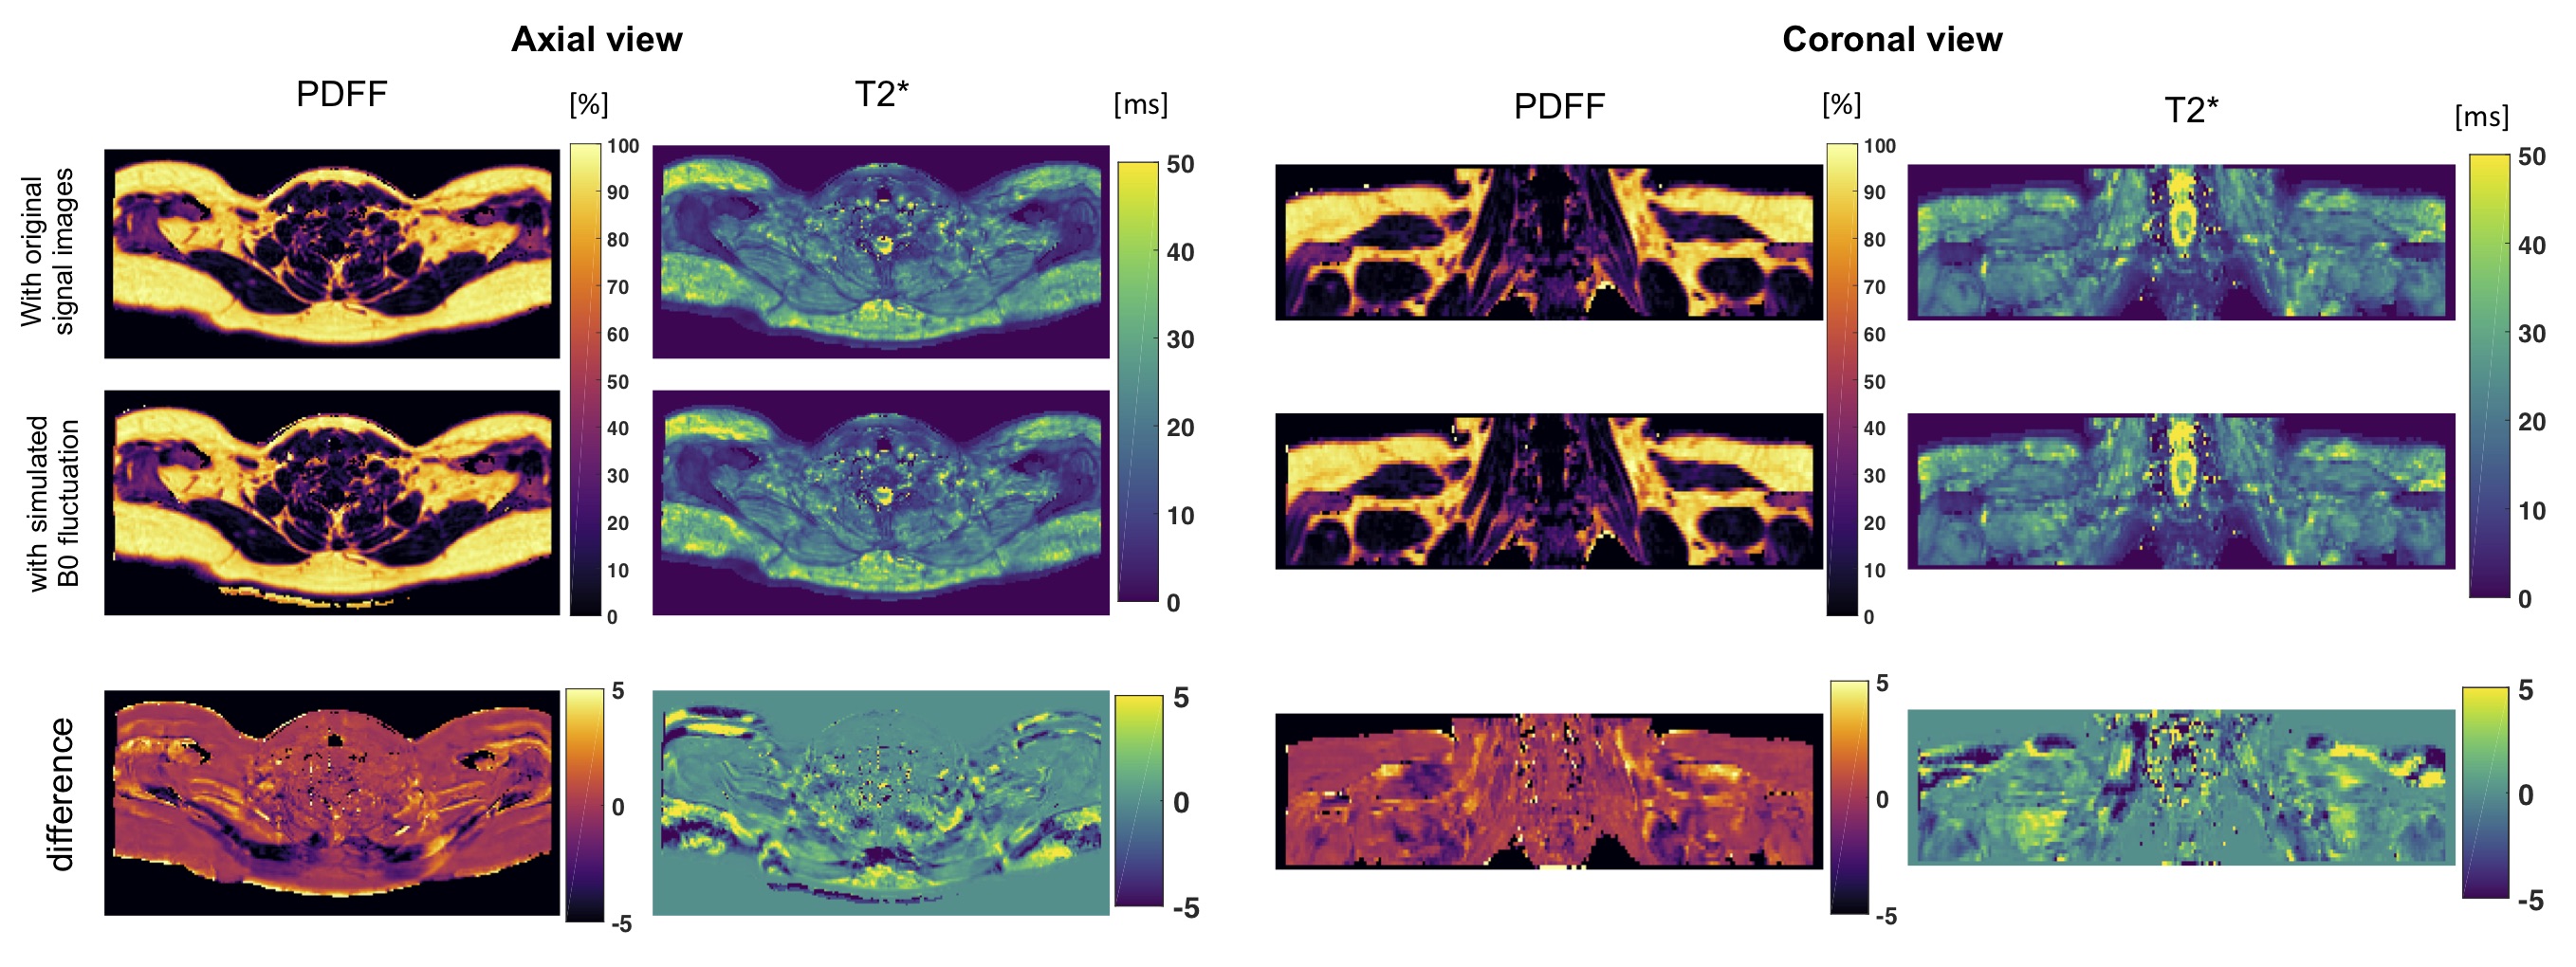
B0 fluctuation quantification: The multi-frame magnitude images suggested in both subjects that only minor anterior parts of the image including tissues close to the sternum up to the throat were moving synchronously with breathing. Regarding the B0 evolution with time, a peak-to-peak amplitude of above 25Hz was observed in regions close to the lung apex(Fig.1). The peak B0 amplitude decreased with distance to the origin of susceptibility variations as it follows the shape of dipoles. Yet, a peak-to-peak amplitude of 12Hz in cervical muscle tissue at the height of the vocal cords is still observed.Simulations: B0 fluctuations affect both magnitude and phase images of individual echo images(Fig.2), with increasing deviation from the ground truth signal for increasing TE. Therefore, a location-dependent bias is introduced for PDFF and T2* quantification depending on the fitted number of echoes(Fig.3). Even if qualitatively, the PDFF and T2* maps do not differ, significant quantitative deviations can be observed(Fig.4).
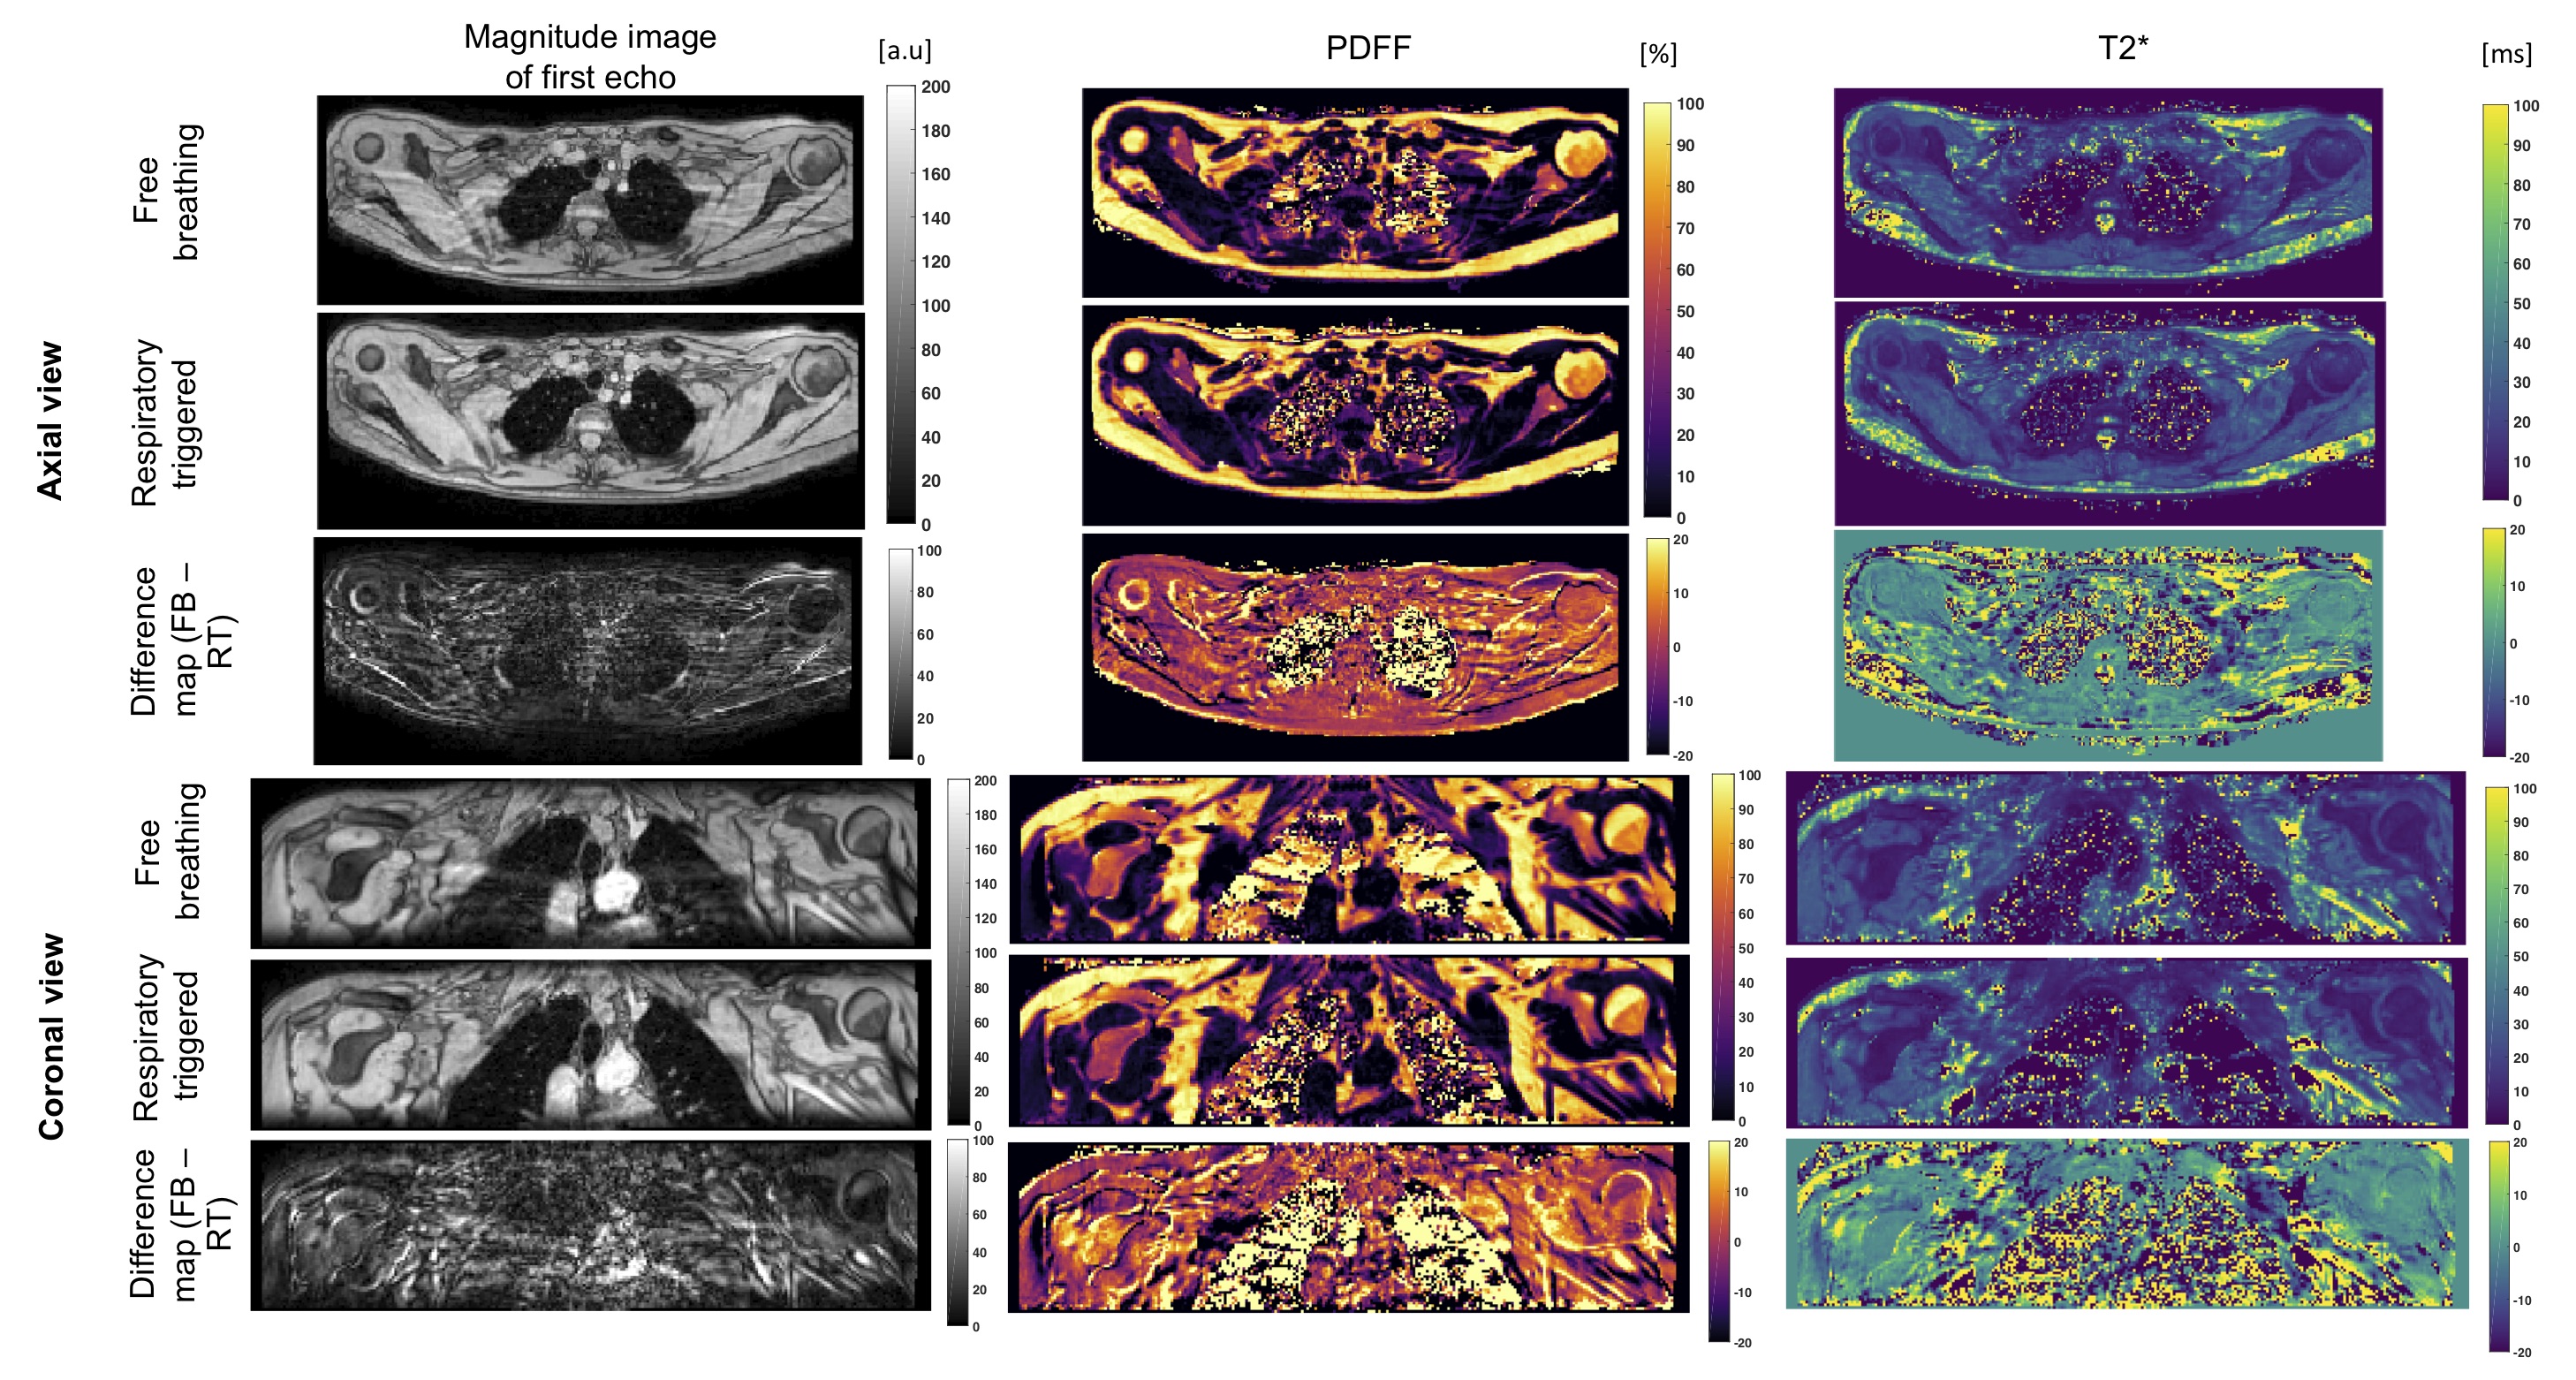
Study: Despite the non-linear sampling pattern (a radial ordering of ky/kz lines in the cartesian sampling was chosen), artefacts were seen in all 13 subjects, which were observed as signal replications in phase encode direction, and can be prevented by respiratory triggering(Fig.5).
Discussion
Respiratory triggering eliminates ghosting artefacts due to tissue displacement and reduces B0 fluctuation effects, and thus mitigates quantification errors for both PDFF and T2* mapping in the supraclavicular region. Later echoes are more affected by B0 fluctuation, but are crucial for stable T2* estimation, which makes this parameter inherently sensitive to B0 fluctuations. However, facing the need for a high temporal resolution, particularly during activation studies, more efficient sampling schemes would be desired.Conclusion
A mixture of tissue displacement and B0 fluctuations in the human supraclavicular fossa cause ghosting artefacts that affect both PDFF and T2* quantification. Respiratory triggering mitigates these artefacts at the cost of a longer scan time. However, residual B0 fluctuations after triggering may still affect T2* estimation as later echoes are more affected.Acknowledgements
The present work was supported by the European Research Council (grant agreement No 677661, ProFatMRI), the German Research Foundation (SFB824/A9) and Philips Healthcare. This work reflects only the authors view and the funders are not responsible for any use that may be made of the information it contains. The authors thank Christof Boehm and Sophia Kronthaler for technical support.References
1. Wu M, Junker D, Branca RT, Karampinos DC. Magnetic Resonance Imaging Techniques for Brown Adipose Tissue Detection. Front Endocrinol (Lausanne). 2020;11:421.
2. Coolbaugh CL, Damon BM, Bush EC, Welch EB, Towse TF. Cold exposure induces dynamic, heterogeneous alterations in human brown adipose tissue lipid content. Sci Rep. 2019;9(1):13600.
3. Abreu-Vieira G, Sardjoe Mishre ASD, Burakiewicz J, Janssen LGM, Nahon KJ, van der Eijk JA, et al. Human Brown Adipose Tissue Estimated With Magnetic Resonance Imaging Undergoes Changes in Composition After Cold Exposure: An in vivo MRI Study in Healthy Volunteers. Front Endocrinol (Lausanne). 2019;10:898.
4. Franz D, Diefenbach MN, Treibel F, Weidlich D, Syvari J, Ruschke S, et al. Differentiating supraclavicular from gluteal adipose tissue based on simultaneous PDFF and T2 * mapping using a 20-echo gradient-echo acquisition. J Magn Reson Imaging. 2019;50(2):424-34.
5. Meineke J, Nielsen T. Data consistency-driven determination of B 0 -fluctuations in gradient-echo MRI. Magn Reson Med. 2019;81(5):3046-55.
6. Boer VO, van de Bank BL, van Vliet G, Luijten PR, Klomp DW. Direct B0 field monitoring and real-time B0 field updating in the human breast at 7 Tesla. Magn Reson Med. 2012;67(2):586-91.
7. Vannesjo SJ, Miller KL, Clare S, Tracey I. Spatiotemporal characterization of breathing-induced B0 field fluctuations in the cervical spinal cord at 7T. Neuroimage. 2018;167:191-202.
8. Gifford A, Towse TF, Walker RC, Avison MJ, Welch EB. Characterizing active and inactive brown adipose tissue in adult humans using PET-CT and MR imaging. Am J Physiol Endocrinol Metab. 2016;311(1):E95-E104.
9. Stahl V, Maier F, Freitag MT, Floca RO, Berger MC, Umathum R, et al. In vivo assessment of cold stimulation effects on the fat fraction of brown adipose tissue using DIXON MRI. J Magn Reson Imaging. 2017;45(2):369-80.
10. Meineke J, Nielsen T, editors. Data Consistency Driven Correction of B0-Fluctuations in 2D and 3D Gradient-Echo MRI of the Spine. Proceedings of 27th Int Society for Magnetic Resonance in Medicine; 2019; Montréal, Canada.
11. Boehm C, Diefenbach MN, Makowski MR, Karampinos DC. Improved body quantitative susceptibility mapping by using a variable-layer single-min-cut graph-cut for field-mapping. Magn Reson Med. 2021;85(3):1697-712.
12. Diefenbach MN, Liu C, Karampinos DC. Generalized parameter estimation in multi-echo gradient-echo-based chemical species separation. Quant Imaging Med Surg. 2020;10(3):554-67.
Figures