3853
Fatty acid composition quantification in bone marrow at 7 T: method comparison and in vivo feasibility1Medical Radiation Physics, Department of Translational Medicine, Lund University, Malmo, Sweden, 2Medical Imaging and Physiology, Skane University Hospital, Lund, Sweden, 3Orthopaedics, Department of Clinical Sciences Lund, Lund University, Lund, Sweden
Synopsis
Chemical shift-encoded magnetic resonance imaging may be used to estimate the fatty acid composition (FAC) of bone marrow adipose tissue (BMAT), and the method may benefit from the improved spectral resolution at ultra-high field strength. In this work, the in vivo feasibility of FAC quantification in BMAT at 7 T was investigated, and simulations were used to determine the optimal image acquisition parameters and reconstruction model. The study showed that using a short inter-echo time, FAC quantification in BMAT was feasible and robust at 7 T, and that the noise performance might be improved using a constrained reconstruction model.
Introduction
The bone marrow adipose tissue (BMAT) has unique properties compared to white adipose tissue (WAT), and its fatty acid composition (FAC) has been linked to e.g. bone frailty1,2 and osteoarthritis3,4. Chemical shift-encoded magnetic resonance imaging (CSE-MRI) may be used to estimate FAC in terms of the number of double bonds (ndb), number of methylene-interrupted double bonds and chain length5-8, which can be used to calculate the fractions of saturated (SFA), monounsaturated and polyunsaturated fatty acids6.A strong correlation has been demonstrated to gas chromatography in WAT9, but the shorter T2* of BMAT may make FAC estimation more challenging in this tissue. Therefore, the method’s performance in BMAT can be different compared to WAT and require different optimal image acquisition parameters and reconstruction model. Furthermore, CSE-MRI of BMAT may benefit from the improved spectral resolution at ultra-high field strength but has previously only been attempted at 3 T10,11.
The aim of this pilot study is to investigate the feasibility of FAC quantification in BMAT at 7 T in the knee of healthy volunteers. Both simulations and an in vivo experiment were used to compare two reconstruction models and find optimal image acquisition parameters.
Method
FAC-quantificationFor both in vivo and simulated data, two FAC reconstruction models were compared estimating 1: both ndb and number of methylene-interrupted double bonds (free model), or 2: ndb only (constrained model), using an in-house iterative least-squares approach (Matlab R2020a)6,9. Both models calculated the chain length using the relation cl=16.32+0.38ndb, and the constrained model also assumed number of methylene-interrupted double bonds nmidb=-0.71+0.45ndb9. In addition, fat, water, R2* and off-resonance frequency (B0) were estimated.
Simulations
To investigate the noise performance and robustness to model inaccuracies, signals were simulated representing BMAT (T2*=5 ms) and WAT (T2*=30 ms) using a fat fraction of 92 %, number of echoes nTE=10, and inter-echo time ΔTE=0.6 ms at 7 T.
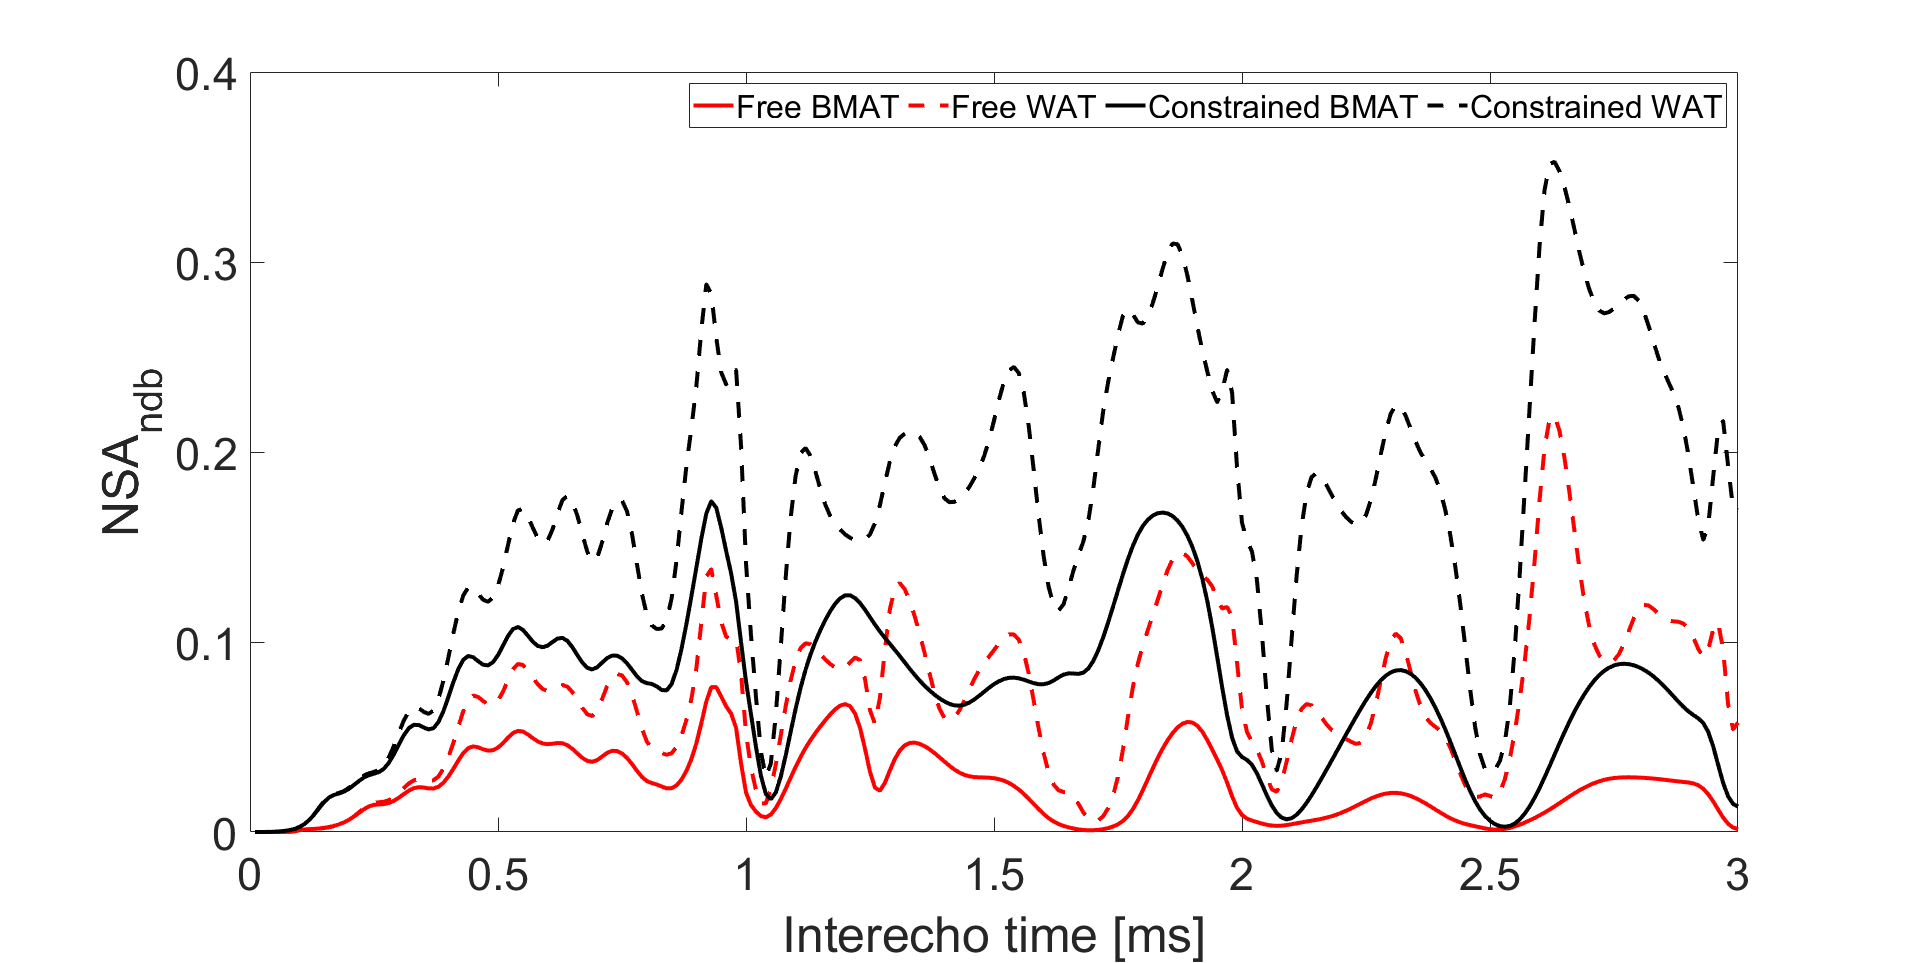
The noise performance was investigated as the maximum effective number of signals averaged (NSA), calculated from the Cramér-Rao bound12,13. NSA describes how efficiently a model uses the signal from several images with a theoretical maximum of NSA=nTE.
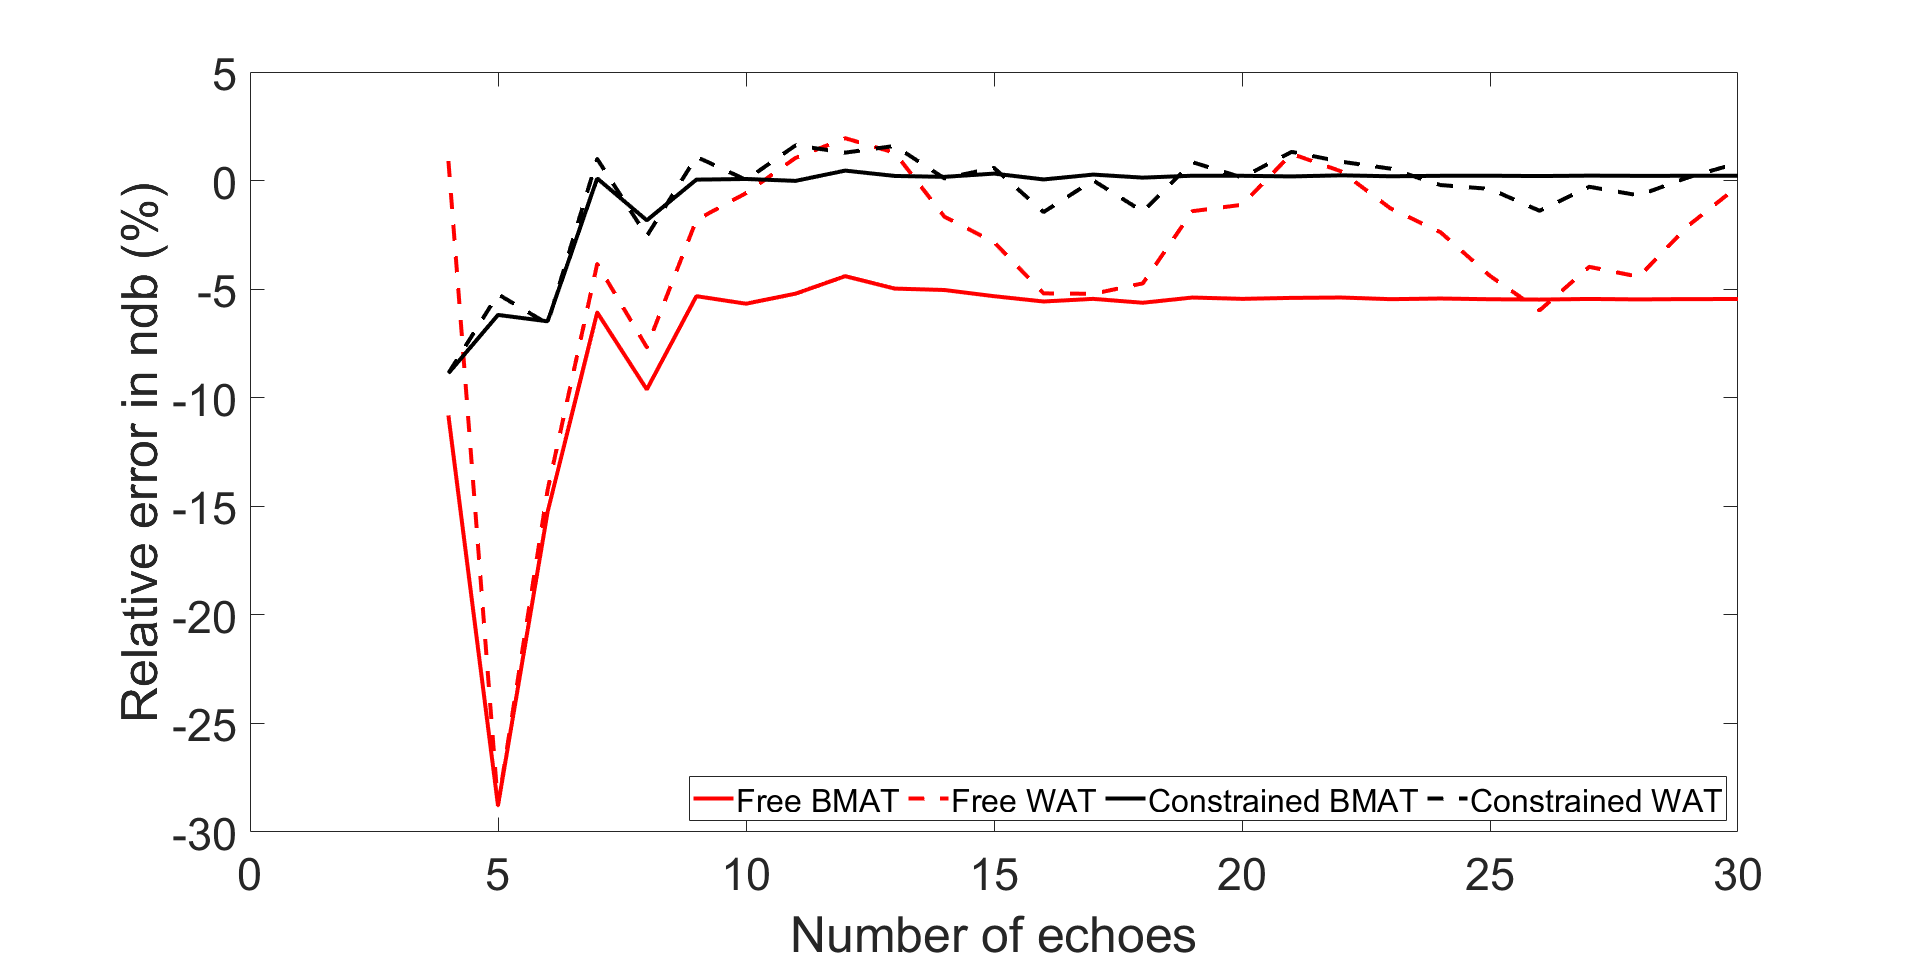
The robustness to model inaccuracies was estimated as the relative error in ndb when shifting the fat frequency spectrum by 0.05 ppm in reconstruction.
In vivo feasibility
After ethical review board approval and informed consent, the knee of 7 healthy volunteers was imaged in a QED knee coil (1TX/28RX) in a Philips Achieva 7T AS system. Three volunteers were excluded from WAT analysis due to insufficient WAT amount.
Two multi-echo gradient echo sequences with interleaved TEs and bipolar acquisition were acquired resulting in an effective ΔTE=0.6 ms, with nTE=16, TE1=1.2 ms, TR=30 ms, bandwidth=1378 Hz/px, flip angle=8°, and voxel size=0.6x0.6x3 mm3.
Correction of phase errors and a B0 first guess were obtained online using mDixon Quant (Philips), and FAC parameters were estimated using various nTEs.
Statistics
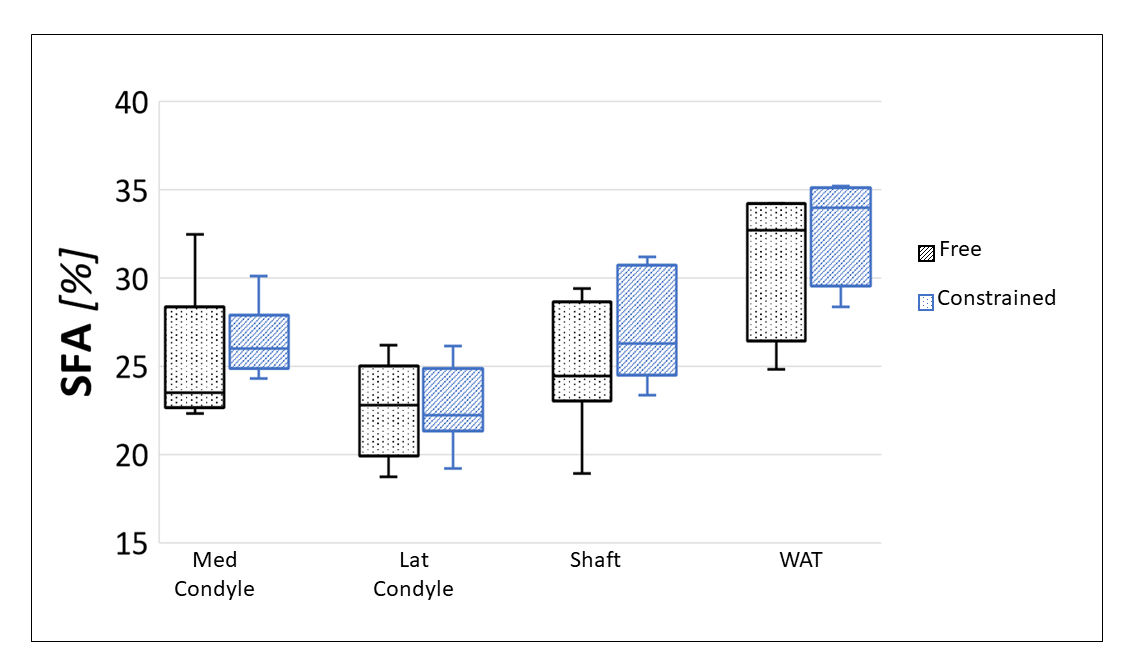
Three sagittal image slices were selected for each subject to define four regions-of-interest in the distal femur: a medial and a lateral slice for definition of medial and lateral condyles, respectively, and a central slice for definition of the femoral shaft and posterior subcutaneous WAT. The average ndb and SFA= 1−(ndb+nmidb)/3 (for fat fraction >80%) within each region-of-interest was estimated for all tested reconstructions. The median (range) of subjects were presented.
Results
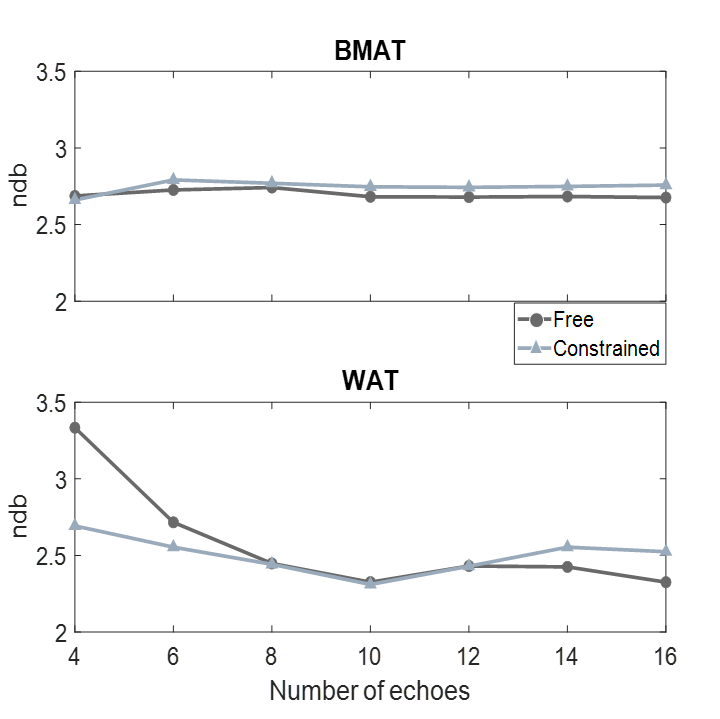
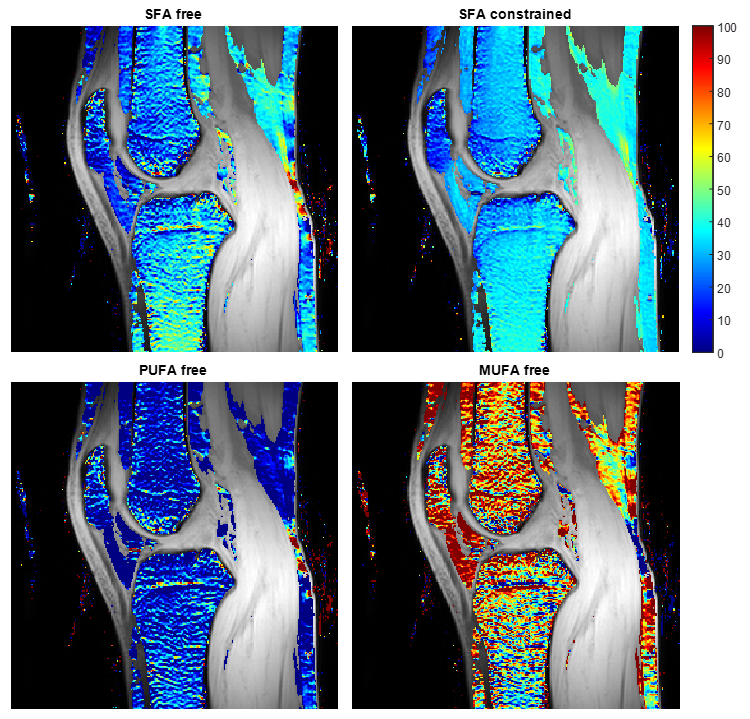
NSA was lower and a shorter ΔTE was more crucial in BMAT compared to WAT (Figure 1). However, BMAT was also less affected by model inaccuracies and values tended to stabilize at values of small relative errors as seen both in simulations (Figure 2) and in vivo (Figure 3). The constrained model resulted in more robust and noise efficient results compared to the free model.Using suitable ΔTE and nTE from Figures 1-3, in vivo feasibility in BMAT at 7 T was demonstrated in Figure 4. The calculated in vivo SFA values were consistent between models and tended to be lower in BMAT compared to WAT (Figure 5). The constrained model showed lower inter-subject variability as it was suggested by simulations in Figures 1-2.
Discussion
7 T feasibility in WAT has been demonstrated before14 but may be especially beneficial for BMAT imaging. However, the necessary short ΔTE in this tissue at 7 T, may require interleaved or bipolar acquisitions, or both.The lower noise performance of BMAT FAC imaging may be partially helped using a constrained approach. However, this choice is limited to differentiation of SFA only, as estimation of monounsaturated and polyunsaturated fatty acids requires free estimation of both ndb and the number of methylene-interrupted double bonds9.
Compared to literature gas chromatography results, SFA values agrees well in subcutaneous WAT15 but BMAT values in the femoral head are slightly lower16. This discrepancy might be explained by regional FAC differences in BMAT10,11. Further work with a larger number of subjects is planned for comparison between BMAT regions.
Conclusion
Using a short ΔTE, robust FAC-quantification of BMAT is feasible and may benefit from an ultra-high field strength. The constrained model may provide better noise performance, but is limited to SFA quantification, only.Acknowledgements
No acknowledgement found.References
1. Patsch JM, Li X, Baum T, et al. Bone marrow fat composition as a novel imaging biomarker in postmenopausal women with prevalent fragility fractures. J Bone Miner Res. 2013;28:1721-1728.
2. Yeung DK, Griffith JF, Antonio GE, et.al. Osteoporosis is associated with increased marrow fat content and decreased marrow fat unsaturation: A proton MR spectroscopy study. J Magn Reson Imaging. 2005; 2:279-285.
3. Plumb MS, Aspden RM. High levels of fat and (n-6) fatty acids in cancellous bone in osteoarthritis. Lipids Health Dis. 2004;3:12.
4. Wang L, Salibi N, Chang G, et al. Assessment of subchondral bone marrow lipids in healthy controls and mild osteoarthritis patients at 3T. NMR Biomed. 2012;25(4):545-555.
5. Hamilton G, Yokoo T, Bydder M, et al. In vivo characterization of the liver fat 1H MR spectrum. NMR Biomed. 2011;24:784-790.
6. Peterson P, Månsson S. Simultaneous quantification of fat content and fatty acid composition using MR imaging. Magn Reson Med. 2013;69(3):688-697.
7. Bydder M, Girard O, Hamilton G. Mapping the double bonds in triglycerides. Magn Reson Imaging. 2011;29(8):1041-1046.
8. Berglund J, Ahlstrom H, Kullberg J. Model-based mapping of fat unsaturation and chain length by chemical shift imaging– phantom validation and in vivo feasibility. Magn Reson Med. 2012;68:1815-1827. 9. Trinh L, Peterson P, Leander P, et.al. In vivo comparison of MRI-based and MRS-based quantification of adipose tissue fatty acid composition against gas chromatography. Magnetic Resonance in Medicine. 2020;84(5):2484-2494.
10. Martel D, Leporq B, Bruno M, et.al. Chemical shift-encoded MRI for assessment of bone marrow adipose tissue fat composition: Pilot study in premenopausal versus postmenopausal women. Magn Reson Imaging. 2018;53:148-155.
11. Martel D, Leporq B, Saxena A, et.al. 3T chemical shift‐encoded MRI: Detection of altered proximal femur marrow adipose tissue composition in glucocorticoid users and validation with magnetic resonance spectroscopy. J. Magn. Reson. Imaging. 2019;50:490-496.
12. Pineda AR, Reeder SB, Wen Z, et.al. Cramér–Rao bounds for three‐point decomposition of water and fat. Magn. Reson. Med. 2005;54:625-635.
13. Gudmundson, E. Signal Processing for Spectroscopic Applications. Acta Universitatis Upsaliensis. Uppsala Dissertations from the Faculty of Science and Technology 91. 192 pp. Uppsala. 2010.
14. Leporq B, Lambert SA, Ronot M, et al. Hepatic fat fraction and visceral adipose tissue fatty acid composition in mice: Quantification with 7.0T MRI. Magn Reson Med. 2016;76:510‐518.
15. Hodson L, Skeaff CM, Fielding BA. Fatty acid composition of adipose tissue and blood in humans and its use as a biomarker of dietary intake. Prog Lipid Res. 2008;47:348‐380.
16. Humphries JM, Kuliwaba JS, Gibson RJ, et.al. In situ fatty acid profile of femoral cancellous subchondral bone in osteoarthritic and fragility fracture females: Implications for bone remodeling. Bone. 2012;51(2):218-223.
Figures