3852
Precision of STEAM-MRS for Multi-Parametric Quantification in Subjects with Liver Iron Overload at 1.5T and 3T1Radiology, University of Wisconsin-Madison, Madison, WI, United States, 2Medical Physics, University of Wisconsin-Madison, Madison, WI, United States, 3Radiology, University of California-San Diego, San Diego, CA, United States, 4Biomedical Engineering, University of Wisconsin-Madison, Madison, WI, United States, 5Medicine, University of Wisconsin-Madison, Madison, WI, United States, 6Emergency Medicine, University of Wisconsin-Madison, Madison, WI, United States
Synopsis
The precision (repeatability and reproducibility) of quantitative stimulated echo acquisition mode (STEAM) MRS was evaluated in subjects with known or suspected liver iron overload at both 1.5T and 3T. The test-retest repeatability and reproducibility across acquisition modes (multi-TE vs multi-TE-TR) of STEAM-MRS multi-parametric quantification was evaluated using linear regression and Bland-Altman analyses. STEAM-MRS demonstrated high precision for several biomarkers, including R2water and R2fat, FWHMwater and FWHMfat as surrogates for R2*, and PDFF, at both 1.5T and 3T. R1water and R1fat exhibited moderate repeatability. The precision of the water estimates (R1, R2, and FWHM) was relatively similar at both field strengths.
Introduction
Multi-acquisition stimulated echo acquisition mode (STEAM) MRS is a technique capable of simultaneously quantifying several biomarkers of diffuse liver disease,1-3 including biomarkers of fibrosis (R1), iron overload (R2 and full-width at half-maximum (FWHM=R2*/π)), and fatty liver disease (PDFF), in a single 20sec breath-hold. Development of quantitative MR biomarkers, such as those enabled by STEAM-MRS, requires understanding the method’s precision profile (repeatability and reproducibility). The precision of quantitative STEAM-MRS measurements in the liver is currently unknown, particularly in patients with liver iron overload where signal decays rapidly and SNR is low. Therefore, the purpose of this work was to evaluate the precision profile of multi-TE and multi-TE-TR STEAM-MRS in subjects with liver iron overload at 1.5T and 3T.Methods
Subjects: Subjects with known or suspected liver iron overload were recruited for this prospective IRB-approved study, with written informed consent.MR acquisition: Subjects underwent four MRI exams in a single visit to examine the precision of multi-TE4 and multi-TE-TR5 STEAM-MRS sequences at 1.5T (Signa HDxt and Optima MR450W, GE Healthcare) and 3T (MR750, GE Healthcare).
First, multi-TE (6 acquired spectra including one pre-acquisition, TE1=10ms, $$$\Delta$$$TE=5ms, 5 TEs acquired in separate TRs, TR=3500ms, spectral width sw=5000Hz, and 2048 samples) and multi-TE-TR (32 acquired spectra including four pre-acquisitions, using TRs between 140-1990ms, TEs between 10-110ms, sw=5000Hz, and 256 samples) sequences were acquired at 1.5T using a 2x2x2 cm3 to 3x3x3 cm3 voxel placed in the right lobe of the liver parenchyma.
Following a test-retest approach, the MRI table was then removed from the scanner, the coil array was removed, the subject was asked to sit up and then lie back down, the coil was replaced, the table was returned into the scanner, and the same STEAM-MRS acquisitions were repeated. This same test-retest procedure was subsequently performed at 3T during the same visit on the same day. Additionally, liver iron concentration was measured using the FDA-approved R2-based FerriScan technique (Resonance Health, Claremont, WA, Australia) obtained at 1.5T.6
MRS data analysis: MRS data were analyzed using a previously published procedure.7 A seven-peak (one water and six fat) spectral model was fit using Voigt line shapes in order to obtain estimates of R2water, R2fat, FWHMwater, FWHMfat, and PDFF from the multi-TE datasets. For multi-TE-TR data, the same estimates, as well as R1water and R1fat, were obtained.
Statistical analysis: To evaluate the test-retest repeatability and reproducibility across acquisition modes (multi-TE vs multi-TE-TR), the intraclass correlation coefficient (ICC) was calculated for each estimated parameter for each sequence at both field strengths. Linear regression (slope, intercept, R2) and Bland-Altman (mean difference, repeatability/reproducibility coefficient (RPC=1.96*standard deviation of differences), and coefficient of variation (CV=standard deviation of mean values)) analyses were also performed. For fat estimates (R2, FWHM, and R1), subjects with PDFF < 3% were removed from the statistical analysis. Additionally, outliers (studentized residual > 3) were also removed from the statistical analysis using an automated iterative procedure, followed by manual evaluation of potential outliers.
Results
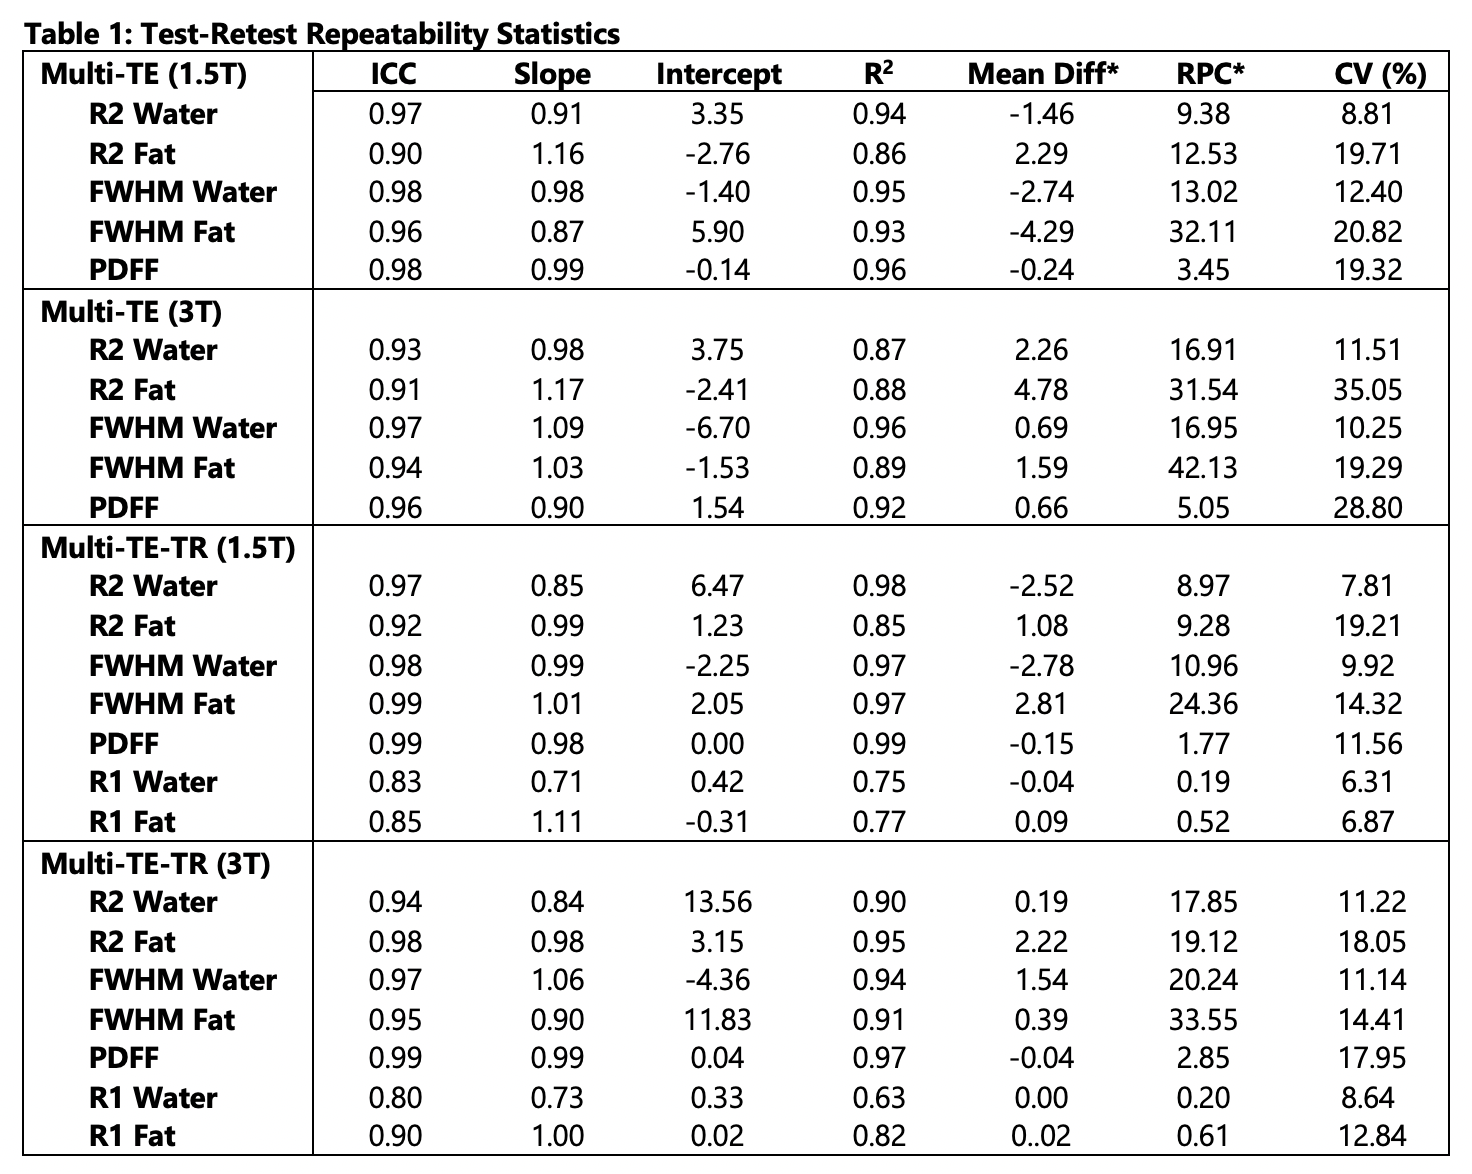
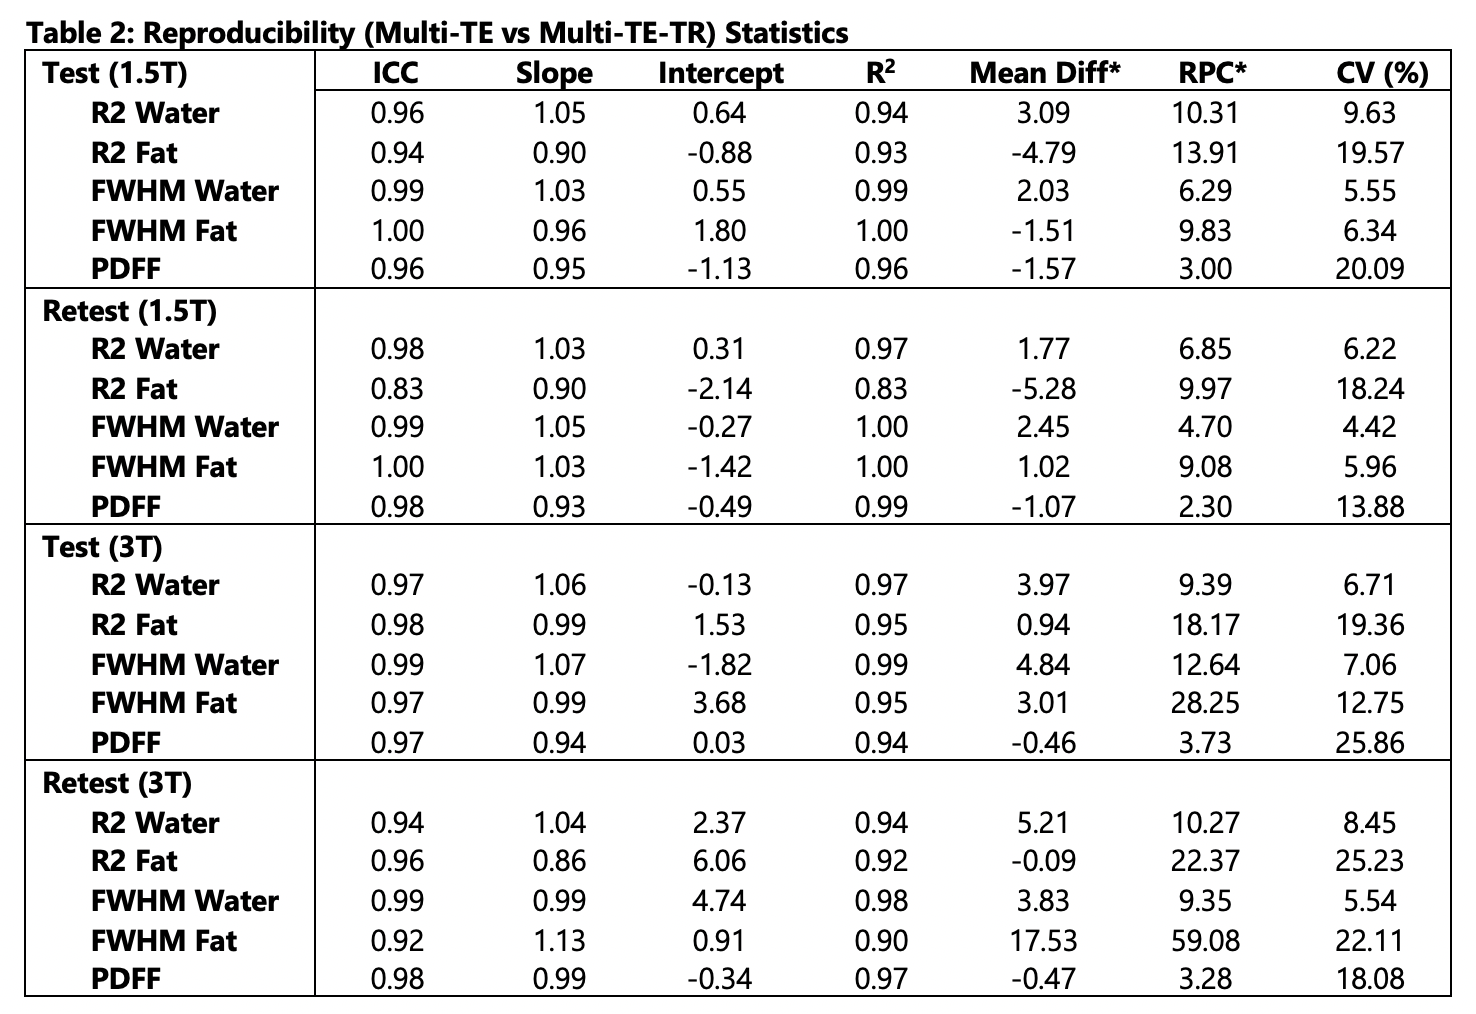
Subjects: Thirty-eight (n=38) subjects (25 male, 13 female) with median age 51 years (range 10-73) were recruited and imaged at both 1.5T and 3T.Statistical analysis: Tables 1 and 2 provide the analysis statistics evaluating test-retest repeatability and reproducibility, respectively. For repeatability, high ICC values ($$$\geq$$$0.90) and slopes in the range of [0.84, 1.17] were observed for all estimated parameters for both STEAM-MRS sequences at both 1.5T and 3T, except for R1water and R1fat. For R1water, ICCs of 0.83 and 0.80 and slopes of 0.71 and 0.73 were observed for 1.5T and 3T, respectively. Similarly, for reproducibility, high ICC values ($$$\geq$$$0.90) and slopes in the range of [0.90, 1.13] were observed for all estimated parameters for both the test and retest acquisitions at both 1.5T and 3T, except for R2fat from the multi-TE retest at 1.5T.
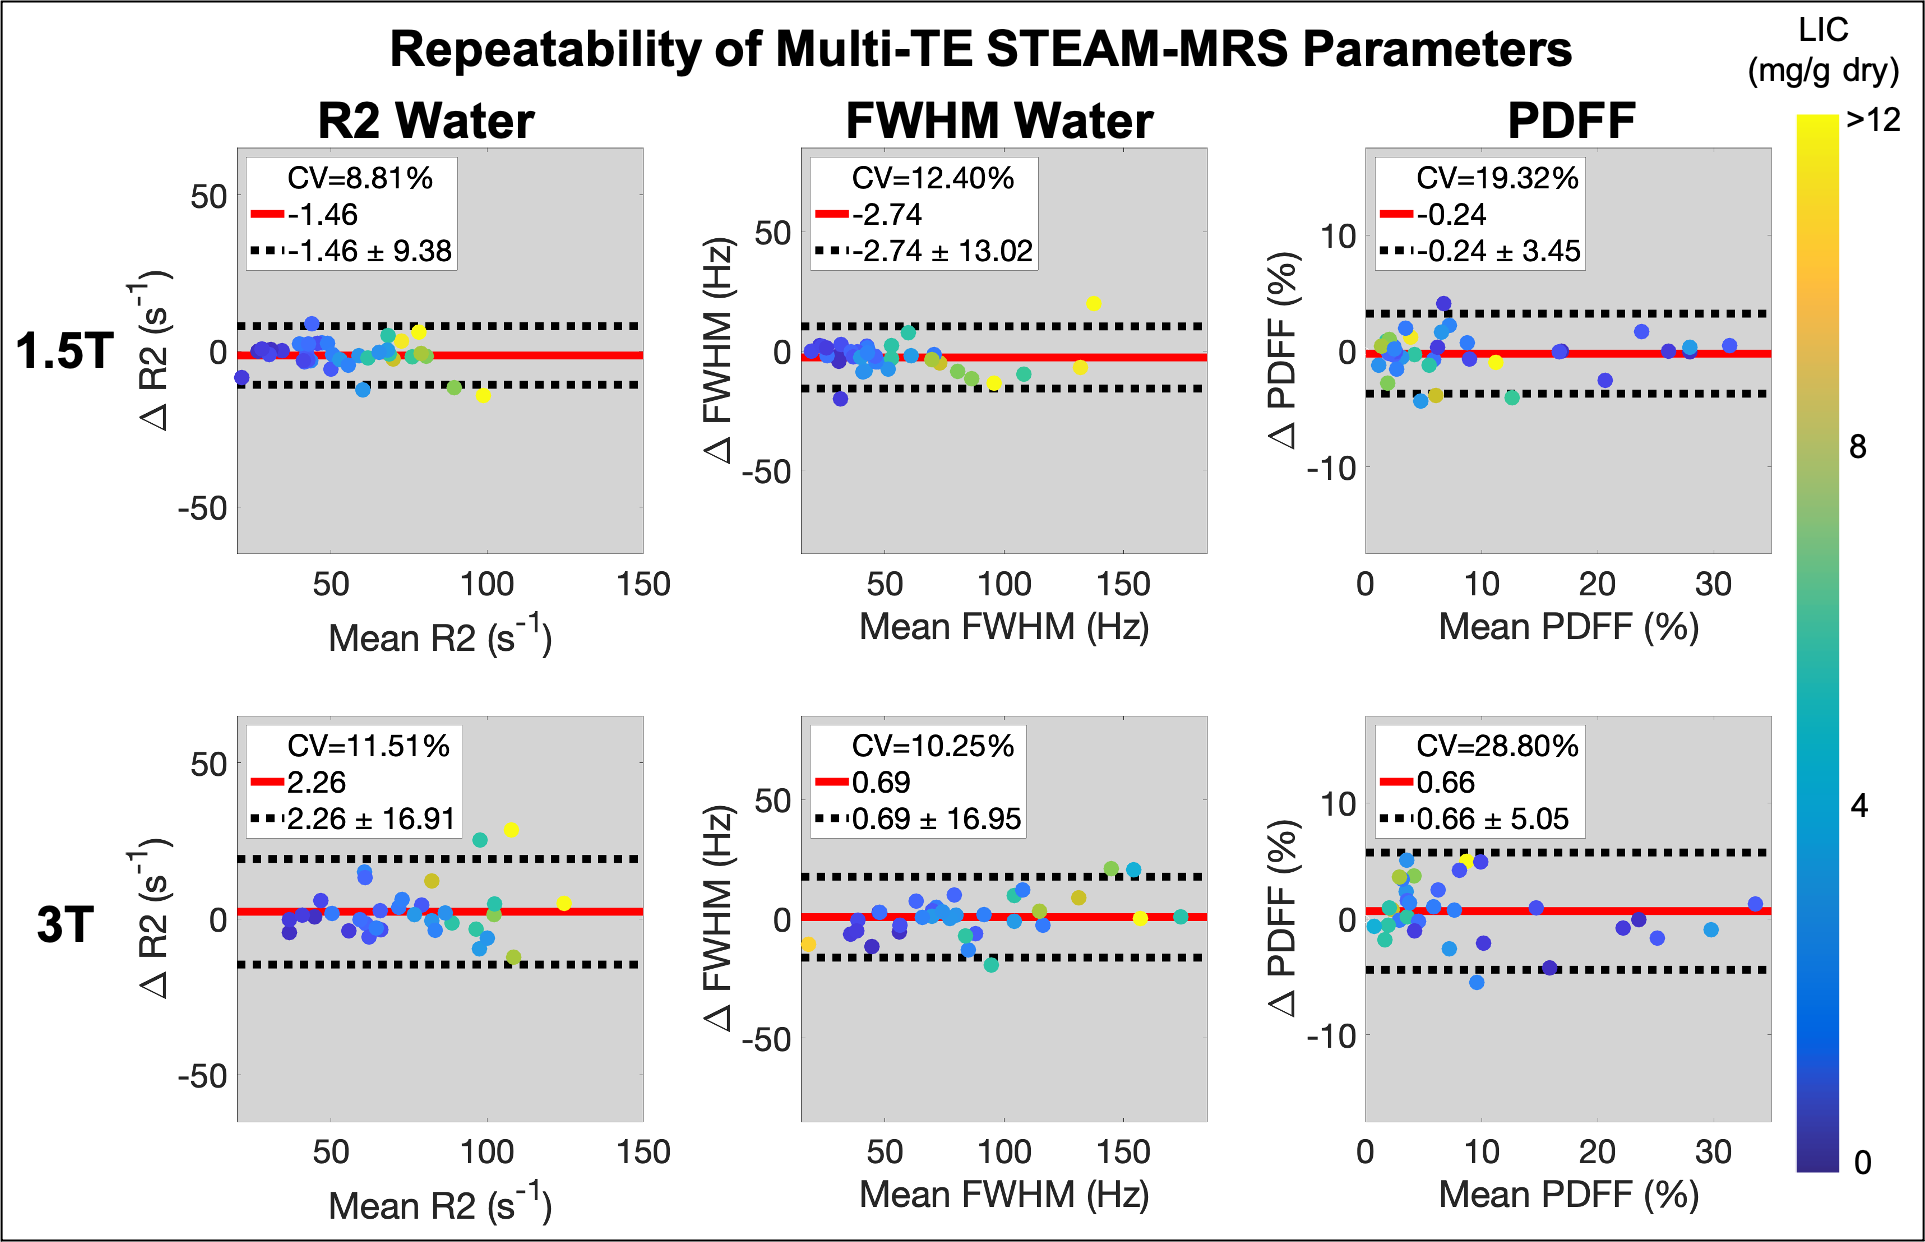
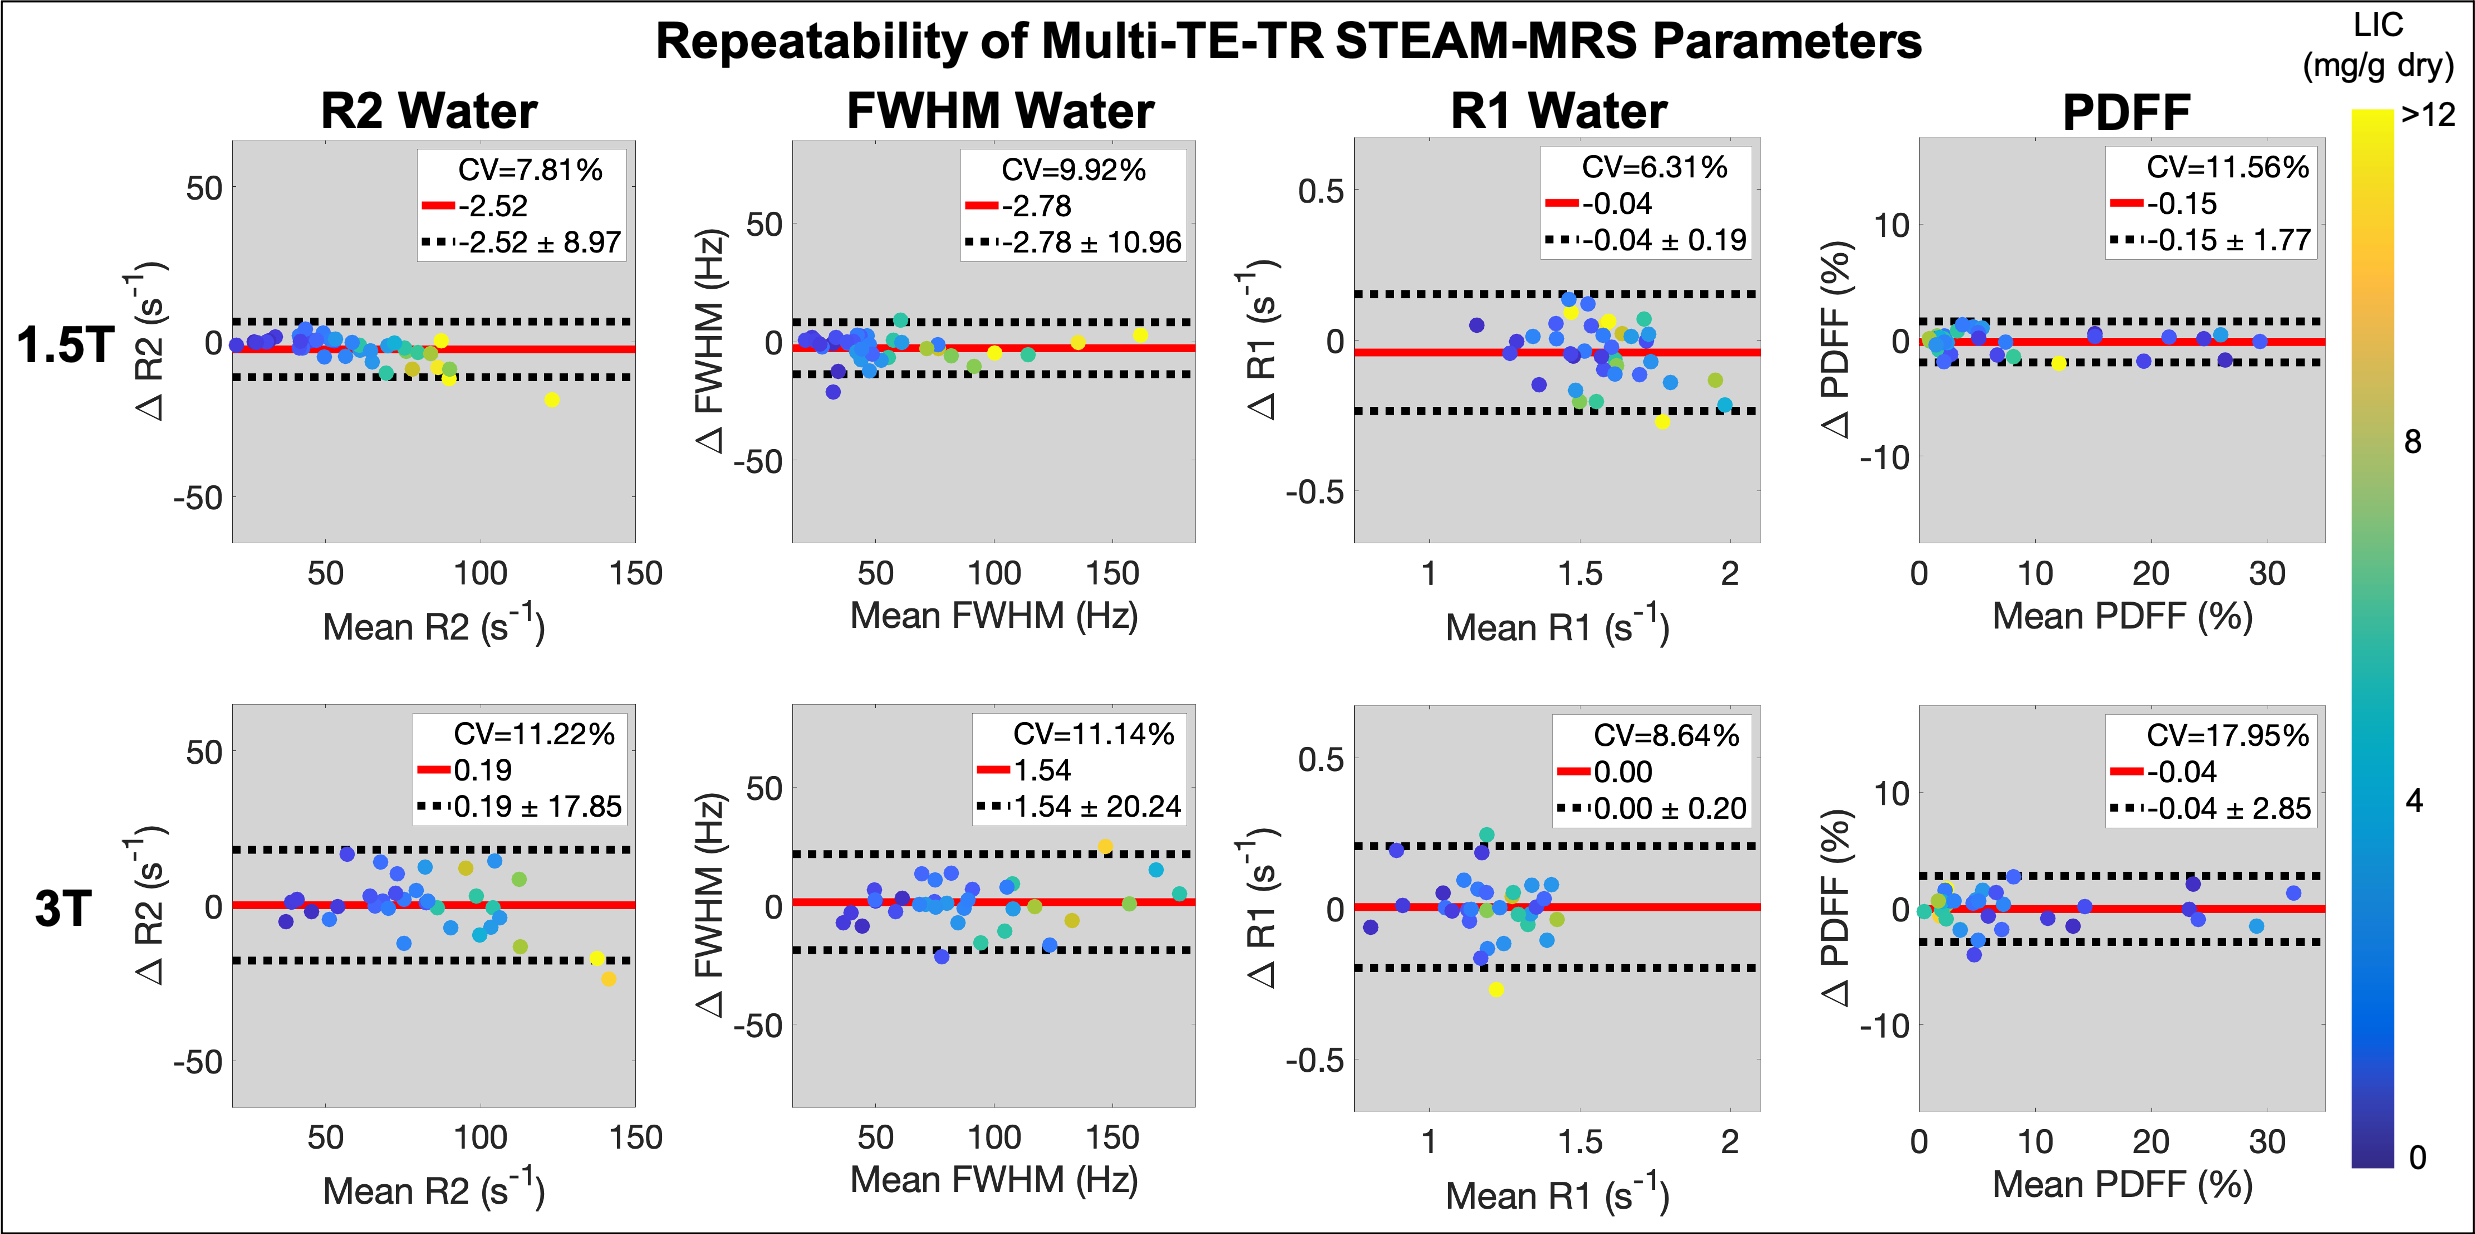
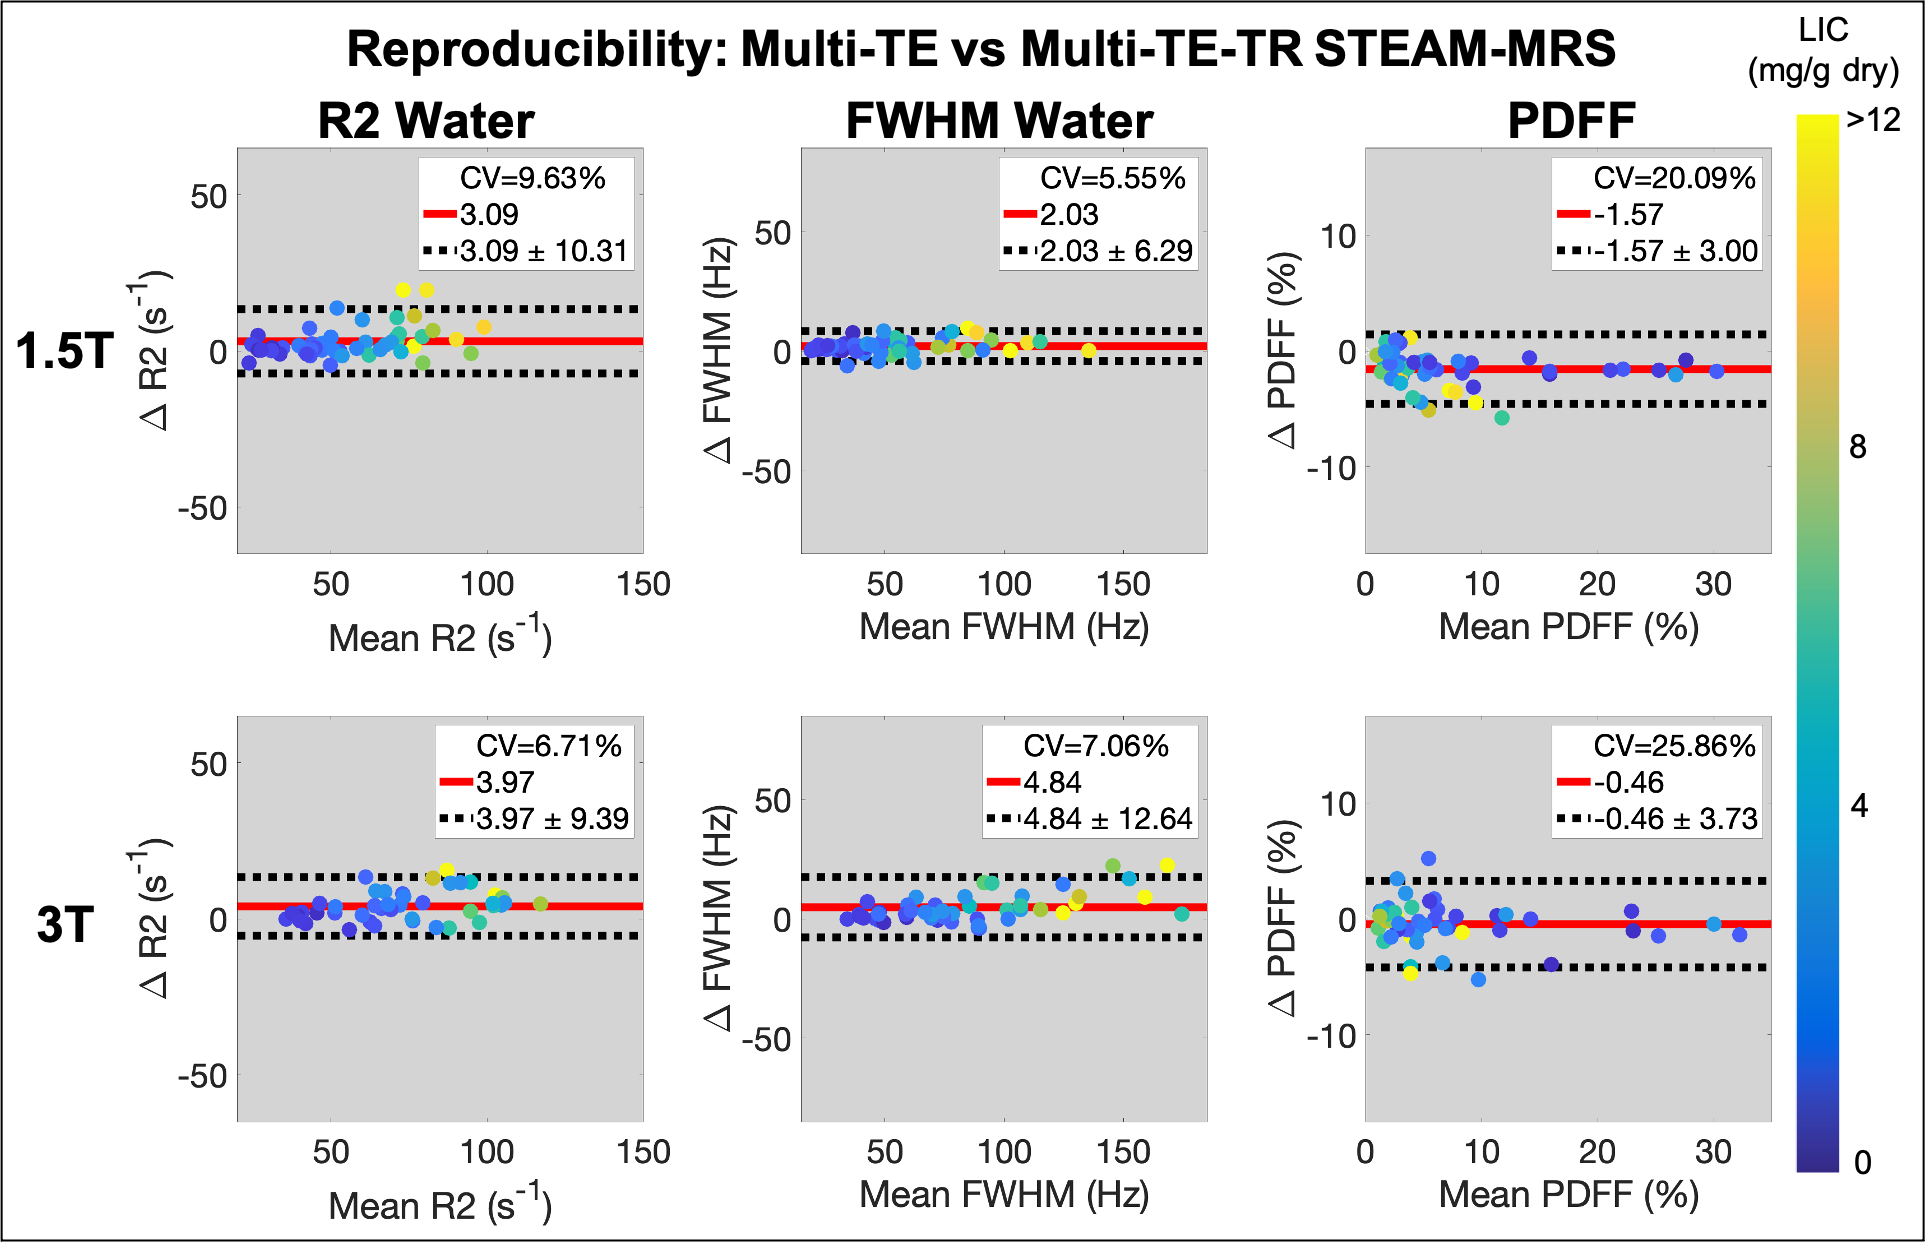
For all estimated parameters, larger RPCs were observed at 3T than at 1.5T; however, for the water estimates (R2, FWHM, and R1), relatively similar CVs were observed at 1.5T and 3T (Figures 1-3). The automated outlier removal procedure removed 2.33 subjects on average from the statistical analysis, with a maximum of five, across the various comparisons.
Discussion and Conclusion
STEAM-MRS demonstrated high precision (repeatability and reproducibility) for several promising biomarkers, including R2, FWHM, and PDFF, at both 1.5T and 3T in subjects with liver iron overload.R1 exhibited moderate repeatability. At both 1.5T and 3T, similar underestimation in the slope (~0.7) was observed when examining the repeatability of R1water; although, mean differences of approximately zero were observed. This may be due to less subject movement during retest breath-holds, resulting in improved SNR, and therefore leading to more stable estimates. This explanation is supported by observed smaller variability in the R1water measurements across subjects for the retest acquisition. Additionally, the precision of all water estimates was relatively similar across the two examined field strengths, as evident by the relatively similar CV values.
One limitation of this work is a lack of extreme cases of iron overload, which may affect the method’s precision. However, in low to moderate cases, STEAM-MRS enables rapid and precise measurement of multiple biomarkers of diffuse liver disease, with potential applications in clinical imaging.
Acknowledgements
The authors wish to acknowledge support from the NIH (R01 DK117354, R01 DK100651, R01 DK088925). Also, GE Healthcare provides research support to the University of Wisconsin. Dr. Reeder is a Romnes Faculty Fellow and has received an award provided by the University of Wisconsin-Madison Office of the Vice Chancellor for Research and Graduate Education with funding from the Wisconsin Alumni Research Foundation.References
1. Olson, M.C., S.B. Reeder, and S.K. Venkatesh, Quantitative MRI Biomarkers of Diffuse Liver Disease. Advances in Clinical Radiology, 2019. 1: p. 55-69.
2. Bannas, P., et al., Emerging quantitative MRI biomarkers of diffuse liver disease. Clinical liver disease, 2014. 4(6): p. 129.
3. Taouli, B. and F.C. Alves, Imaging biomarkers of diffuse liver disease: current status. Abdominal Radiology, 2020. 45(11): p. 3381-3385.
4. Hamilton, G., et al., Effect of PRESS and STEAM sequences on magnetic resonance spectroscopic liver fat quantification. Journal of Magnetic Resonance Imaging: An Official Journal of the International Society for Magnetic Resonance in Medicine, 2009. 30(1): p. 145-152.
5. Hamilton, G., et al., In vivo breath‐hold 1H MRS simultaneous estimation of liver proton density fat fraction, and T1 and T2 of water and fat, with a multi‐TR, multi‐TE sequence. Journal of Magnetic Resonance Imaging, 2015. 42(6): p. 1538-1543.
6. Pierre, T.G.S., et al., Noninvasive measurement and imaging of liver iron concentrations using proton magnetic resonance. Blood, 2005. 105(2): p. 855-861.
7. Hernando, D., et al., Fully automated processing of multi-echo spectroscopy data for liver fat quantification. In Proceedings of the 22nd Annual Meeting of ISMRM, Milan, Italy, 2014. Abstract 2884.
Figures