3851
Comparing omega-3 content in adipose tissue of mice and rats fed a high omega-3 diet with MRS at 9.4T1Department of Oncology, University of Alberta, Edmonton, AB, Canada, 2Department of Medical Physics, Cross Cancer Institute, Edmonton, AB, Canada, 3Department of Agricultural, Food and Nutritional Science, University of Alberta, Edmonton, AB, Canada
Synopsis
Omega-3 (ω-3) fat intake is important to disease and reflected in adipose tissue composition. Optimized PRESS (Point RESolved Spectroscopy) at 9.4T is used to quantify relative ω-3 fat content in adipose tissue of mice and rats fed a 16% ω-3 diet and in a control diet mouse. The actual ω-3 fat content in the mice was determined using gas chromatography and compared to that obtained using optimized MRS (R2 = 0.98). On average, the % ω-3 content measured with MRS in rat adipose tissue was approximately 39% higher than that in mouse.
Introduction
Dietary omega-3 (ω-3) fat correlates inversely with disease, including obesity 1,2, breast cancer 3,4, osteoporosis 5,6 and diabetes 1,2. Magnetic Resonance Spectroscopy (MRS) can assess fat composition in vivo 7-9; however, ω-3 quantification is usually neglected because of its lower concentration (≈1% ) 10 and because its quantification is challenging. The ω-3 methyl resonance (≈0.98ppm) overlaps the non-ω-3 methyl resonance (≈0.9ppm) 11 with standard short TE (echo time) techniques, even at high field strengths 12. Measuring ω-3 fat content is desirable since levels can change with disease and in feeding trials 13-19. Feeding trials can explore correlations between pathology and dietary intakes that are ingested by people or diets meant to alleviate or prevent disease 1,2,4-6,20. Dietary impacts can be evaluated in animal trials 8,19. The presented work measures relative ω-3 fat content obtained using an optimal PRESS (Point RESolved Spectroscopy) TE of 109ms at 9.4T in-vivo in adipose tissue of mice and rats fed a high ω-3 fat diet and in a mouse fed a control diet.Methods
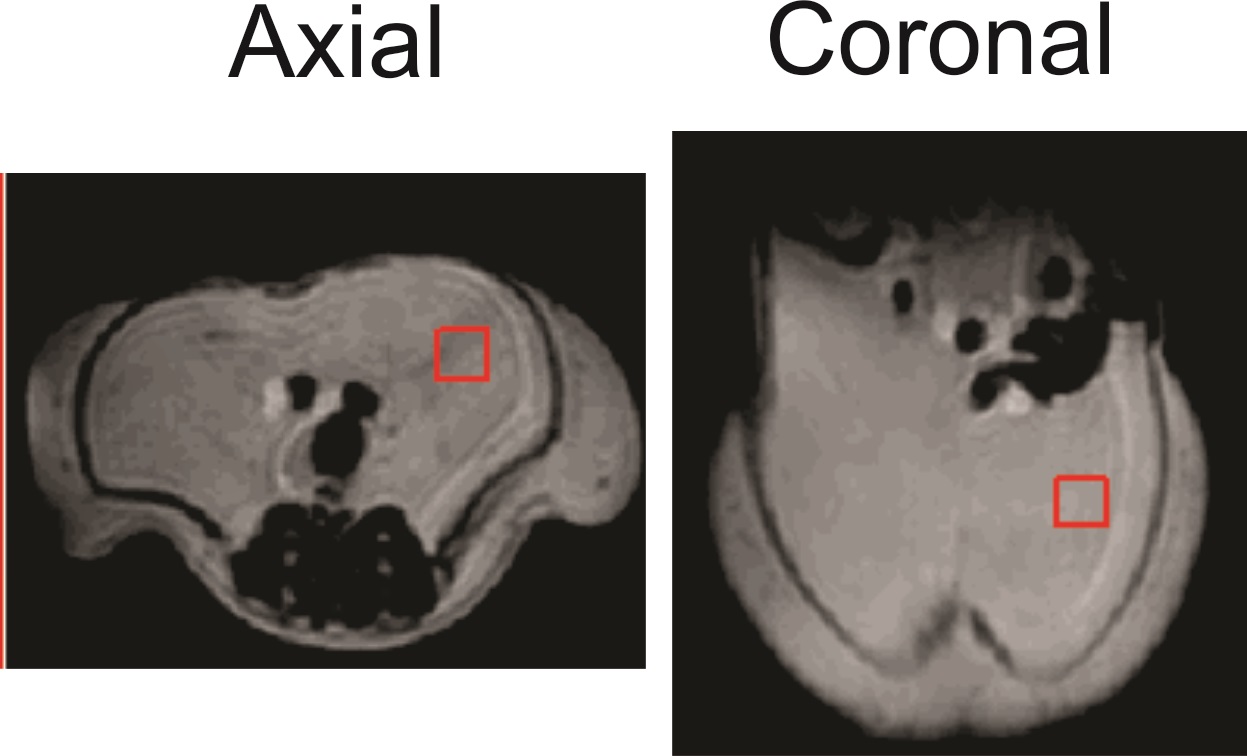
At 9.4T, a PRESS TE of 109ms minimizes signal from the side peaks of the ω-3 and non-ω-3 methyl resonance triplets, resolving the two peaks. Three mice and two rats were fed a high fat diet (20% weight/weight fat) with 16% ω-3 fat. A control mouse was fed a standard chow diet (6% weight/weight fat), with ≈6 % ω-3 fat 21. Animals were scanned with a 21.5 cm diameter bore 9.4T MRI scanner (mice at about 5 months of age and rats at about 3 months). A 3x3x3 mm3 voxel (mice) or 5x5x5 mm3 (rats) was positioned in the abdominal visceral adipose tissue (Figure 1) and spectra were acquired using the following parameters: repetition time (TR) of 5 s for mice and 3 s for rats, 2048 complex points, 8-step phase cycling, 10,000 Hz sampling frequency, and 32 averages. PRESS spectra from all animals were acquired with a short TE of 25 ms (TE1 = 15 ms, TE2 = 10 ms), and with the optimized TE of 109 ms (TE1 = 15 ms, TE2 = 94 ms). Peak areas of the ω-3 methyl (0.94 – 1.0 ppm) and the non-ω-3 methyl (0.86 – 0.93 ppm) were measured from long TE spectra and a % ω-3 fat content was calculated as the ω-3 methyl area divided by the sum of the ω-3 and non-ω-3 methyl peak areas. Mice were euthanized immediately after scan completion and their abdominal visceral fat was collected for gas chromatography (GC) analysis to determine % ω-3 content.Results
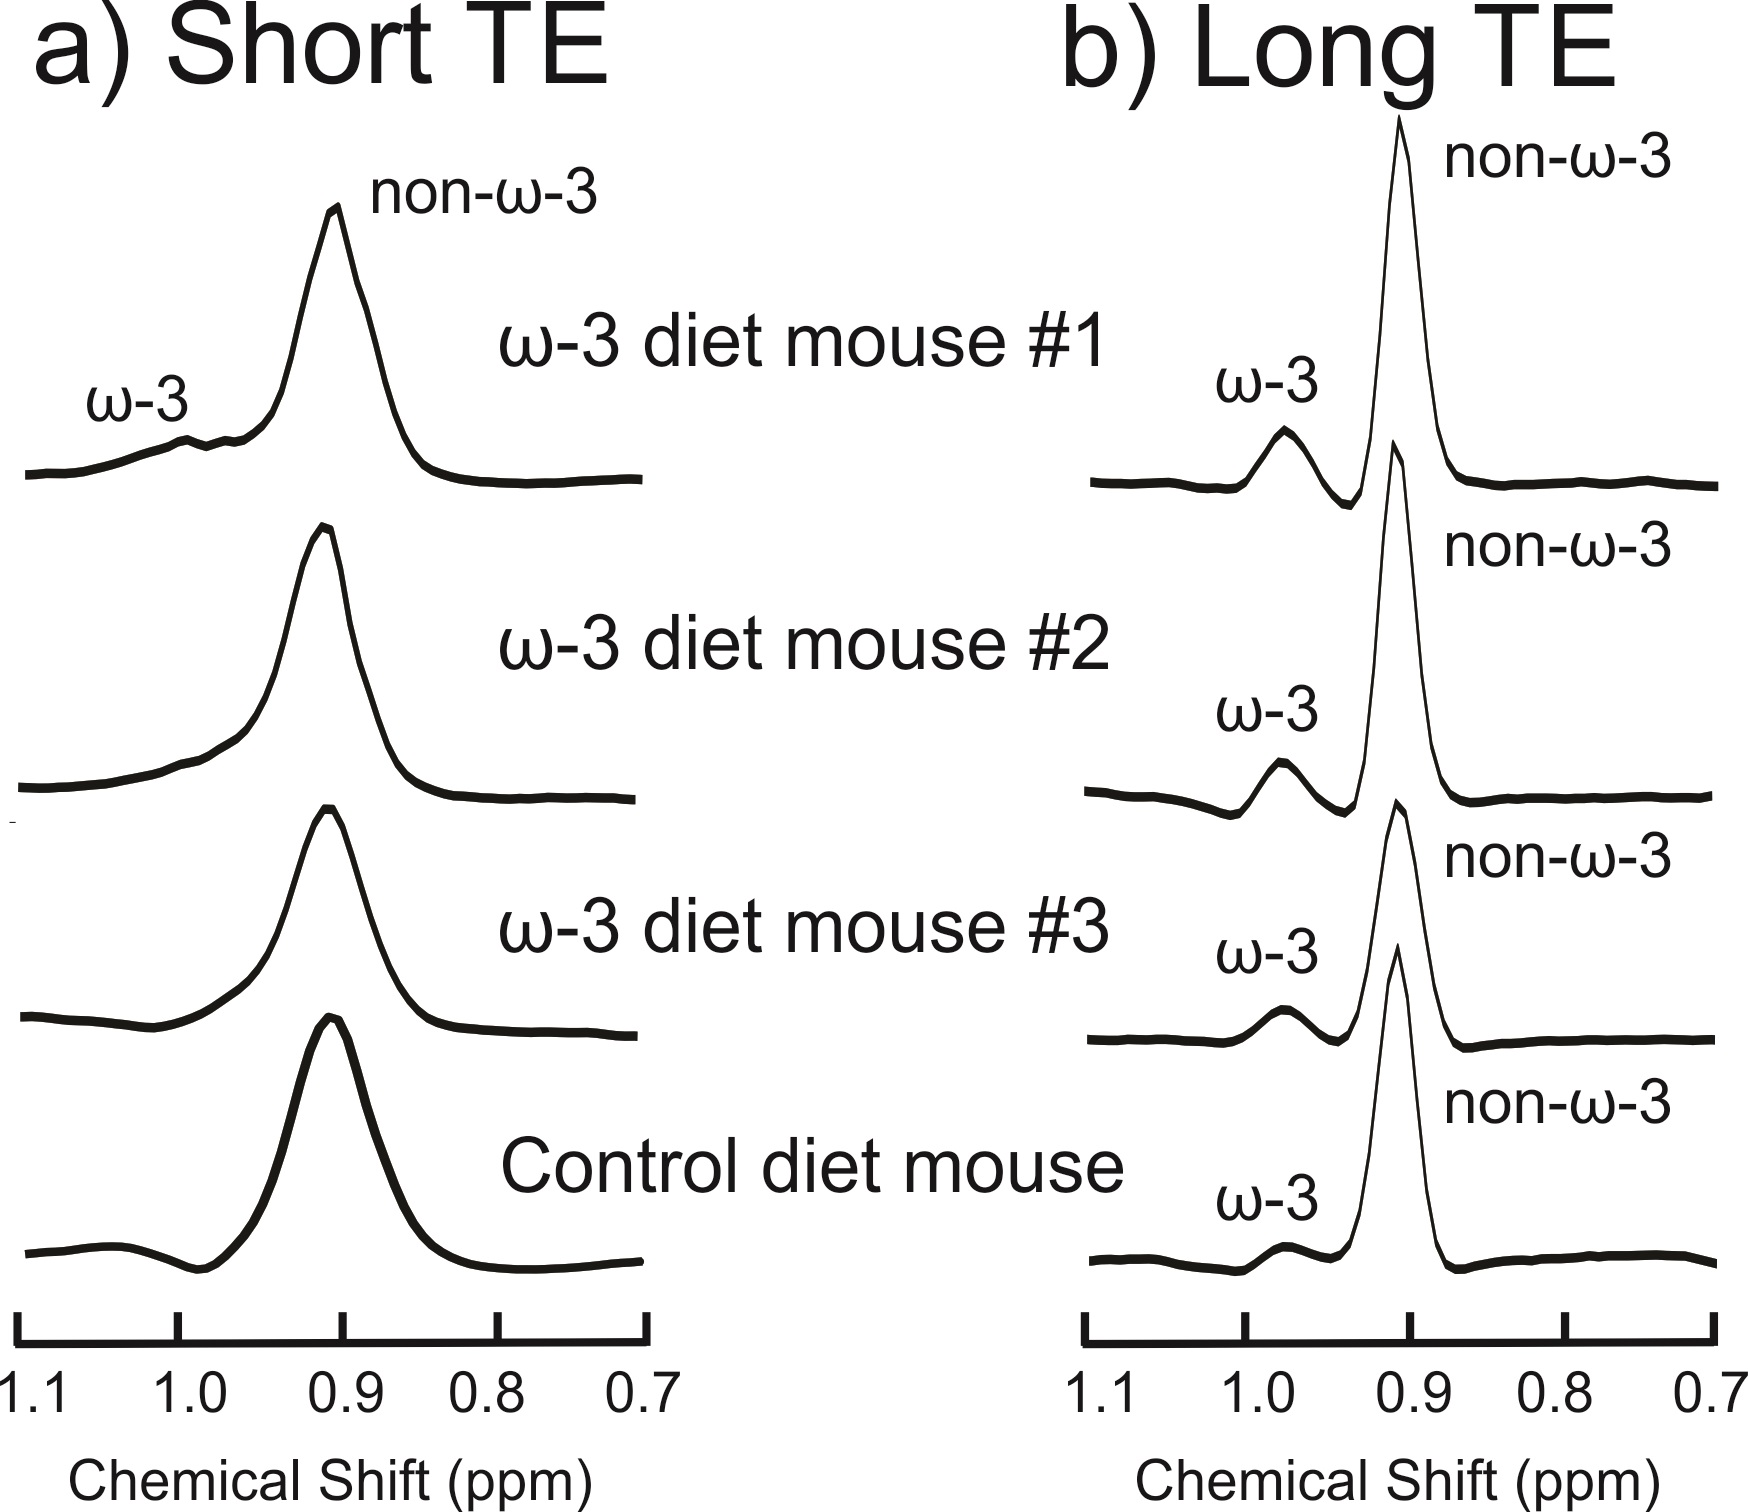
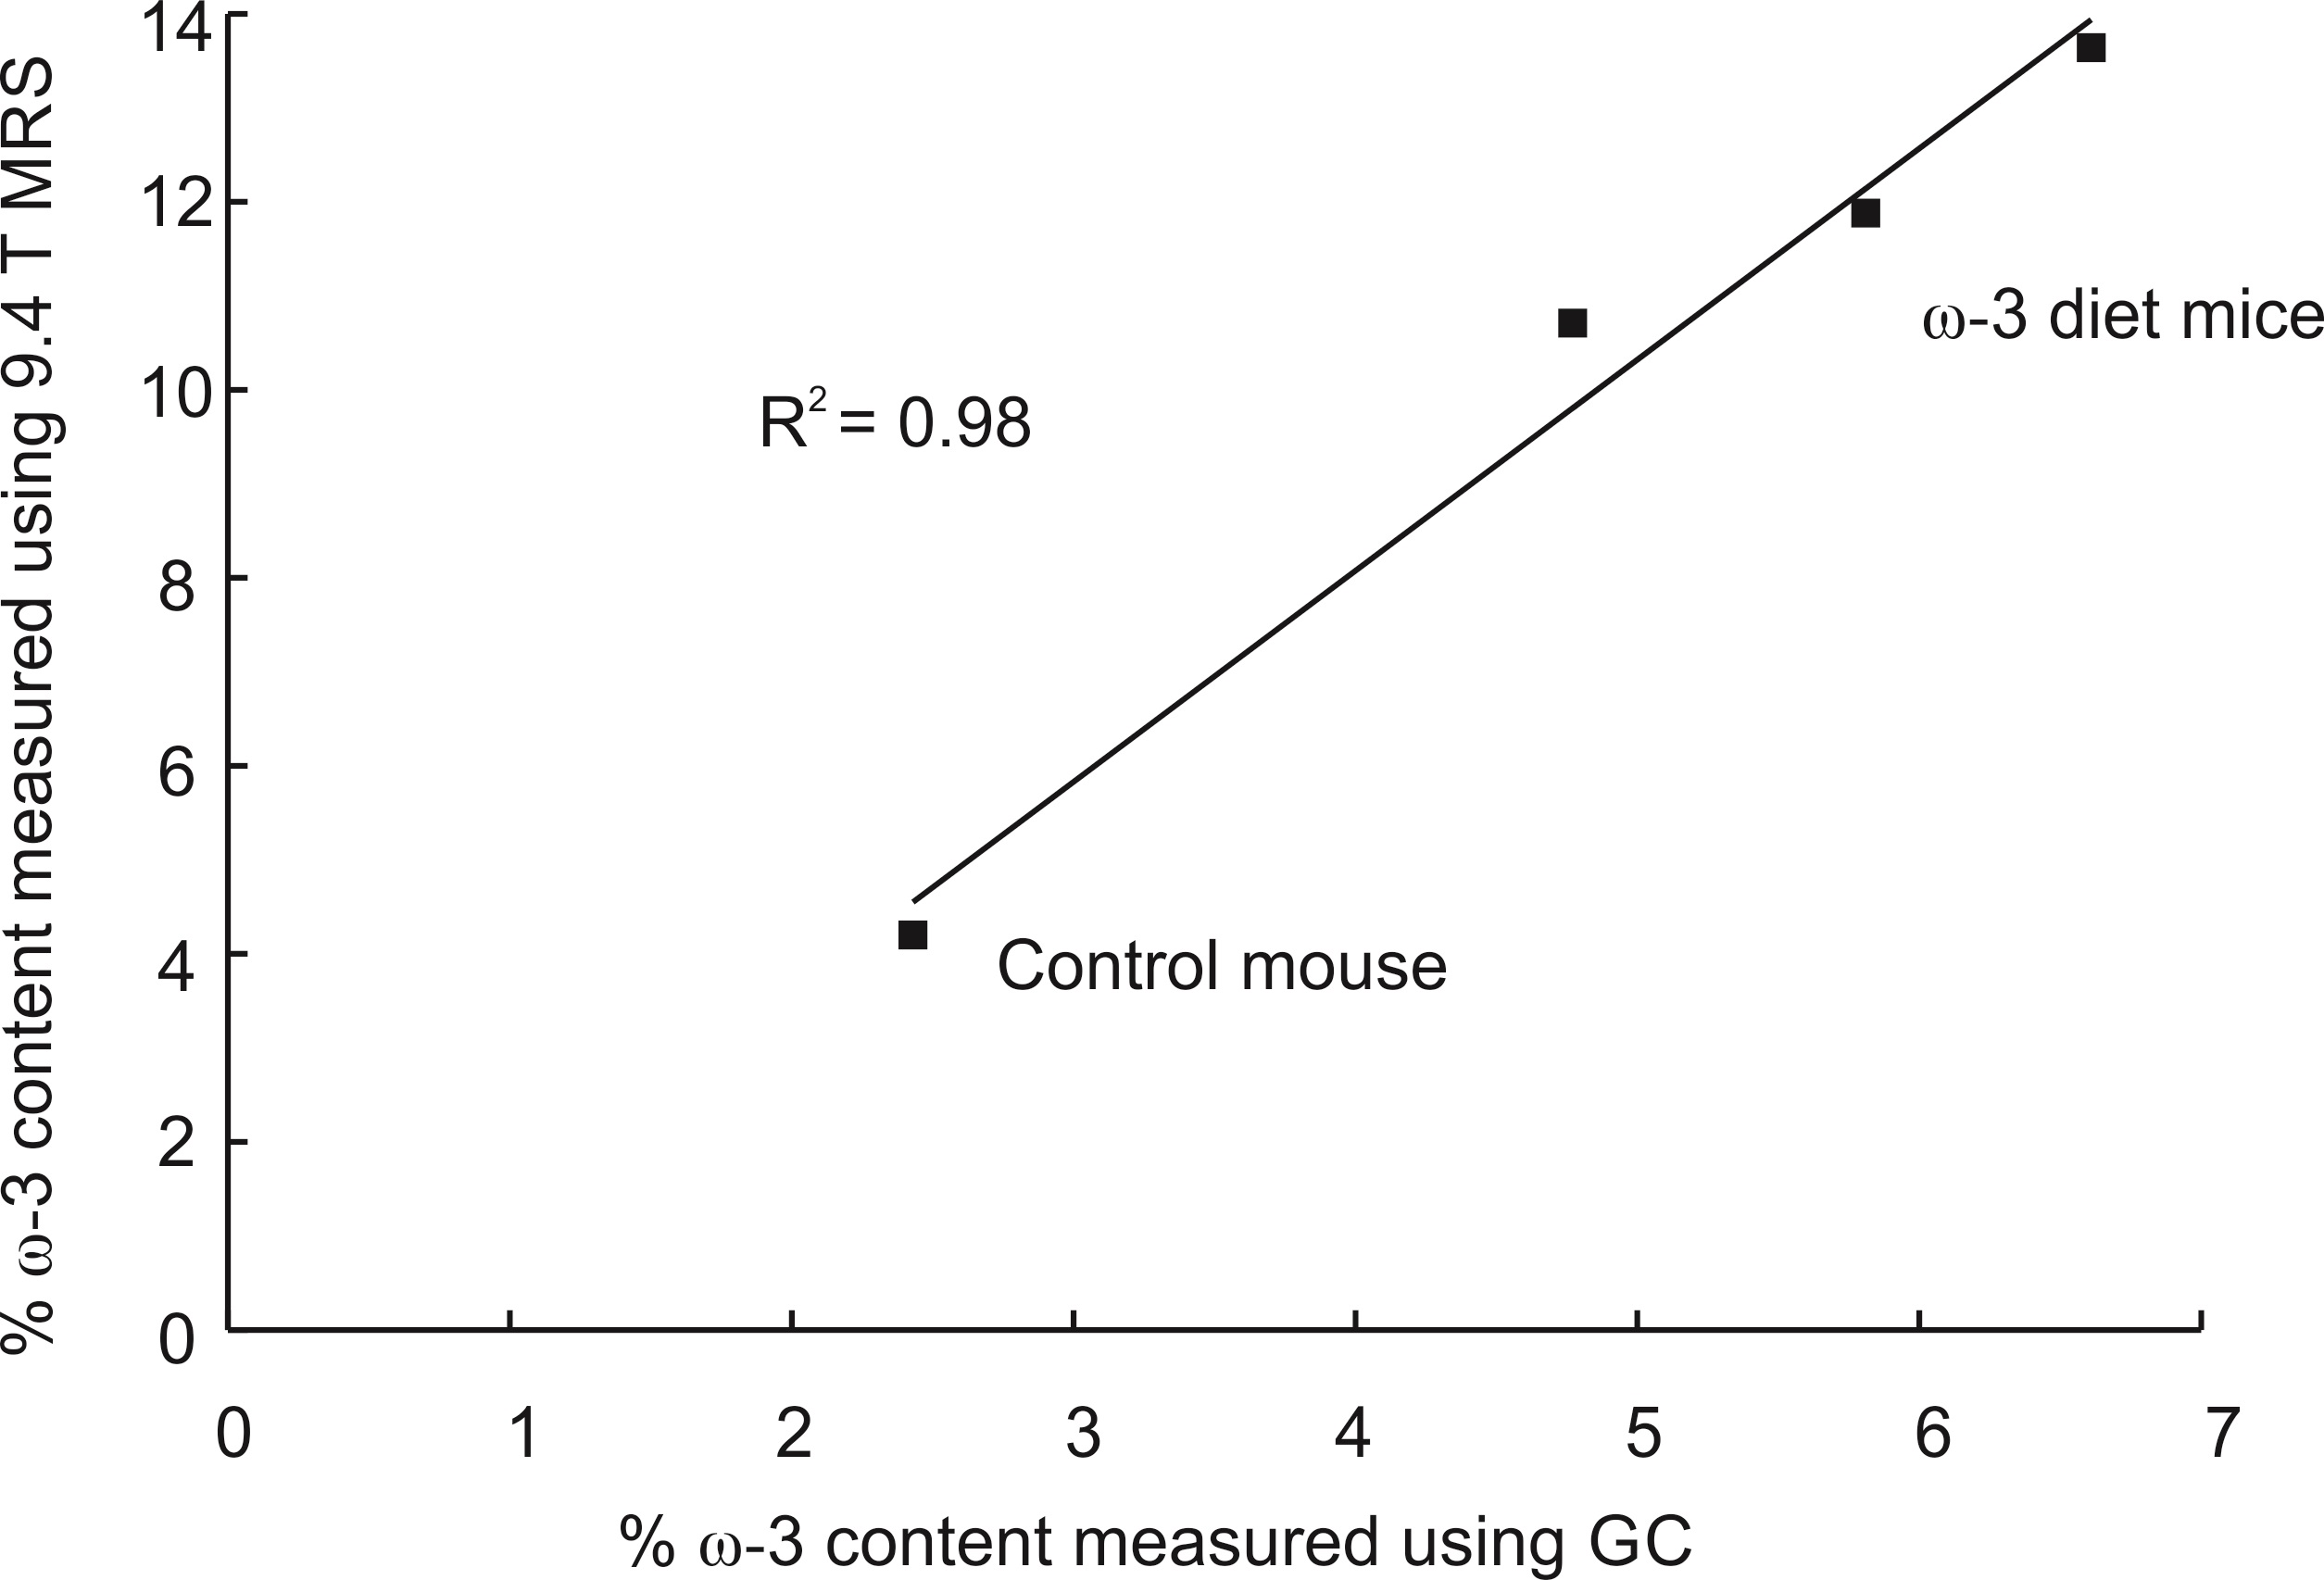
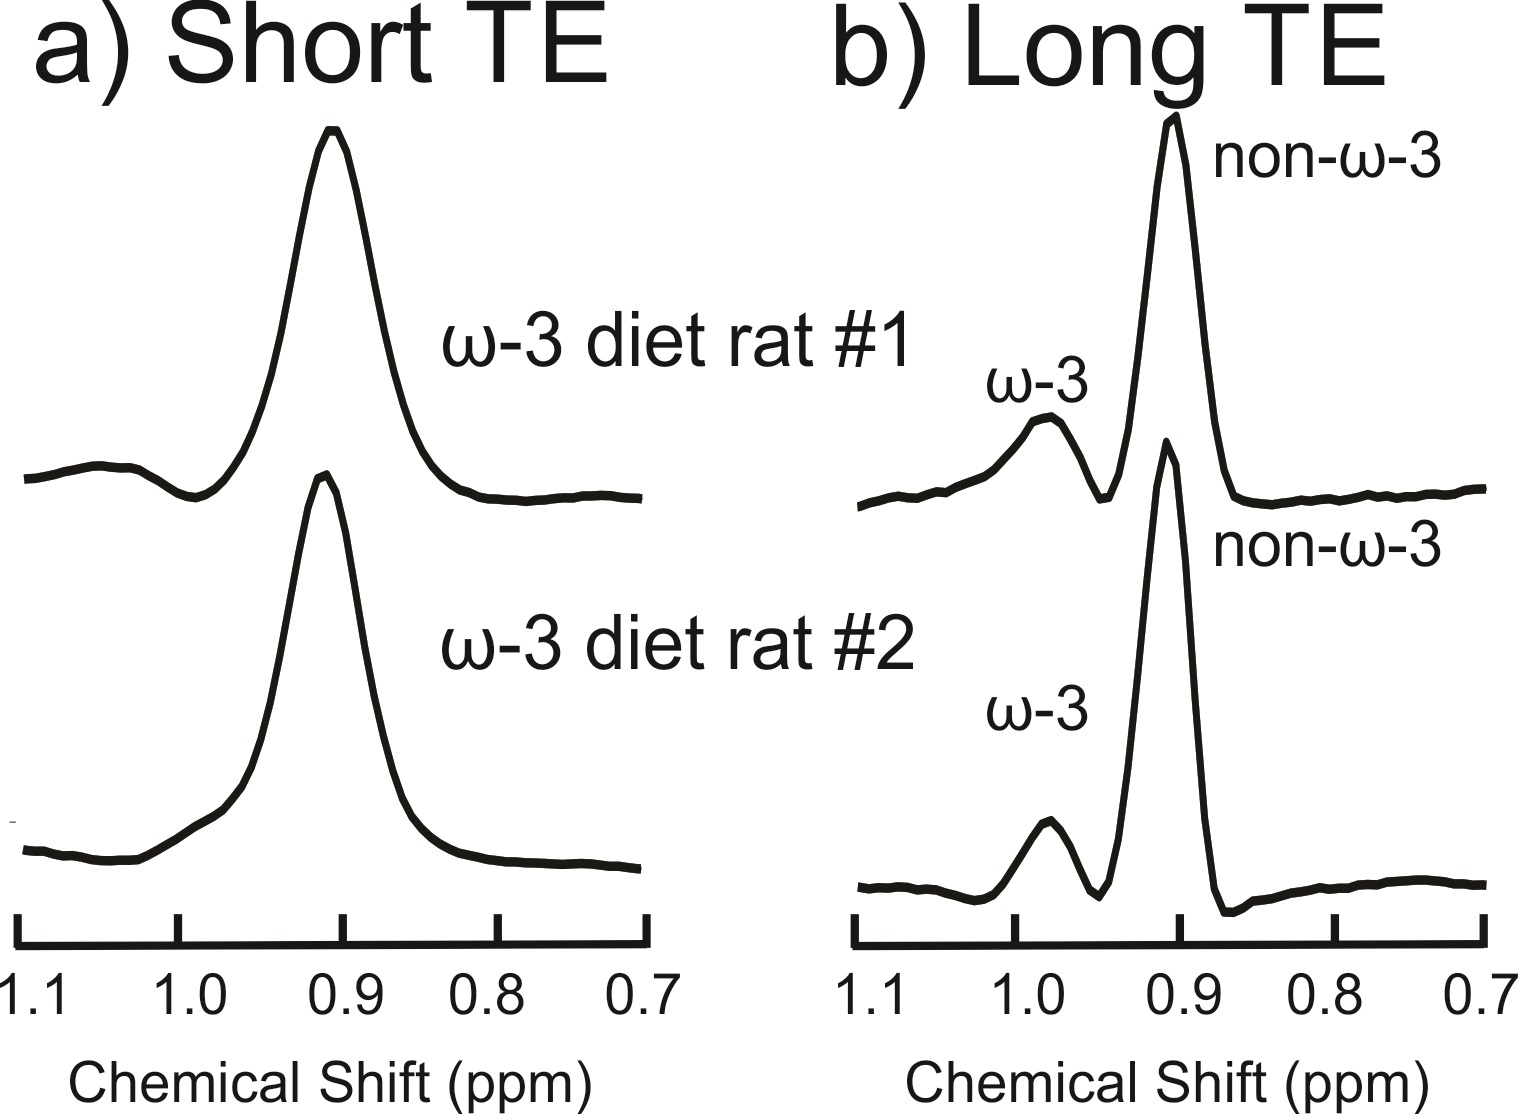
Figure 2(a) displays the spectra acquired from the ω-3 fat diet mice and the control mouse with the short-TE PRESS sequence. Only one mouse in the ω-3 diet group exhibited an ω-3 methyl shoulder in its short-TE spectrum; the ω-3 and non-ω-3 methyl peaks were completely overlapped in all the other mice. Figure 2(b) displays the long-TE methyl spectra from each of the mice. Figure 3 displays the correlation between % ω-3 content using GC and long-TE MRS for the four mice; R2 = 0.98. The % ω-3 content in the mice computed from GC were on average 5.7 ± 0.9% for the ω-3 diet mice and 2.4% for the control mouse. No ω-3 MRS signal was detectable in the control mouse using the short TE; however, ω-3 signal was observed using the long-TE with a signal to noise ratio of ≈26 for the ω-3 resonance. The % ω-3 content obtained using long TE MRS was 20.6 % and 13.5 % in the two rats. Figure 4 displays the PRESS spectra acquired from the rats using the short-TE and the optimized long TE.Discussion
Spectral overlap between the ω-3 and non-ω-3 methyl resonances renders it challenging to quantify ω-3 with MRS using standard short- TE methods, even at 9.4T (as shown in Figures 2(a) and 4(a)). Using PRESS with a TE of 109 ms resolves the two methyl peaks (Figures 2(b) and 4(b)). Figure 3 demonstrates the efficacy of the long TE PRESS sequence for relative in-vivo quantification of ω-3 content at 9.4T, detecting small variations in mice fed the same high ω-3 fat diet. MRS measures of ω-3 content are larger than those obtained from GC, likely due to J-coupling effects and differences in T2 relaxation between the ω-3 and non-ω-3 protons. Gas chromatography analysis of the control mouse resulted in about 2.4% ω-3 fat content. This level was observable using the long TE PRESS sequence. The % ω-3 content obtained by long-TE MRS in the two rats was on average 17.1% compared to an average of 12.3% obtained in the three mice. This could indicate that rats may store more ω-3 in their adipose tissue; however, more animals need to be studied to confirm the preliminary findings.Conclusion
PRESS with a TE of 109 ms at 9.4T was employed to estimate relative ω-3 fat content in adipose tissue of mice and rats fed a high ω-3 diet. Rat adipose tissue ω-3 content was higher. The method can be used to study correlations between adipose tissue ω-3 fat content and disease or diet in animal models.Acknowledgements
Grant and student funding from the Natural Sciences and Engineering Research Council of Canada are gratefully acknowledged.References
1.Coelho DF, Pereira-Lancha LO, Chaves DS, et al. Effect of high-fat diets on body composition, lipid metabolism and insulin sensitivity, and the role of exercise on these parameters. Braz J Med Biol Res 2011;44:966-972.
2.Hammad SS, Jones PJ. Dietary fatty acid composition modulates obesity and interacts with obesity-related genes. Lipids 2017;52:803-822.
3.Kaizer LB, N.F., Kriukov V, Tritchler D. Fish consumption and breast cancer risk: an ecological study. Nutr Cancer 1989;12:61-68.
4.Kim J, Lim SY, Shin A, et al. Fatty fish and fish omega-3 fatty acid intakes decrease the breast cancer risk: a case control study. BMC Cancer 2009;9: 10.1 186/1471-2407-9-216.
5.Elbahnasawy AS, Valeeva ER, El-Sayed EM, Stepanova NV. Protective effect of dietary oils containing omega-3 fatty acids against glucocorticoid-induced osteoporosis. J Nutr Health 2019;52:323-331.
6.Orchard TS, Pan X, Cheek F, Ing SW, Jackson RD. A systematic review of omega-3 fatty acids and osteoporosis. Br J Nutr 2012;107: 10.1017/S0007114512001638.
7.Lindeboom L, de Graaf RA. Measurement of lipid composition in human skeletal muscle and adipose tissue with 1H-MRS homonuclear spectral editing. Magn Reson Med 2018;79:619-627.
8.He D, Mustafi D, Fan X, et al. Magnetic resonance spectroscopy detects differential lipid composition in mammary glands on low fat, high animal fat versus high fructose diets. PLOS ONE 2018;13:e0190929.
9.Machann J, Stefan N, Schabel C, et al. Fraction of unsaturated fatty acids in visceral adipose tissue (VAT) is lower in subjects with high total VAT volume - a combined 1H MRS and volumetric MRI study in male subjects. NMR Biomed 2013;26:232-236.
10.Hodson L, Skeaff CM, Fielding BA. Fatty acid composition of adipose tissue and blood in humans and its use as a biomarker of dietary intake. Prog Lipid Res 2008;47:348-380.
11.Guillén MD, Ruiz A. High resolution 1H nuclear magnetic resonance in the study of edible oils and fats. Trends Food Sci Technol 2001;12:328-338.
12.Gajdošík M, Hingerl L, Škoch A, et al. Ultralong TE in vivo 1H NMR spectroscopy of omega-3 fatty acids in subcutaneous adipose tissue at 7 T. J Magn Reson Imaging 2019;50:71-82.
13.Baracos VE, Mazurak VC, Ma DWL. n-3 Polyunsaturated fatty acids throughout the cancer trajectory: influence on disease incidence, progression, response to therapy and cancer-associated cachexia. Nutrition Research Reviews 2004;17:177-192.
14.Bougnoux P, Koscielny S, Chajès V, Descamps P, Couet C, Calais G. α- Linolenic acid content of adipose breast tissue: a host determinant of the risk of early metastasis in breast cancer. Br J Cancer 1994;70:330-334.
15.Garaulet M, Hernandez-Morante JJ, Lujan J, Tebar FJ, Zamora S. Relationship between fat cell size and number and fatty acid composition in adipose tissue from different fat depots in overweight/obese humans. Int J Obes 2006;30:899-905.
16.Garaulet M, Pérez-Llamas F, Pérez-Ayala M, et al. Site-specific differences in the fatty acid composition of abdominal adipose tissue in an obese population from a Mediterranean area: relation with dietary fatty acids, plasma lipid profile, serum insulin, and central obesity. Am J Clin Nutr 2001;74:585-591.
17.Simonsen N, van't Veer P, Strain JJ, et al. Adipose tissue omega-3 and omega-6 fatty acid content and breast cancer in the EURAMIC study. Am J Epidemiol 1998;147:342-352.
18.Ouldamer L, Nadal-Desbarats L, Chevalier S, Body G, Goupille C, Bougnoux P. NMR- based lipodomic approach to evaluate controlled dietary intake of lipids in adipose tissue of rat mammary tumor model. J Proteome Res 2016;15:868-878.
19.Ramamonjisoa N, Ratiney H, Mutel E, et al. In vivo hepatic lipid quantification using MRS at 7 Tesla in a mouse model of glycogen storage disease type 1a. J Lipid Res 2013;54:2010-2022.
20.Field CJ, Clandinin MT. Modulation of adipose tissue fat composition by diet: A review. Nutr Res 1984;4:743-755.
21.Lab Supply. Picolab Rodent Diet 20. https://www.labsupplytx.com/labdiet/picolab-rodent-diet-20/
Figures