3850
MRI lipid signatures and SREBPs gene expression profiling for characterisation of glioma: A preliminary study1Diagnostic Radiology, Singapore General Hospital, Singapore, Singapore, 2Department of Biomedical Imaging, University of Malaya, Kuala Lumpur, Malaysia, 3Department of Surgery, University of Malaya, Kuala Lumpur, Malaysia, 4Department of Biomedical Science, University of Malaya, Kuala Lumpur, Malaysia
Synopsis
We explored the relationships between MRI lipid-imaging signatures and sterol regulatory element binding proteins (SREBPs) gene expression profiling of ten histologically proven glioma patients to elucidate the underlying inter- & intra-tumoural lipid distribution changes. The high expression of SREBPs was observed for grade II and III implied reprogramming of lipid metabolism. The identification of imaging biomarkers that can reflect changes in the genetic profiles of SREBP offers a new avenue for personalised medicine and the development of new therapeutic targets.
Body of Abstract
IntroductionThe tumour molecular and imaging heterogeneity are the challenges faced in understanding the underlying molecular activities of glioma. The heterogeneous nature of glioma further complicates the histopathological grading and decision making for treatment management. Prognosis of glioblastoma (GBM) has not significantly changed over several decades despite advances in diagnostic modalities, surgical techniques & adjuvant treatment strategies (median survival=12-15 months) 1. Different responses to treatments by patients were often seen even within the same group classified by grades and subtypes. Earlier works showed elevated lipid levels had high correlations with tumour aggressiveness as defined by glioma grade. Lipid quantifications via lipid mapping constructed using magnetic resonance imaging in- and opposed-phase sequence (MRI-IOP) showed potential as a novel imaging biomarker for grading of glioma into different grades (II, III & IV) 2,3. Given the important role of lipid in cancer metabolism and tumour development, lipid has unexplored potentials for diagnosis, grading, patient prognostication, and therapeutic treatment. Unfortunately, the molecular mechanisms that lead to changes in lipid compositions in tumour tissues remain unclear despite advances in molecular biology. The Sterol regulatory element-binding proteins (SREBPs) are important transcription factors that regulate lipid metabolism thereby playing a crucial role in the regulation of lipogenesis and cholesterol uptake 4,5. SREBP-1 (-1a and -1c) regulates fatty acid synthesis 6 while SREBP-2 regulates cholesterol synthesis 7. SREBP-1 is highly activated in GBM and other cancers for promoting lipid synthesis and tumour growth 8,9. We explored the relationships between lipid-imaging profiles to sterol regulatory element binding proteins (SREBPs) gene expression profiling of the gliomatous tumour to elucidate the underlying inter- & intra-tumoural lipid distribution changes.
Methods
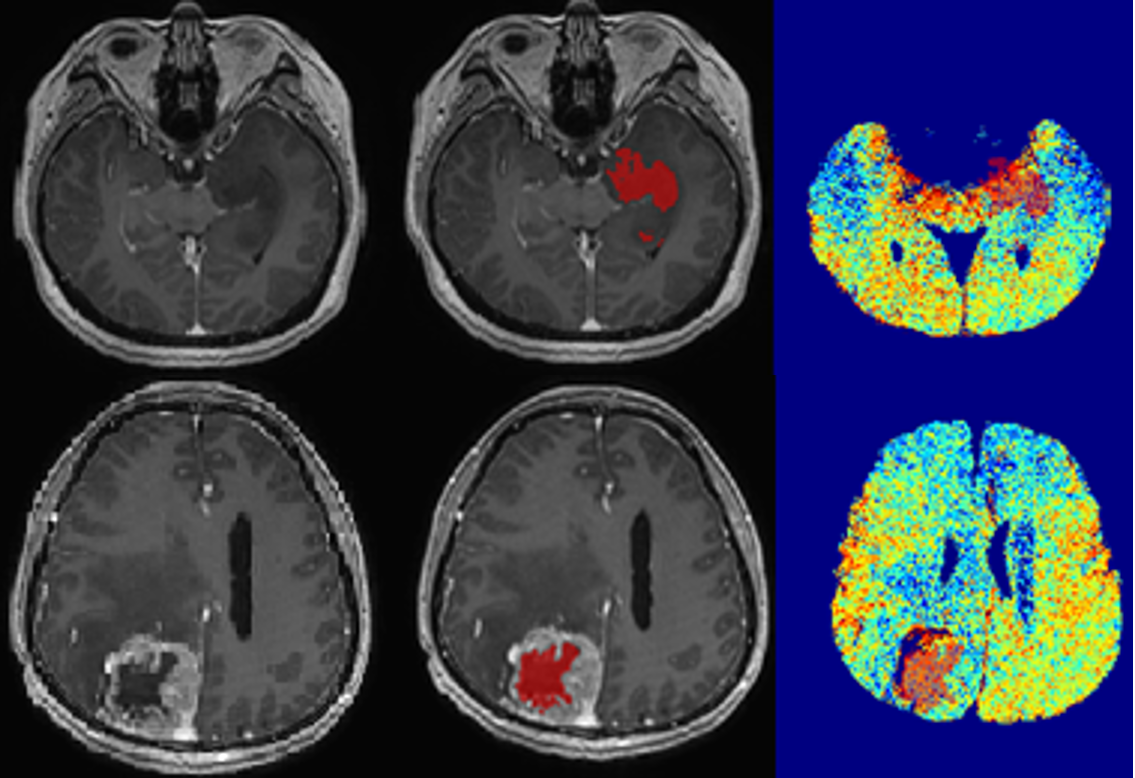
Ten histologically proven glioma patients underwent a standard pre-operative MRI tumour protocol with in-and opposed-phase (IOP) MRI on a 3T MRI (Signa HDx, General Electric, USA). The biopsy specimens were evaluated using gold-standard histopathological analysis according to the WHO grading scheme. The solid non-enhancing regions of tumour were delineated on post-contrast T1 images using a semi-automated segmentation approach, i.e. snake model implemented in ITK-SNAP 10 with reference to structural MRI images. The lipid map was constructed by subtraction of the opposed-phase image from in-phase image after skull stripping and registration using SPM12. The lipid fractions were derived from the segmented non-enhancing tumour regions overlaid on the MRI IOP-constructed lipid map. The resected tissue samples (3x3x3mm3) were collected for correlation with SREBPs gene expression profiling. The tissue sample from 3 histology normal patients were used as control. Brain tumour tissues (30 mg) were homogenized with a mortar and pester. RNA extraction was performed using RNeasy lipid tissue mini kit followed by cDNA synthesis using one-step reverse transcription protocol (Quantinova Reverse Transcription Kit). A Taq-Man probe-based quantitative real-time PCR was performed using StepOne Real-Time PCR System to evaluate the level of SREBP-1 and SREBP-2 gene expression. For this analysis, TBP gene was used as the reference gene.
Results
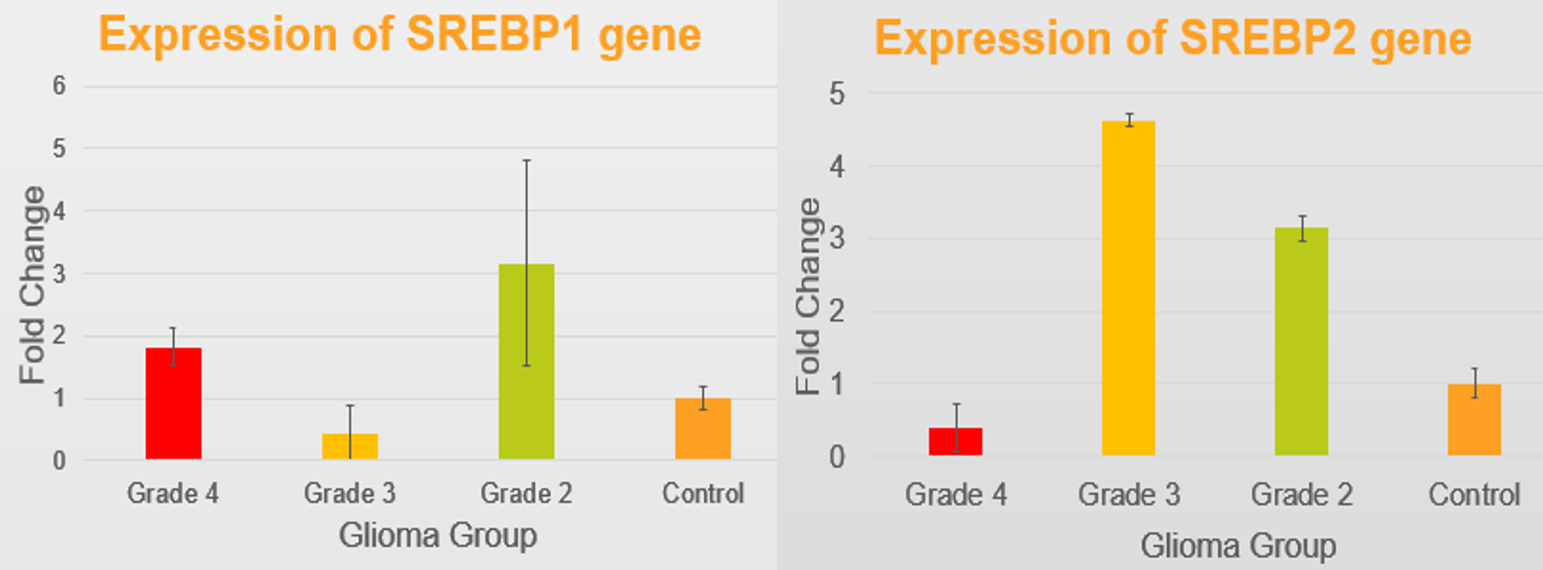
The lipid fraction (LF) of the solid non-enhancing region was higher for grade IV (mean LFIV=0.073) compared to grade II and III (mean LFII=0.053, and mean LFIII=0.057) (Figure 1). Gene expression analysis showed that SREBP-1 expression was increased by 7-fold change in grade II (Figure 2). Gene expression of SREBP-2 however was increased by 9-fold change in grade II, and by 13-fold change in grade III compared with controls, suggesting SREBPs were highly expressed in both grade II and grade III. The expression of SREBP-2 was lower by 3.5- fold change in grade IV compared with normal controls.
Discussion
Our preliminary results demonstrated a high expression of SREBPs for grade II and III, implying lipid distribution change that could be reflected using MRI IOP. Genetic or pharmaceutical inhibition of SREBP1 in GBM significantly induces cell death, suggesting that SREBP1 is a promising therapeutic target. Data from literature showed that GBM cells with activated RTK signalling are dependent on the SREBP-1-regulated de novo fatty acid synthesis pathway for survival and malignant growth 5. Fern et al. reported accumulation of cytoplasmic lipid droplets via MRS after induction of apoptosis as non-invasive marker of tumour cell death post-treatment in GBM 11. The accumulation arises from several possible reasons such as redistribution of different lipid species between cellular compartments, increased neutral lipid synthesis during an active phase of apoptosis, increased lipid content caused by organelle degradation or autophagy, or enhanced phospholipase activity. Rapidly proliferating cancer cells with highly activated signal transduction networks, such as GBM cells, have increased requirements for cholesterol 12. Cholesterol is required for the biogenesis, maintenance of fluidity of cell membranes, and as central component of lipid rafts, specialised microdomains of the plasma membrane that serve as organising centres for the assembly of signalling molecules. However, the molecular mechanisms by which GBM cells obtain sufficient cholesterol and the potential therapeutic targetability of this process are not well understood.
Conclusion
The high expression of SREBPs was observed for grade II and III implied reprogramming of lipid metabolism. The low expression of SREBPs coincides with higher lipid fraction in Grade IV glioma, which may indicate exhaustion of lipogenesis regulation. Imaging markers may act as surrogate biomarkers to reflect changes in the regulation of lipid metabolism and synthesis.
Acknowledgements
This work was supported by the University Malaya Fundamental Research Grant Scheme (FP009-2016 and FP018-2019A). The authors gratefully acknowledge the essential contributions of the research staff of University of Malaya Research Imaging Centre (UMRIC).References
1. Ha SJ, Showalter G, Cai S, et al. Lipidomic analysis of glioblastoma multiforme using mass spectrometry. 2014;2(2):132-143.
2. Ramli N, Khairy AM, Seow P, et al. Novel application of chemical shift gradient echo in- and opposed-phase sequences in 3 T MRI for the detection of H-MRS visible lipids and grading of glioma. European Radiology. 2015(26):7.
3. Seow P, Narayanan V, Hernowo AT, Wong JHD, Ramli N. Quantification and visualization of lipid landscape in glioma using in -and opposed-phase imaging. NeuroImage: Clinical. 2018;20:531-536. 4. Guo D, Bell E, Chakravarti A. Lipid metabolism emerges as a promising target for malignant glioma therapy. CNS oncology. 2013;2(3):289-299.
5. Ru P, Williams T, Chakravarti A, Guo D. Tumor Metabolism of Malignant Gliomas. Cancers. 2013;5(4):1469-1484.
6. Shimano H. Sterol regulatory element-binding proteins (SREBPs): transcriptional regulators of lipid synthetic genes. Progress in Lipid Research. 2001;40(6):439-452.
7. Brown MS, Goldstein JL. The SREBP Pathway: Regulation of Cholesterol Metabolism by Proteolysis of a Membrane-Bound Transcription Factor. Cell. 1997;89(3):331-340.
8. Guo D, Prins RM, Dang J, et al. EGFR Signaling Through an Akt-SREBP-1–Dependent, Rapamycin-Resistant Pathway Sensitizes Glioblastomas to Antilipogenic Therapy. Science Signaling. 2009;2(101):ra82-ra82.
9. Shao W, Espenshade Peter J. Expanding Roles for SREBP in Metabolism. Cell Metabolism. 2012;16(4):414-419. 1
0. Yushkevich PA, Gerig G. ITK-Snap version 3.6.0. Available via http://www.itksnap.org. 2011, 2017. 11. Fernø J, Raeder MB, Vik-Mo AO, et al. Antipsychotic drugs activate SREBP-regulated expression of lipid biosynthetic genes in cultured human glioma cells: a novel mechanism of action? The Pharmacogenomics Journal. 2005;5:298.
12. Guo D, Reinitz F, Youssef M, et al. An LXR Agonist Promotes Glioblastoma Cell Death through Inhibition of an EGFR/AKT/SREBP-1/LDLR–Dependent Pathway. Cancer Discovery. 2011.
Figures