3848
Optimal experimental design for quantitative water, fat and silicone separation using a variable projection method with 4 or 6 echoes at 3T1Department of Diagnostic and Interventional Radiology, School of Medicine, Technical University of Munich, Munich, Germany, 2Division of Infectious Diseases and Tropical Medicine, University Hospital, LMU Munich, Munich, Germany, 3Philips Healthcare, Hamburg, Germany
Synopsis
Patients with silicone breast implants undergoing MR mammography are examined with a water- and fat-suppressed sequence to verify the implant’s integrity. In parallel, chemical shift encoding-based water–fat separation has been recently used for quantifying breast water-fat composition to assess breast density and for extracting magnetic susceptibility maps to detect breast calcifications. In this work, a water–fat–silicone separation method is developed for a joint estimation of all three components and applied with NSA-optimized echo times to simulated single-voxel data, scanner phantom and in vivo data showing robust species separation and fat fraction mapping.
Purpose
Silicone implants are commonly used for breast augmentation or breast reconstruction after mastectomy. MRI is a sensitive method for monitoring the implant’s integrity to detect possible ruptures1. T2-weighted turbo spin echo acquisitions employing frequency-selective water suppression and short tau inversion recovery (STIR) for fat suppression are clinically primarily used to generate silicone-only images with bright silicone signal2,3. In parallel, multi-echo gradient echo imaging acquisitions have been also recently combined with chemical shift encoding-based water–fat separation for quantifying water–fat composition to assess breast density4 and for extracting magnetic susceptibility maps to detect breast calcifications5-7. However, there is still limited knowledge on how to simultaneously separate three chemical species in the breast in the presence of water, fat, and silicone. The present work aims to develop a methodology for the joint estimation of the field-map as well as water, fat, and silicone images based on the variable projection (VARPRO) method for chemical species seperation8, to find optimal experiment parameters using the Cramér–Rao analysis9, and to demonstrate the method for Dixon acquisitions with 4 or 6 echoes in numerical simulations, in a phantom and in vivo.Methods
Parameter estimation for three speciesThe water–fat voxel signal model10 was extended for silicone and its chemical shift of -4.9 ppm11:
$$s(t_n)=(\rho_W+\rho_F(\sum_{p=1}^P\alpha_pe^{i2\pi f_{F,p}t_n})+\rho_Se^{i2\pi f_S t_n})e^{i2\pi \phi t_n}e^{-R_2^*t_n}$$ where $$$t_n$$$ is the echo time shift, $$$\phi$$$ is the field-map, $$$\alpha_i$$$ are the relative amplitudes for the spectral fat model for $$$i\in\{1,..,P\}$$$, $$$ f_{j}$$$ are the resonance frequencies in consideration of temperature shift effects12 and $$$\rho_j$$$ are the complex signals of the water, fat and silicone components assuming a common transverse relaxation rate $$$R_2^*$$$.
Residuals were calculated using the VARPRO method8 and all local minima were extracted and inserted to a single-min-cut variable-layer graph-cut algorithm13 for field-mapping:
$$\{\rho_W,\rho_F,\rho_S,\phi,R_2^*\}=\operatorname*{argmin}_{\rho_W,\rho_F,\rho_S,\phi,R_2^*}\sum_{n=1}^{N_{TE}}|s(t_n)-y_n|^2$$ where $$$y_n$$$ is the measured signal for the n-th echo and $$$N_{TE}$$$ is the number of echoes.
Based on the global optimal field-map yielded by the graph-cut, the water, fat and silicone images can be computed with consideration of the $$$T_2^*$$$ decay14. Proton density fat fraction (PDFF) maps were calculated with correction for noise bias effects using magnitude discrimination15,16.
Cramér–Rao analysis
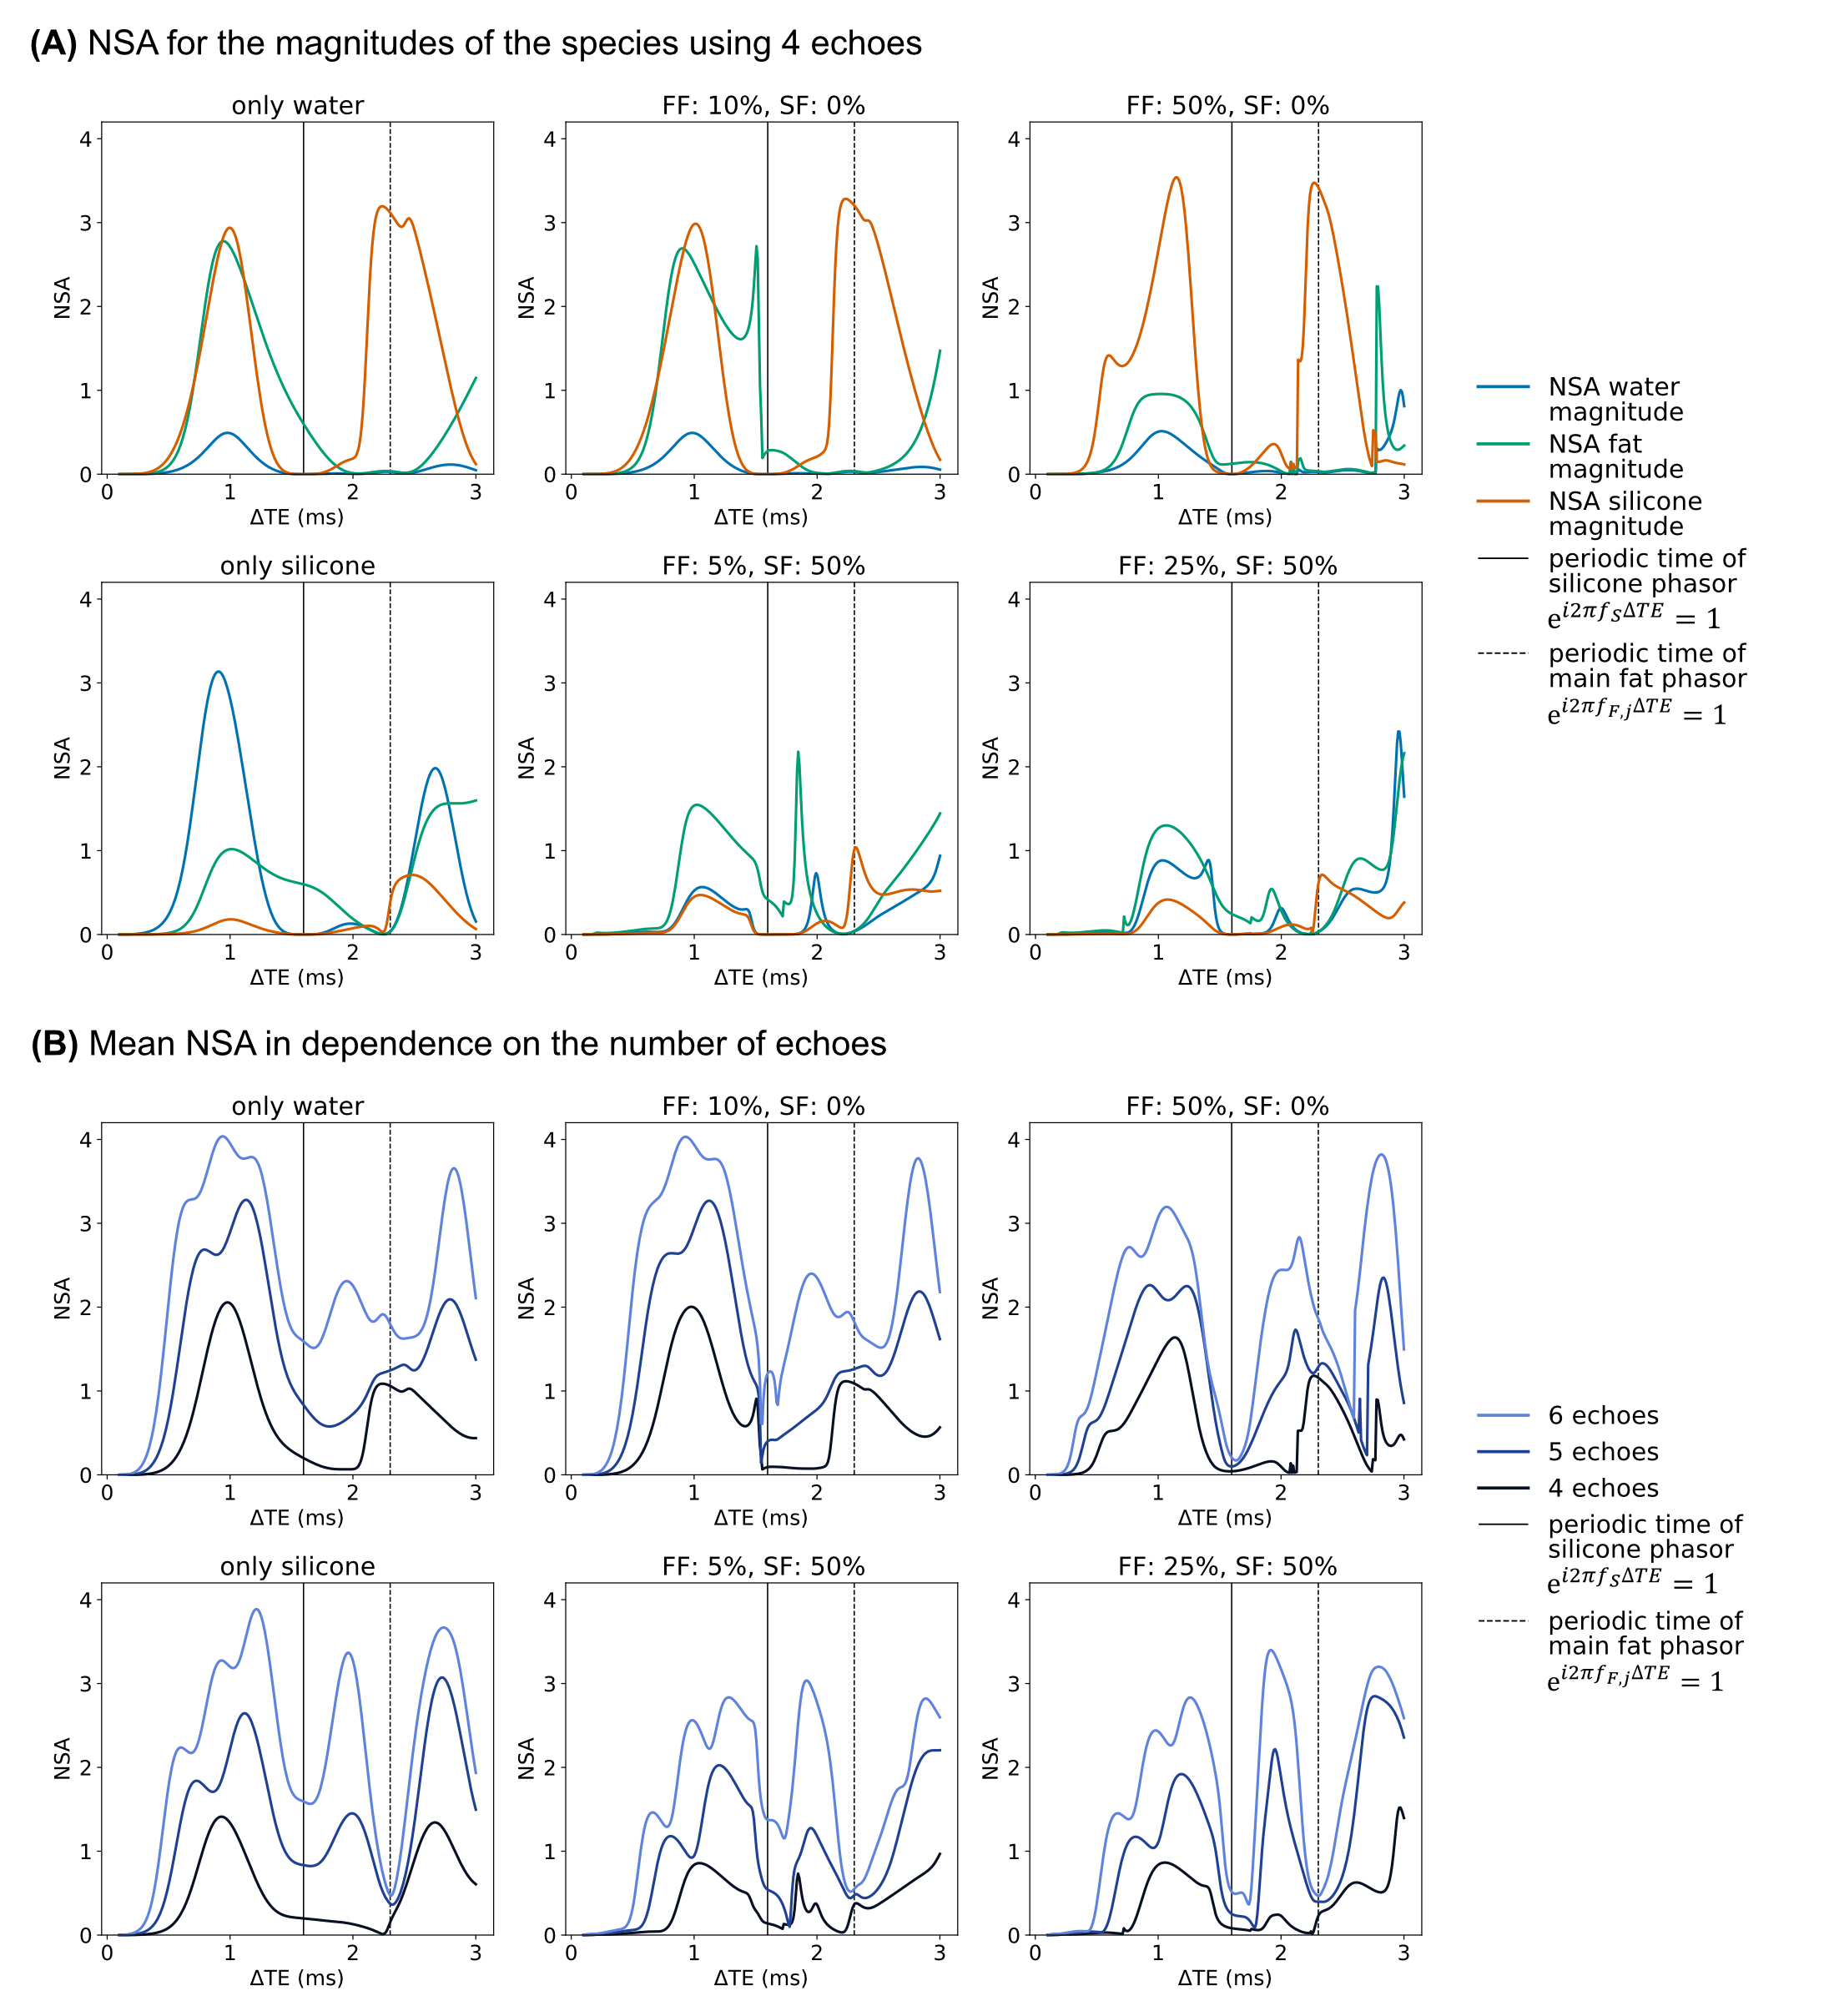
The selection of echo times was optimized based on the Cramér–Rao analysis using the Fisher Information Matrix9,17 to minimize the noise variance expressed by the number of signal averages (NSA)9.
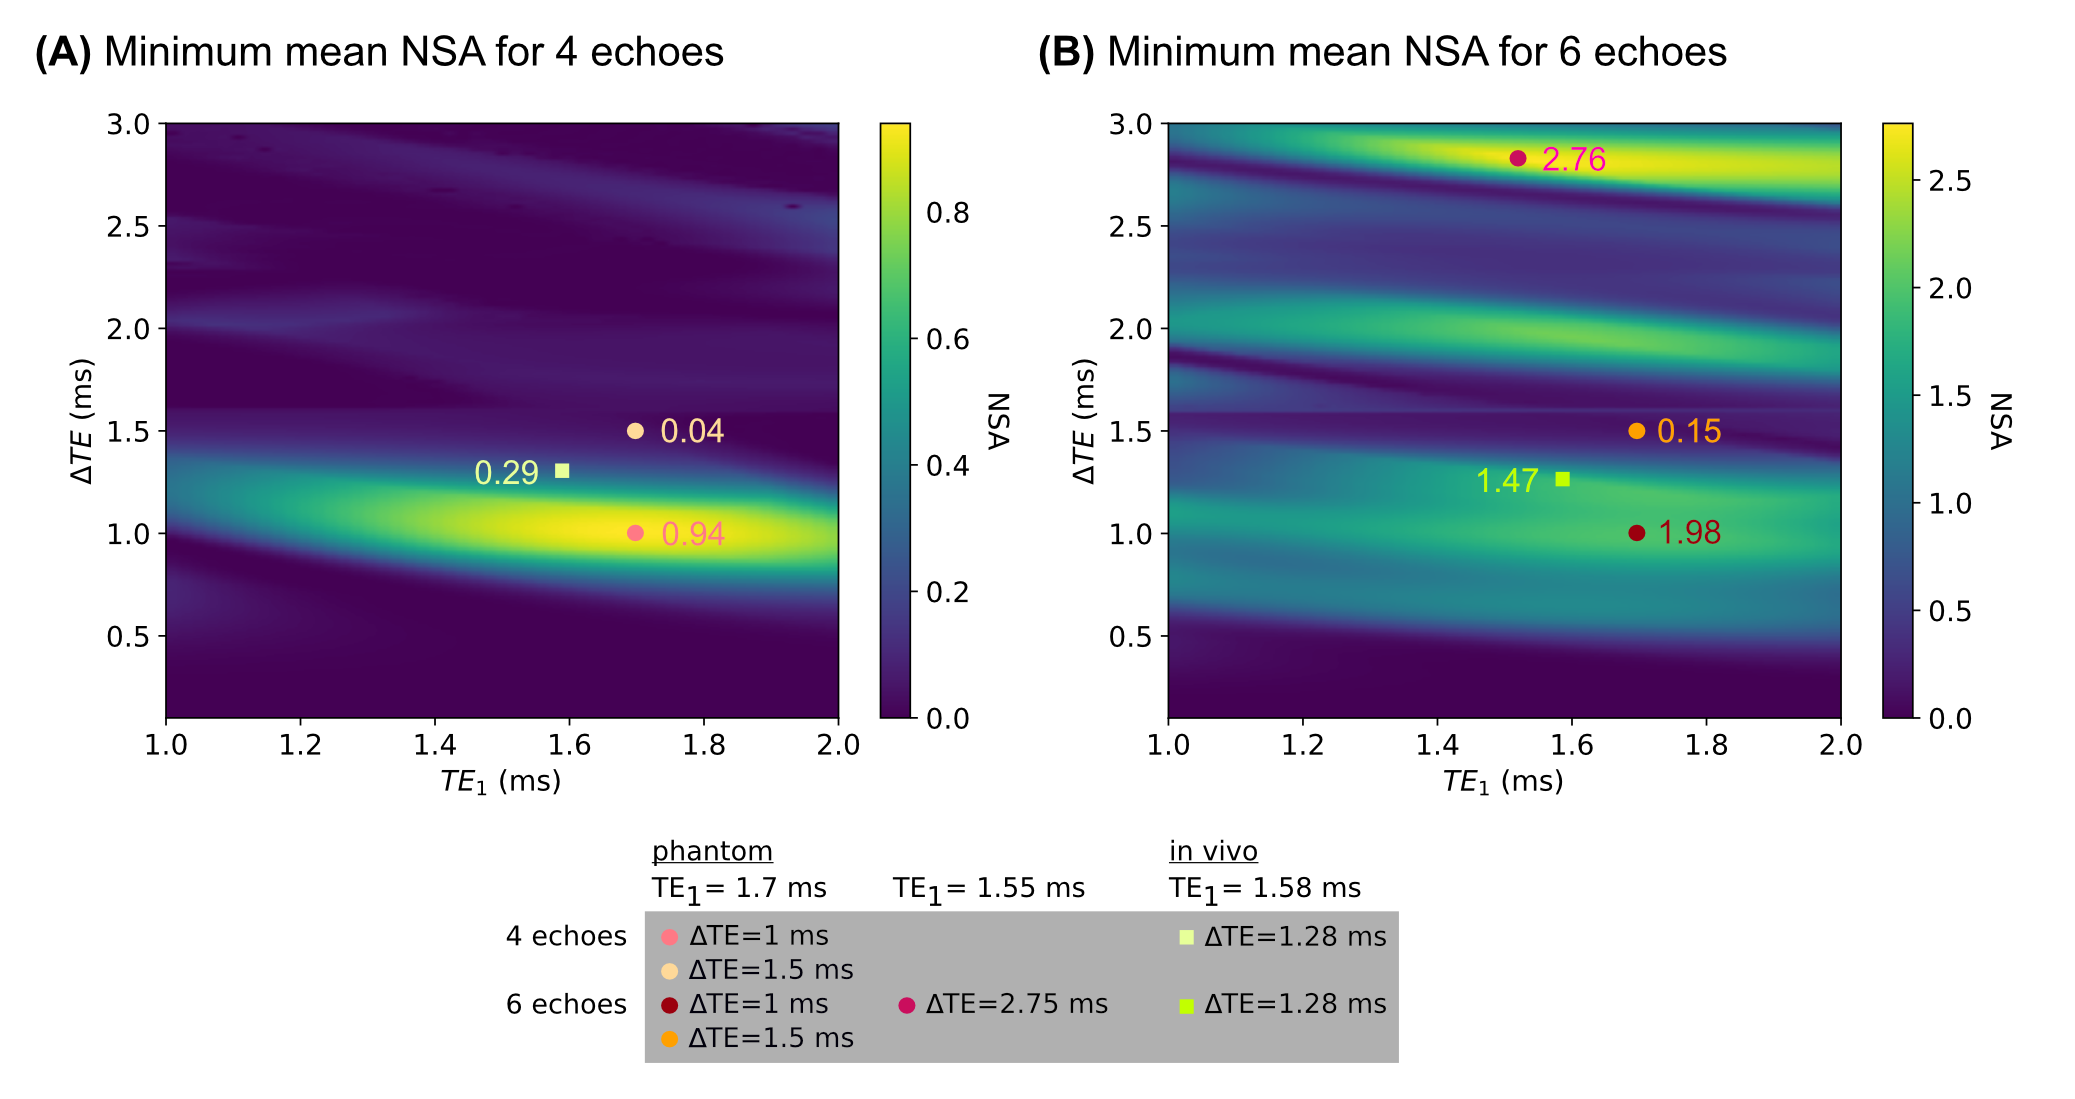
Several water–fat–silicone-fractions were analyzed based on its noise performance in dependence on the number and spacing of echoes. For experiment optimization, the mean NSA for the magnitudes of the species was computed and the minimum value for different water–fat–silicone-fractions was compared for varying echo spacings and first echo times.
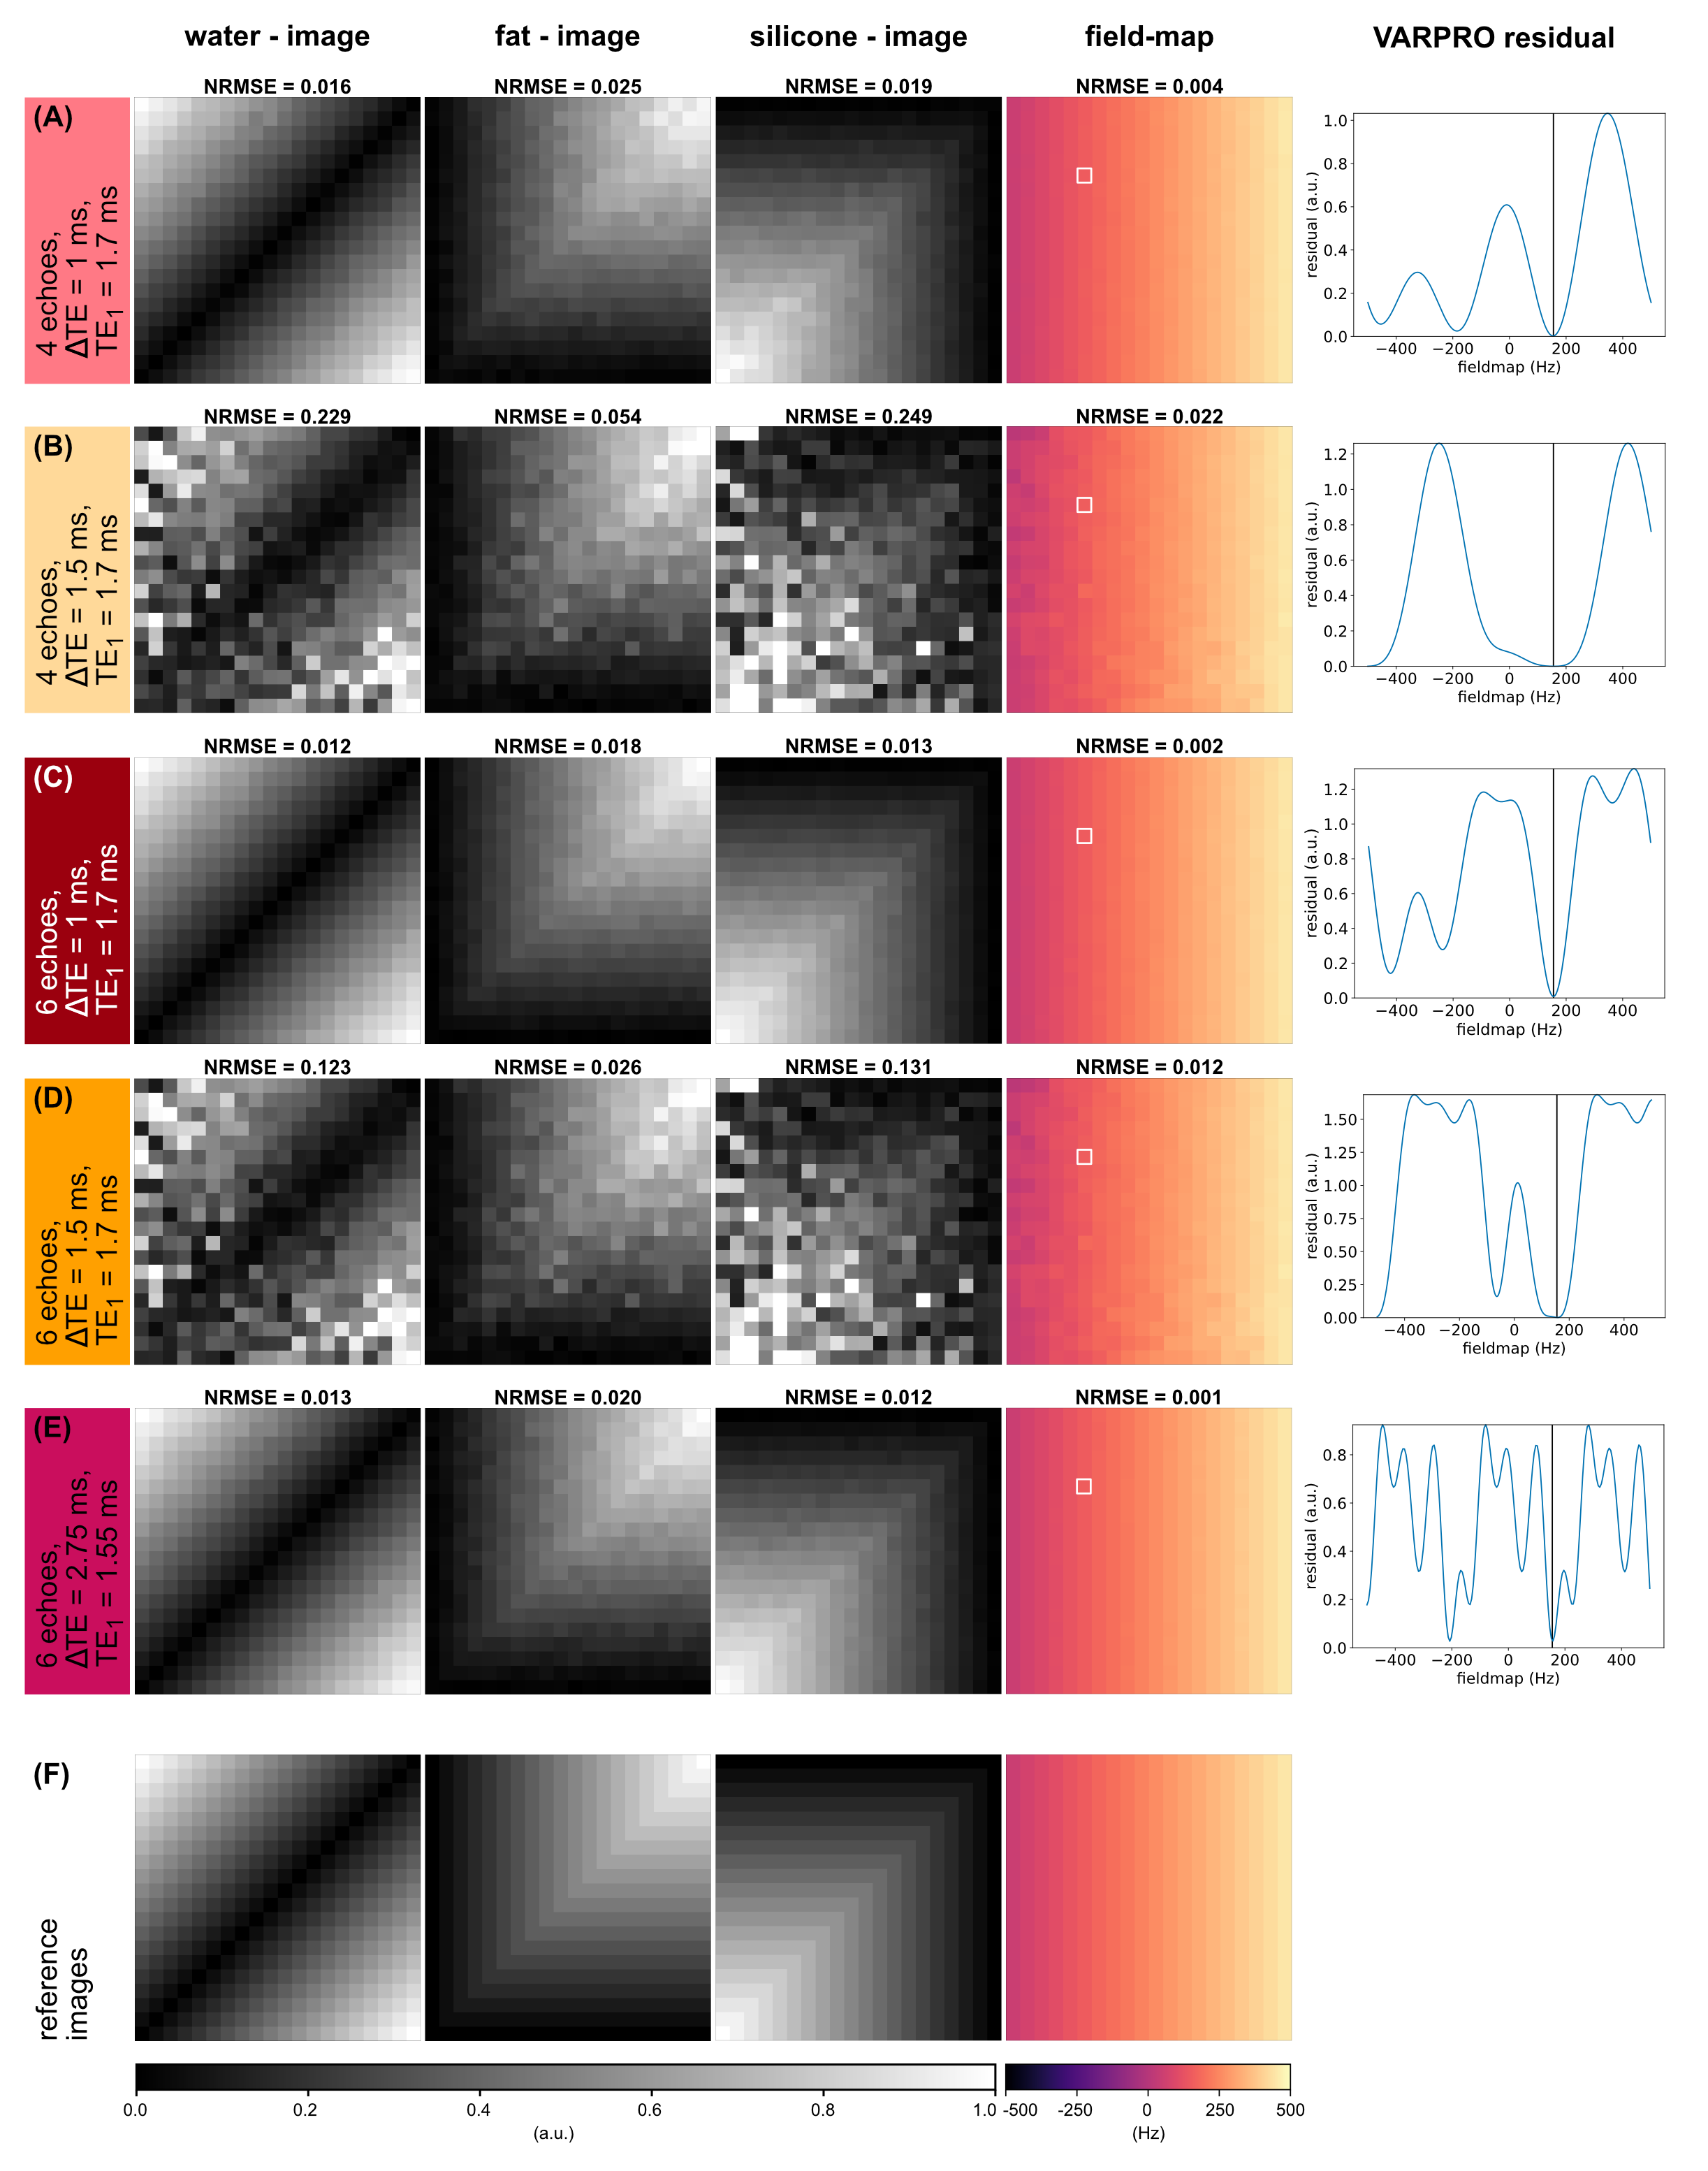
Numerical phantom
A numerical phantom (20x20x1 voxels) consisting of different fat and silicone fractions in the range of 0% to 100% with constant $$$R_2^*$$$=50 Hz was simulated based on the water–fat–silicone signal model. A constant echo spacing with ΔTE$$$\in$$${1, 1.5}ms, TE1=1.7 ms for 4 and 6 echoes and ΔTE=2.75 ms, TE1=1.55 ms for 6 echoes was simulated based on the results of the Cramér–Rao analysis. A ramp map was specified as field-map and Rician noise18 with SNR=100 was added.
MR measurements
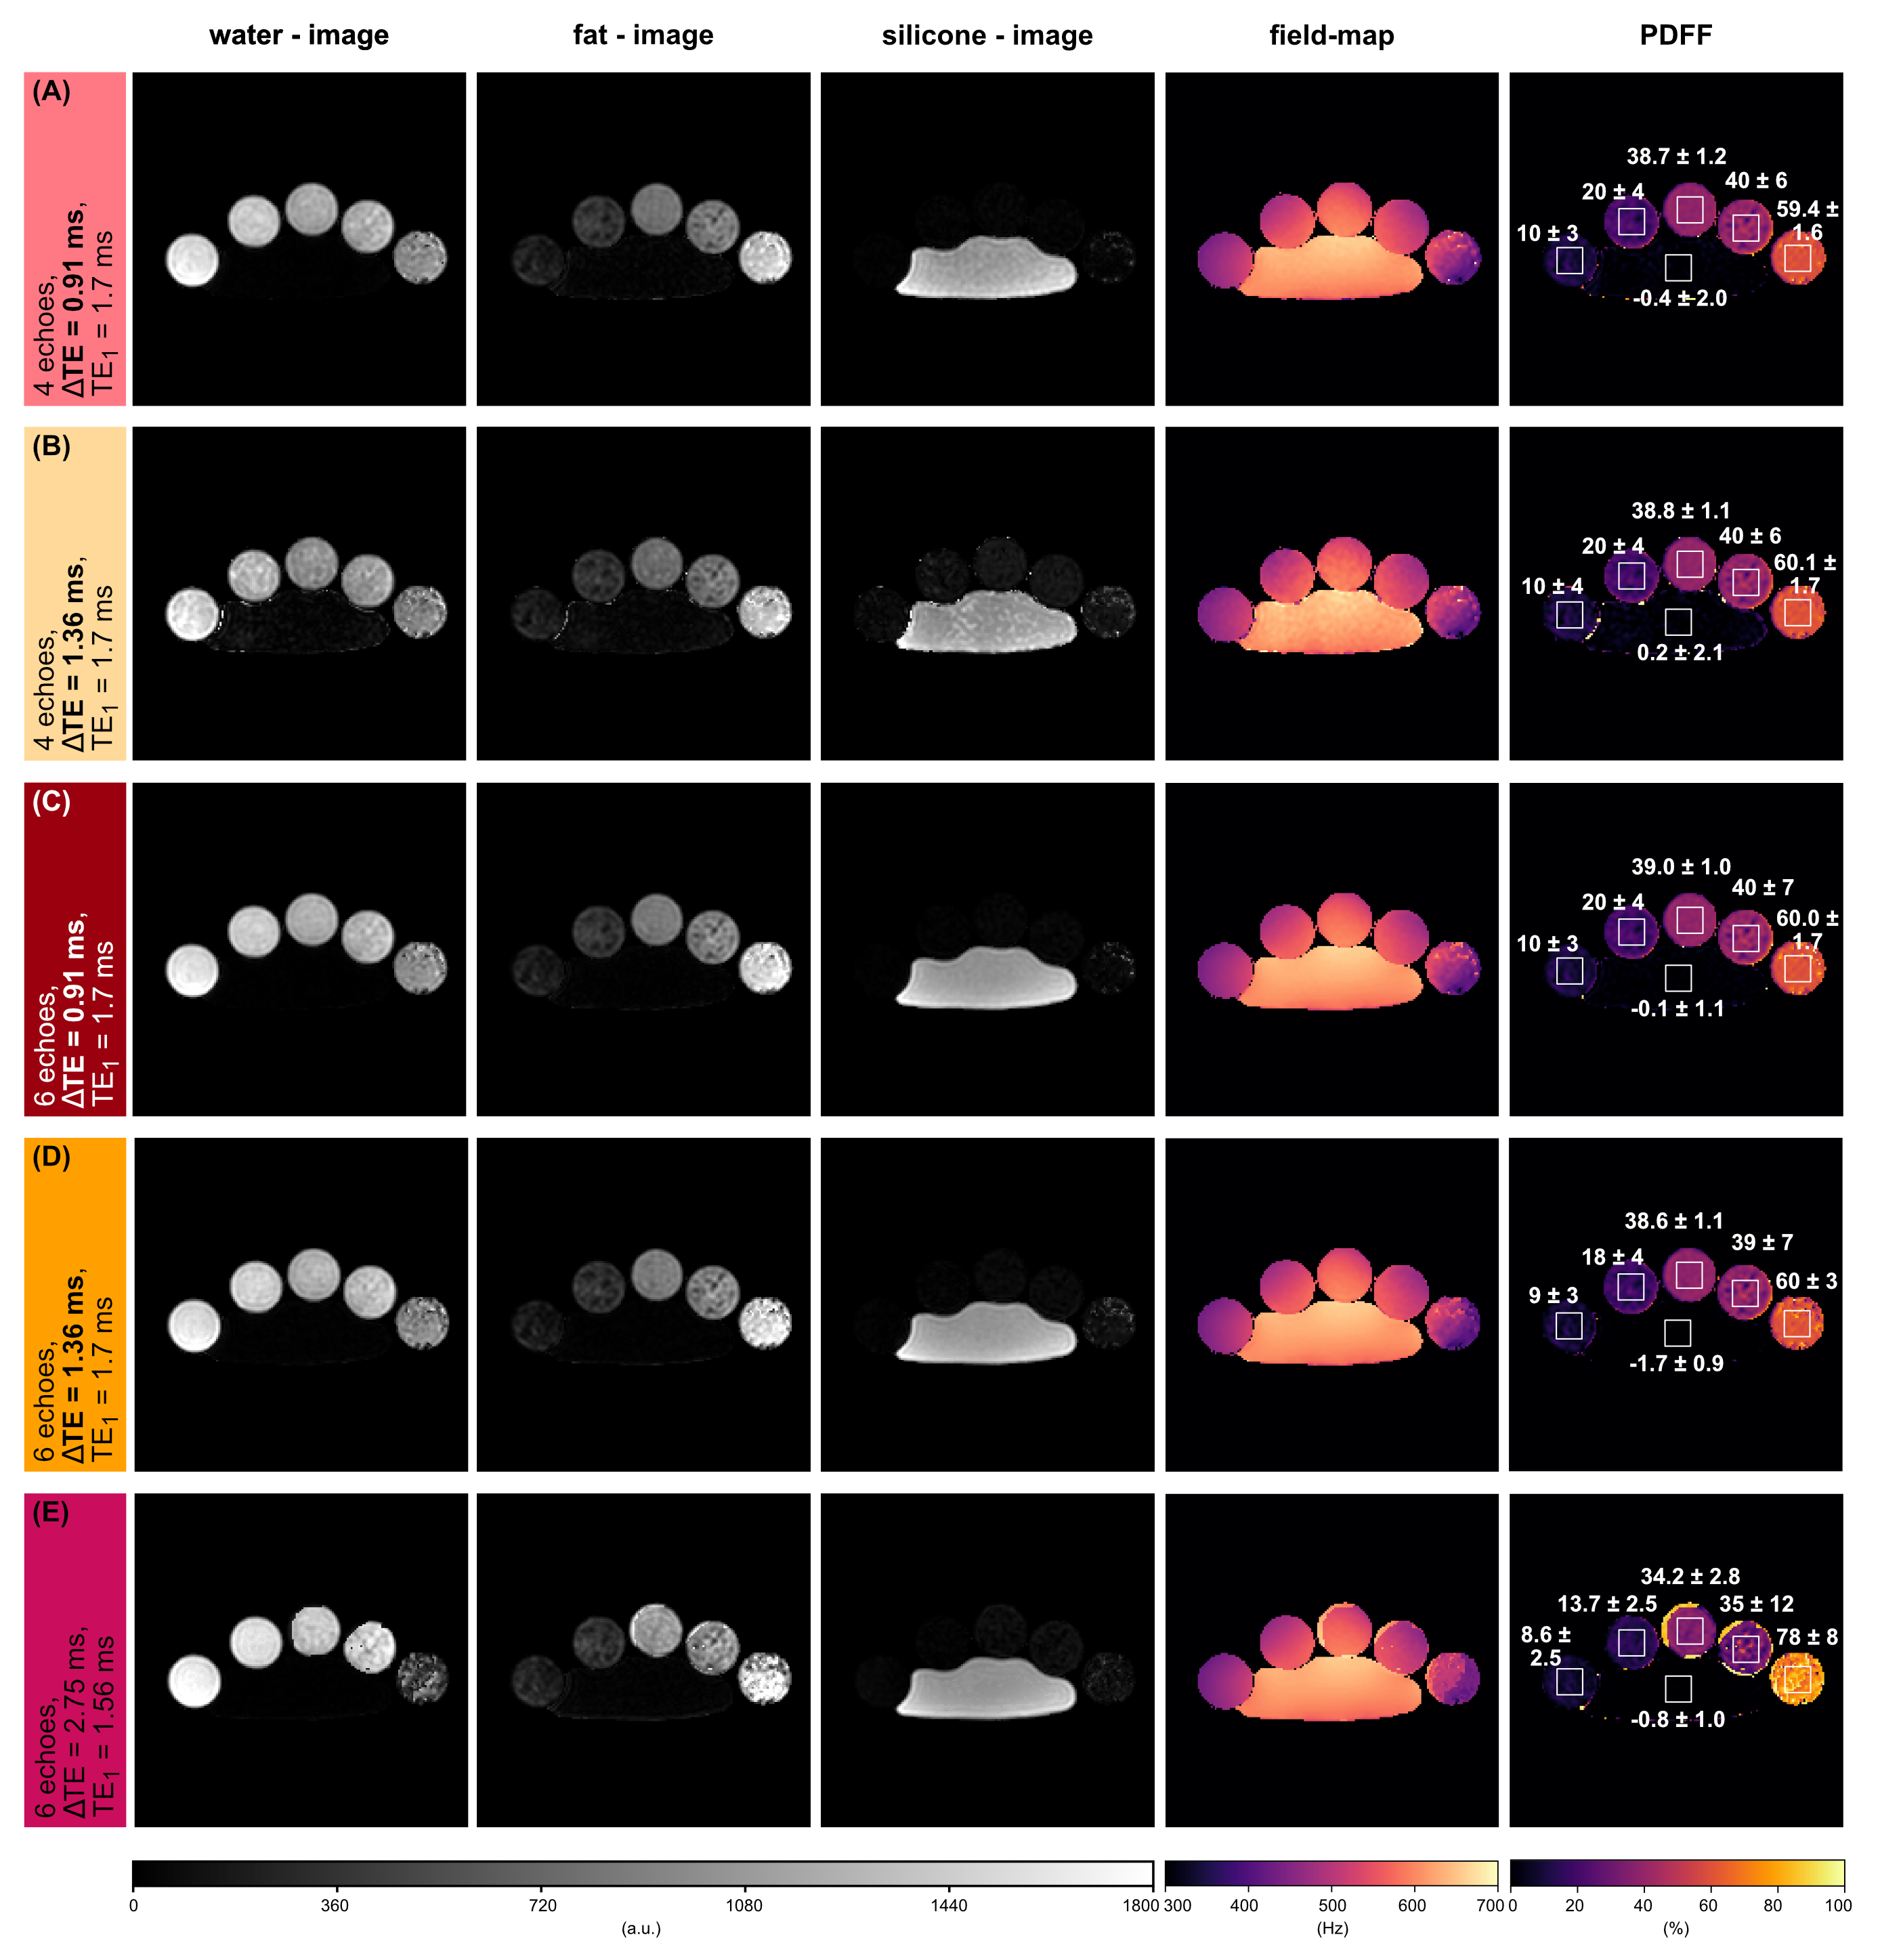
A phantom composed of vials with different water–fat-fractions ([10.0,19.5,36.3,34.9,58.2]%, verified by single-voxel spectroscopy) and a silicone implant was scanned twice with a monopolar time-interleaved multi-echo gradient echo sequence19 on a clinical 3T scanner (Ingenia/Elition X, Philips Healthcare, Best, The Netherlands) with NTE=20, ΔTE=0.45 ms, TE1=1.7 ms, FOV=179.5x179.5x140.4 mm³ and NTE=6, ΔTE=2.75 ms, TE1=1.55 ms, FOV=179.5x179.5x140.4 mm³. From the scanned images, echo times were selected matching to the phantom simulations.
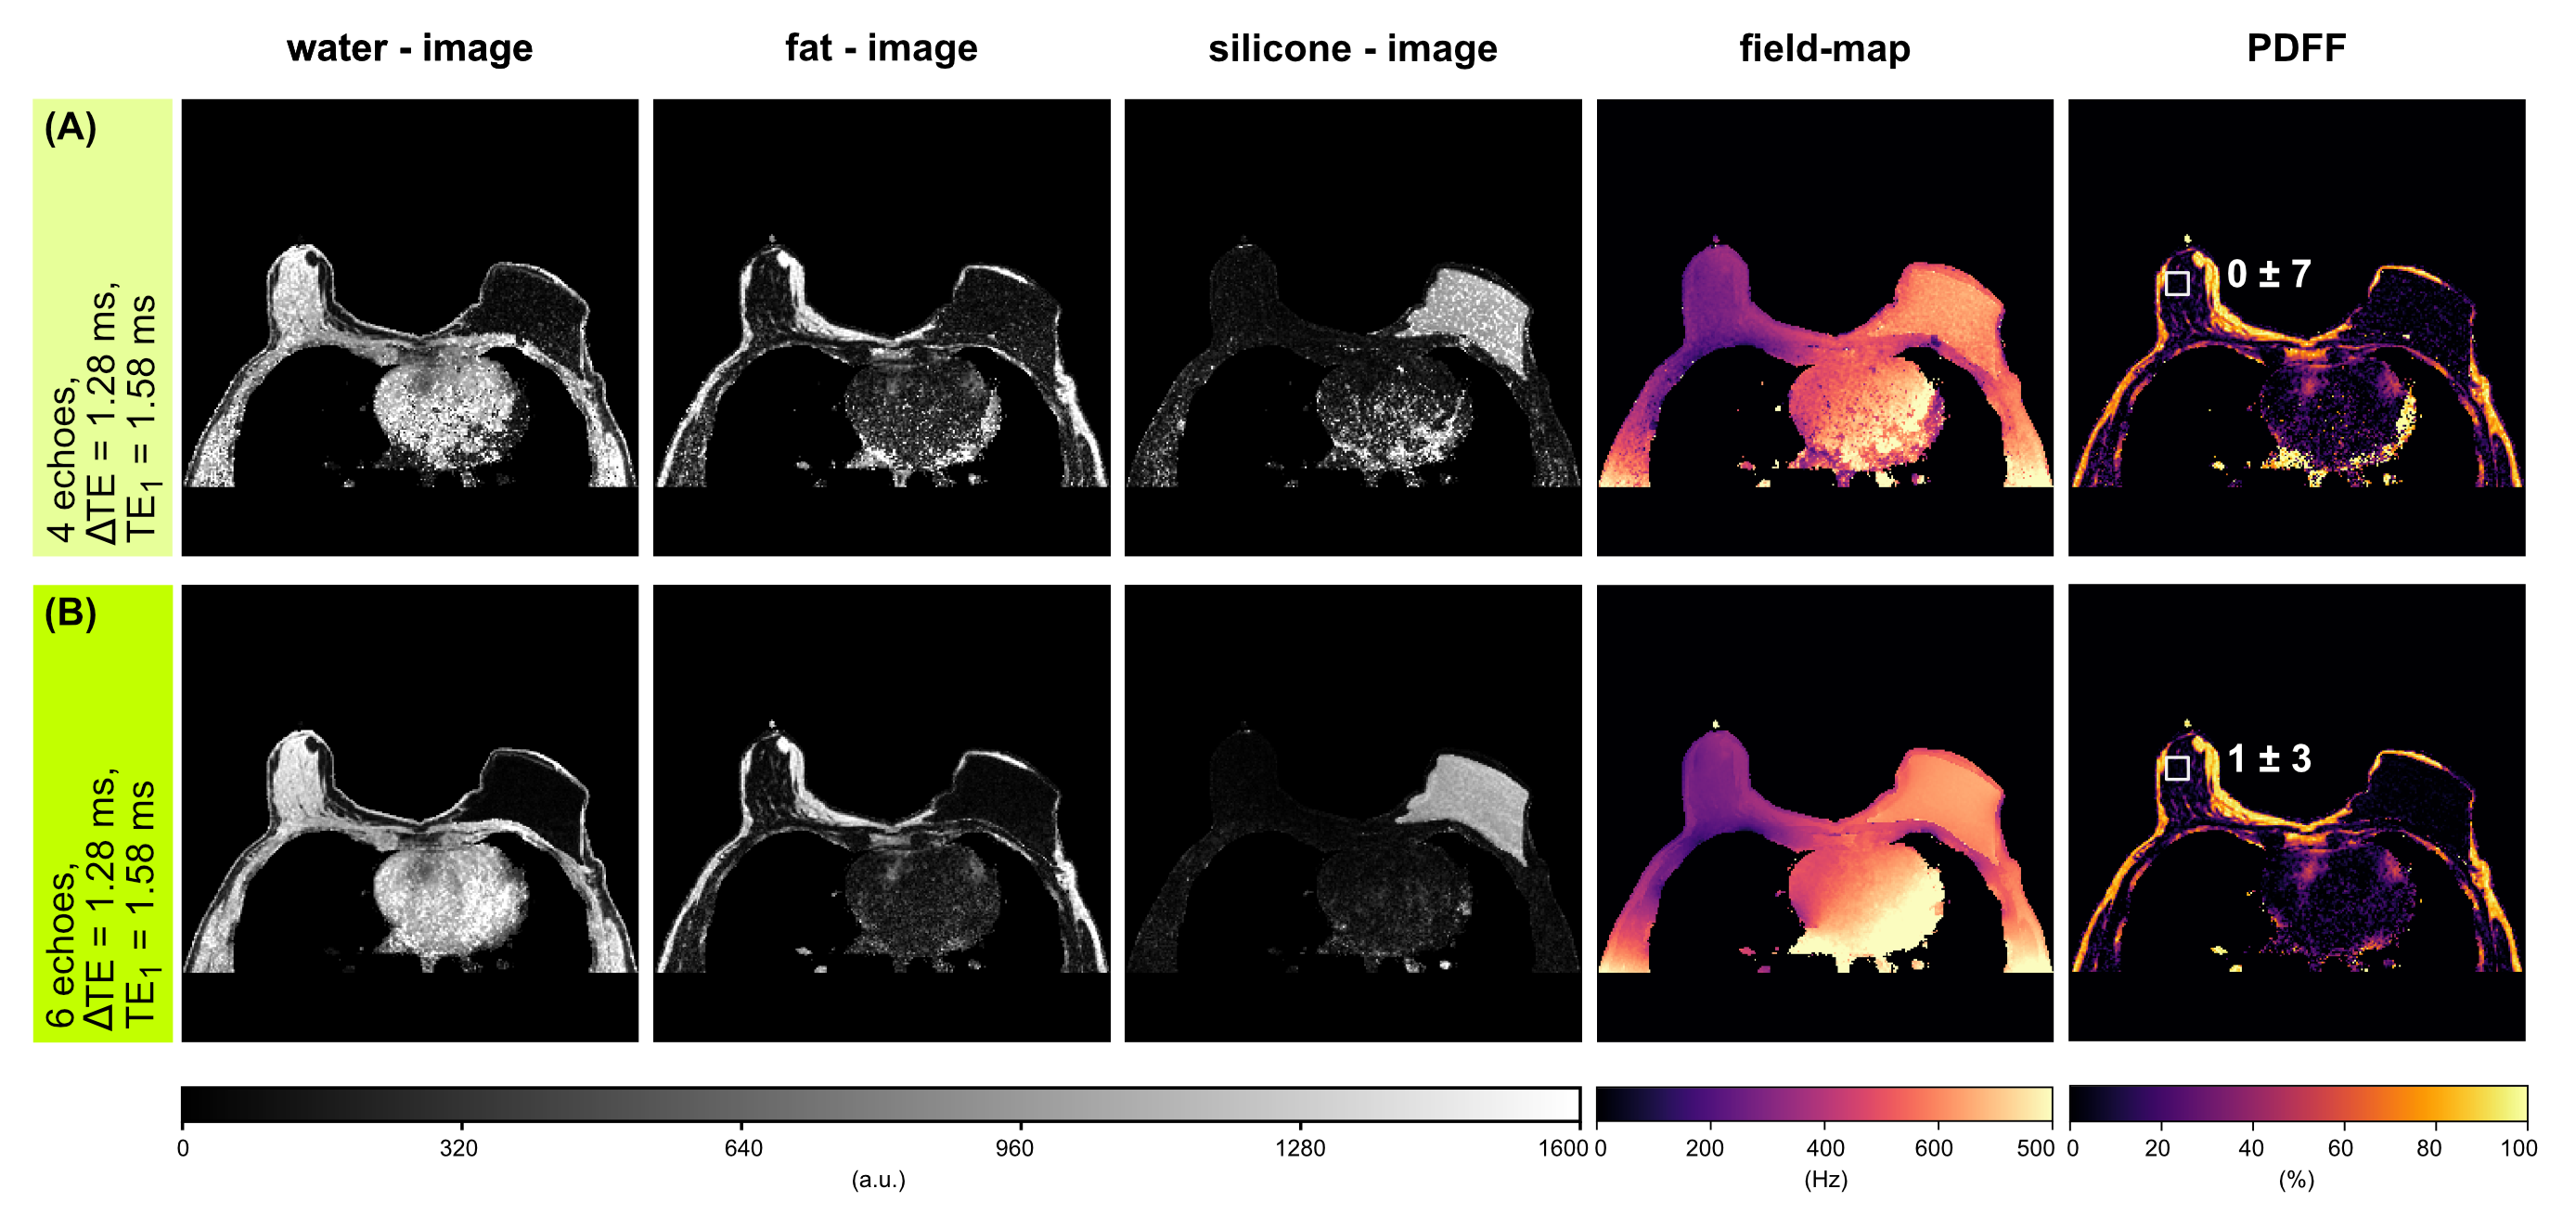
A breast scan of a subject with a silicone implant with NTE=6, ΔTE=1.28 ms, TE1=1.58 ms, FOV=384x384x192.4 mm³ using the aforementioned sequence at 3T was evaluated separately for the first 4 and all 6 echoes.
Results
For the noise performance of the three species, similar patterns were shown (Fig.1): a local maximum at ΔTE=1 ms, and local minima when the phasors of the silicone or the main fat component stay the same across TEs. In the latter case, the separated images suffered from high noise, however, the accuracy of the field-map estimate was high (Fig.3, NRMSEwater/silicone>10*NRMSEfield-map). The selection of ΔTE was more robust with 6 echoes than with 4 echoes if the echo spacing was in a similar range. In vivo results (Fig.5) demonstrated the feasibility of the method in separating all three species in a large field-of-view with 6 non-optimized echo times. Phantom PDFF maps (Fig.4) showed a good agreement to MRS PDFF values, but higher deviations from the MRS were measured for the larger echo spacing.Discussion & Conclusion
Similar phasors for the species lead to low differentiation and therefore to more noise due to broadened peaks in the residual. For large echo spacings (ΔTE=2.75 ms), the distance between minima in the residual is smaller, such that field-map jumps are more probable due to the graph-cut algorithm, although high NSA was predicted.High PDFF accuracy and low noise in the separated images were achieved for ΔTE=1 ms using 4 echoes and a stronger independence of the results on the echo spacing was observed using 6 echoes. The feasibility of the water–fat–silicone separation was also shown in vivo with non-NSA-optimized 6 echo times.
Acknowledgements
The present work was supported by the European Research Council (grant agreement No 677661, ProFatMRI). This work reflects only the authors view and the EU is not responsible for any use that may be made of the information it contains. The authors also acknowledge research support from Philips Healthcare.References
1. Brown SL, Silverman BG, Berg WA. Rupture of silicone-gel breast implants: causes, sequelae, and diagnosis. The Lancet. 1997;350(9090):1531-1537. doi:10.1016/S0140-6736(97)03164-4.
2. Mukundan S, Dixon WT, Kruse BD, Monticciolo DL, Nelson RC. MR imaging of silicone gel-filled breast implants in vivo with a method that visualizes silicone selectively. J Magn Reson Imaging. 1993;3(5):713-717. doi:10.1002/jmri.1880030505.
3. Monticciolo DL, Nelson RC, Dixon WT, Bostwick J, Mukundan S, Hester TR. MR detection of leakage from silicone breast implants: value of a silicone-selective pulse sequence. AJR Am J Roentgenol. 1994;163(1):51-56. doi:10.2214/ajr.163.1.8010247.
4. Ding J, Stopeck AT, Gao Y, et al. Reproducible automated breast density measure with no ionizing radiation using fat-water decomposition MRI. J Magn Reson Imaging. 2018;48(4):971-981. doi:10.1002/jmri.26041.
5. Dimov AV, Liu T, Spincemaille P, et al. Joint estimation of chemical shift and quantitative susceptibility mapping (chemical QSM). Magn Reson Med. 2015;73(6):2100-2110. doi:10.1002/mrm.25328.
6. Fatemi-Ardekani A, Boylan C, Noseworthy MD. Identification of breast calcification using magnetic resonance imaging. Med Phys. 2009;36(12):5429-5436. doi:10.1118/1.3250860.
7. Schweser F, Herrmann K-H, Deistung A, et al. Quantitative magnetic susceptibility mapping (QSM) in breast disease reveals additional information for MR-based characterization of carcinoma and calcification. Proc. Intl. Soc. Mag. Reson. Med. 19. 2011:1014.
8. Hernando D, Haldar JP, Sutton BP, Ma J, Kellman P, Liang Z-P. Joint estimation of water/fat images and field inhomogeneity map. Magn Reson Med. 2008;59(3):571-580. doi:10.1002/mrm.21522.
9. Pineda AR, Reeder SB, Wen Z, Pelc NJ. Cramér-Rao bounds for three-point decomposition of water and fat. Magn Reson Med. 2005;54(3):625-635. doi:10.1002/mrm.20623.
10. Yu H, Shimakawa A, McKenzie CA, Brodsky E, Brittain JH, Reeder SB. Multiecho water-fat separation and simultaneous R2* estimation with multifrequency fat spectrum modeling. Magn Reson Med. 2008;60(5):1122-1134. doi:10.1002/mrm.21737.
11. Madhuranthakam AJ, Smith MP, Yu H, et al. Water-silicone separated volumetric MR acquisition for rapid assessment of breast implants. J Magn Reson Imaging. 2012;35(5):1216-1221. doi:10.1002/jmri.22872.
12. Hernando D, Sharma SD, Kramer H, Reeder SB. On the confounding effect of temperature on chemical shift-encoded fat quantification. Magn Reson Med. 2014;72(2):464-470. doi:10.1002/mrm.24951.
13. Boehm C, Diefenbach MN, Makowski MR, Karampinos DC. Improved body quantitative susceptibility mapping by using a variable-layer single-min-cut graph-cut for field-mapping. Magn Reson Med. 2021;85(3):1697-1712. doi:10.1002/mrm.28515.
14. Hernando D, Kellman P, Haldar JP, Liang ZP. Estimation of water/fat images, B0 field map and T2* map using VARPRO. Proc. Intl. Soc. Mag. Reson. Med. 16. 2008:1517.
15. Reeder SB, Hu HH, Sirlin CB. Proton density fat-fraction: a standardized MR-based biomarker of tissue fat concentration. J Magn Reson Imaging. 2012;36(5):1011-1014. doi:10.1002/jmri.23741.
16. Liu C-Y, McKenzie CA, Yu H, Brittain JH, Reeder SB. Fat quantification with IDEAL gradient echo imaging: correction of bias from T(1) and noise. Magn Reson Med. 2007;58(2):354-364. doi:10.1002/mrm.21301.
17. Diefenbach MN, Liu C, Karampinos DC. Generalized parameter estimation in multi-echo gradient-echo-based chemical species separation. Quant Imaging Med Surg. 2020;10(3):554-567. doi:10.21037/qims.2020.02.07.
18. Gudbjartsson H, Patz S. The Rician distribution of noisy MRI data. Magn Reson Med. 1995;34(6):910-914. doi:10.1002/mrm.1910340618.
19. Ruschke S, Eggers H, Kooijman H, et al. Correction of phase errors in quantitative water-fat imaging using a monopolar time-interleaved multi-echo gradient echo sequence. Magn Reson Med. 2017;78(3):984-996. doi:10.1002/mrm.26485.
Figures