3847
Deep Learning-Based Liver Fat and R2* Mapping with Uncertainty Estimation using Self-Gated Free-Breathing Stack-of-Radial MRI1Radiological Sciences, University of California, Los Angeles, Los Angeles, CA, United States, 2Bioengineering, University of California, Los Angeles, Los Angeles, CA, United States, 3Siemens Medical Solutions USA, Inc., Los Angeles, CA, United States, 4Pediatrics, University of California, Los Angeles, Los Angeles, CA, United States
Synopsis
Self-gated free-breathing multi-echo stack-of-radial MRI quantifies liver fat and R2*. However, data undersampling due to motion self-gating can degrade the image quality and quantification accuracy. Previous methods required either longer scan time or computationally expensive constrained reconstruction. In this work, a deep learning-based two-stage network was developed to suppress undersampling artifacts and rapidly generate quantitative fat and R2* maps with a pixel-wise uncertainty map. The proposed method achieved accurate fat and R2* mapping and reduced the computational time by two orders of magnitude versus constrained reconstruction. The uncertainty map can be used to detect regions with potential quantification errors.
Introduction
Liver fat and R2* quantification is important for diagnosis of fatty liver disease1,2 and liver iron overload3. Self-gated free-breathing multi-echo stack-of-radial MRI techniques4,5 accurately quantify fat and R2* without breath-holding. To suppress undersampling artifacts due to self-gating, acquiring more radial spokes4 or using constrained reconstruction (CR)5 were investigated, but led to 2-fold longer scan time4 or over 1.5-hour reconstruction time5. Compared with CR methods, deep learning (DL) provides an alternative for rapid reconstruction6-8. There are DL methods for radial MRI7, but not yet for multi-echo quantitative imaging.DL has also been applied in fat and/or R2* mapping9-11 to replace the computationally expensive graph-cut (GC)12,13 algorithms for signal fitting. Previous work investigated only Cartesian sequences and did not characterize confidence levels for quantitative accuracy. However, quantification errors from DL may impact clinical decisions using quantitative MRI. Recent DL developments using built-in uncertainty estimation14 could address this gap.
In this work, we propose a DL-based two-stage network that reconstructs accurate quantitative liver fat and R2* maps with uncertainty estimation. Our network reduces the computational time for fat/R2* mapping to <100ms/slice.
Methods
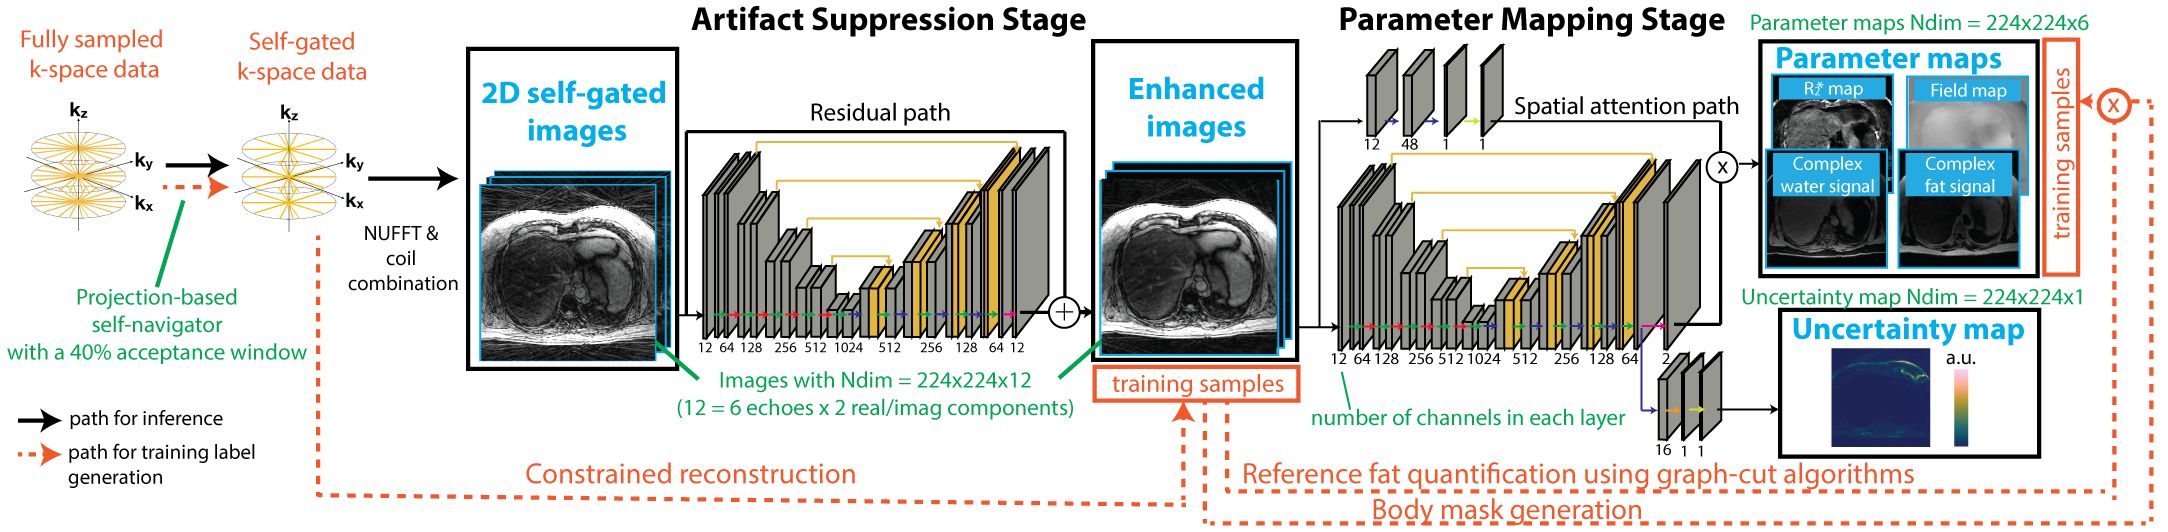
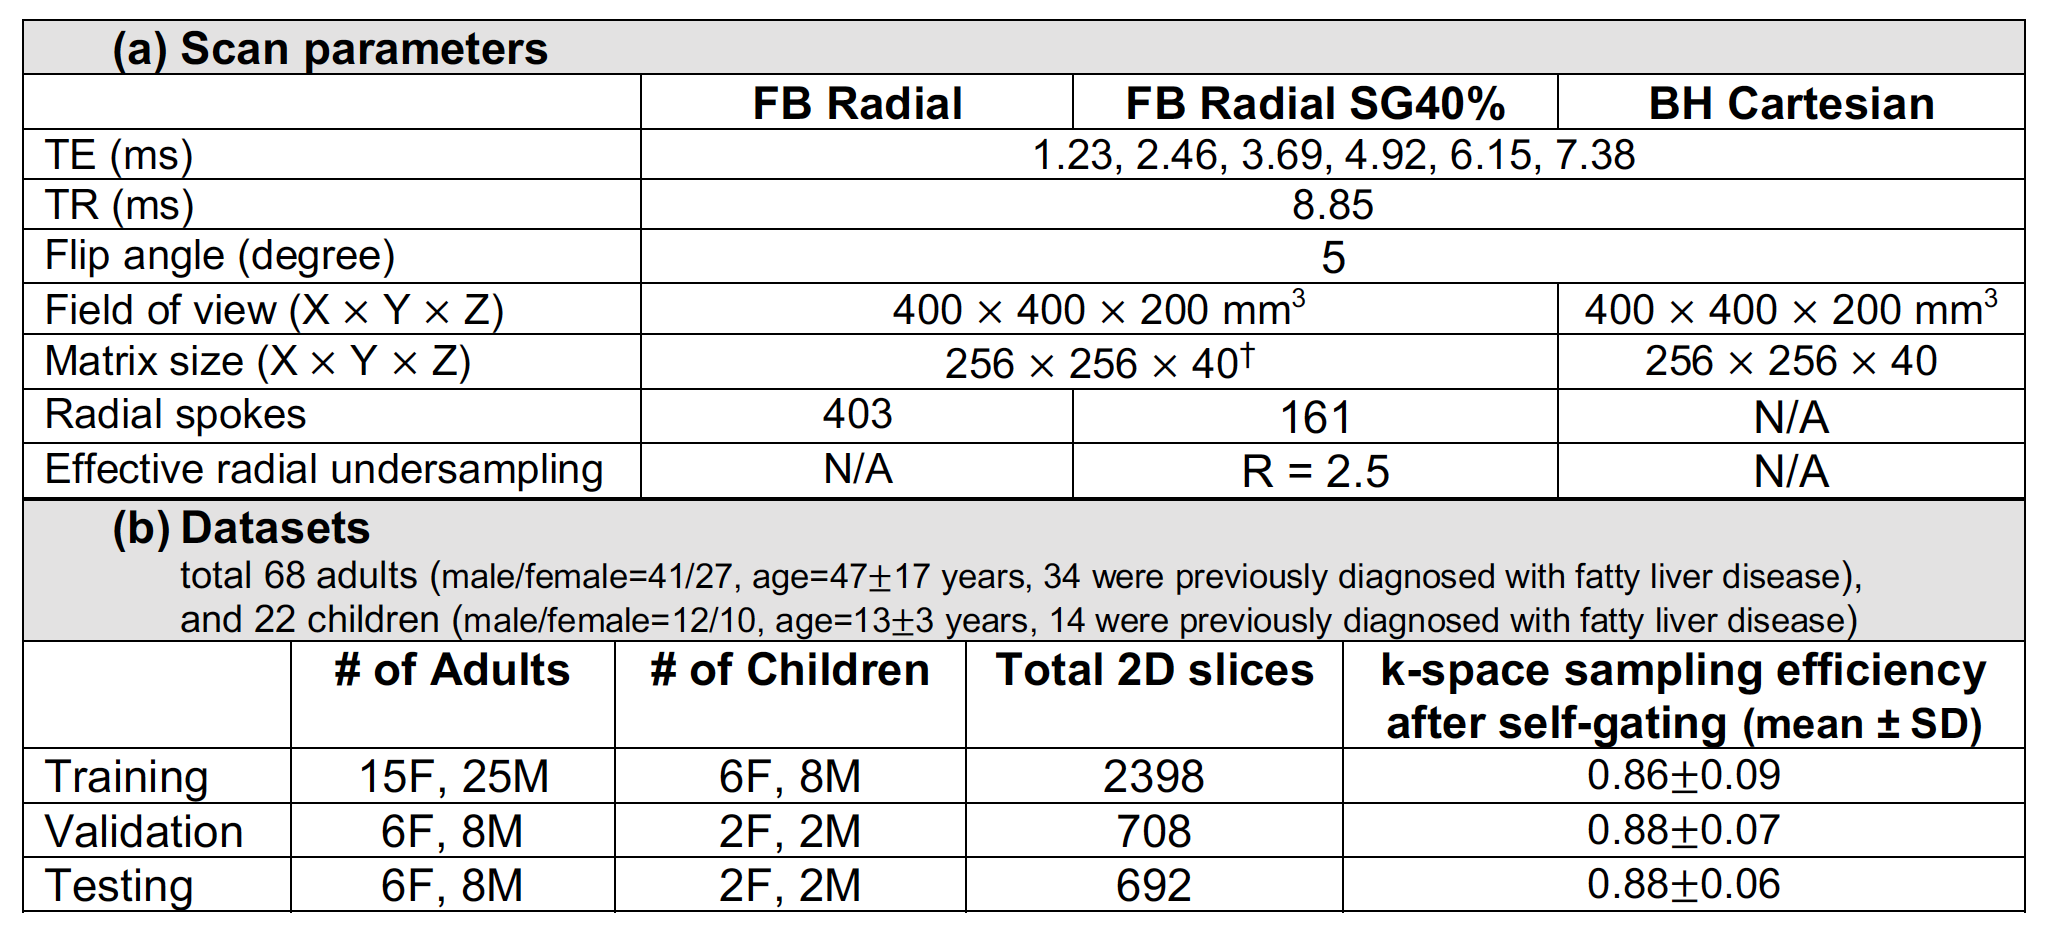
We designed a two-stage network with an artifact suppression stage (residual U-Net) followed by a parameter mapping stage (U-Net with modified layers) to generate quantitative maps and an uncertainty map (Figure 1). Multi-echo 2D images (real/imaginary parts) were stacked along the channel dimension for the network input. We pre-trained the first stage using mean-squared error (MSE) loss, and pre-trained the second stage using the loss function $$$L_{u}=MSE(y,\hat{y})/2\sigma^{2}+1/2\cdot log\sigma^{2}$$$, where $$$y$$$ and $$$\hat{y}$$$ denote the network output and the reference parameter maps, $$$\sigma^{2}$$$ denotes the uncertainty map. The network can increase $$$\sigma^{2}$$$, especially in areas difficult for MSE loss minimization, to reduce the overall loss, thus capturing uncertainty14. For end-to-end training, the loss function $$$L_{f}=MSE(p,\hat{p})/2\sigma^{2}+1/2\cdot log\sigma^{2}$$$ was used, with $$$p$$$ denoting the concatenated tensor of image and parameter map outputs. Therefore, the uncertainty estimation considers both artifact suppression and parameter quantification.In an IRB-approved study, we scanned 68 adults and 22 children at 3T (MAGNETOM Skyra or Prisma, Siemens Healthcare, Erlangen, Germany) using a prototype free-breathing multi-echo stack-of-radial (FB Radial) sequence4,15 and a standard breath-holding Cartesian (BH Cartesian) sequence16. Sequence and subject information are listed in Table 1. BH Cartesian data were reconstructed on the scanner. Self-gated free-breathing images (SG40%) were reconstructed using projection-based self-navigators with a 40% acceptance window. Due to the lack of motion-resolved fully-sampled FB Radial references, we used CR with high-order singular-value decomposition as the sparsifying transform17 to generate training samples (SG40%+CR). We generated reference proton-density fat fraction (PDFF) and R2* maps from SG40%+CR using GC and a 7-peak fat model with single effective R2* per voxel18. DL network hyperparameters were chosen as batch size=16, initial learning rate=0.005 (stochastic gradient descent optimizer), and number of epochs=300.
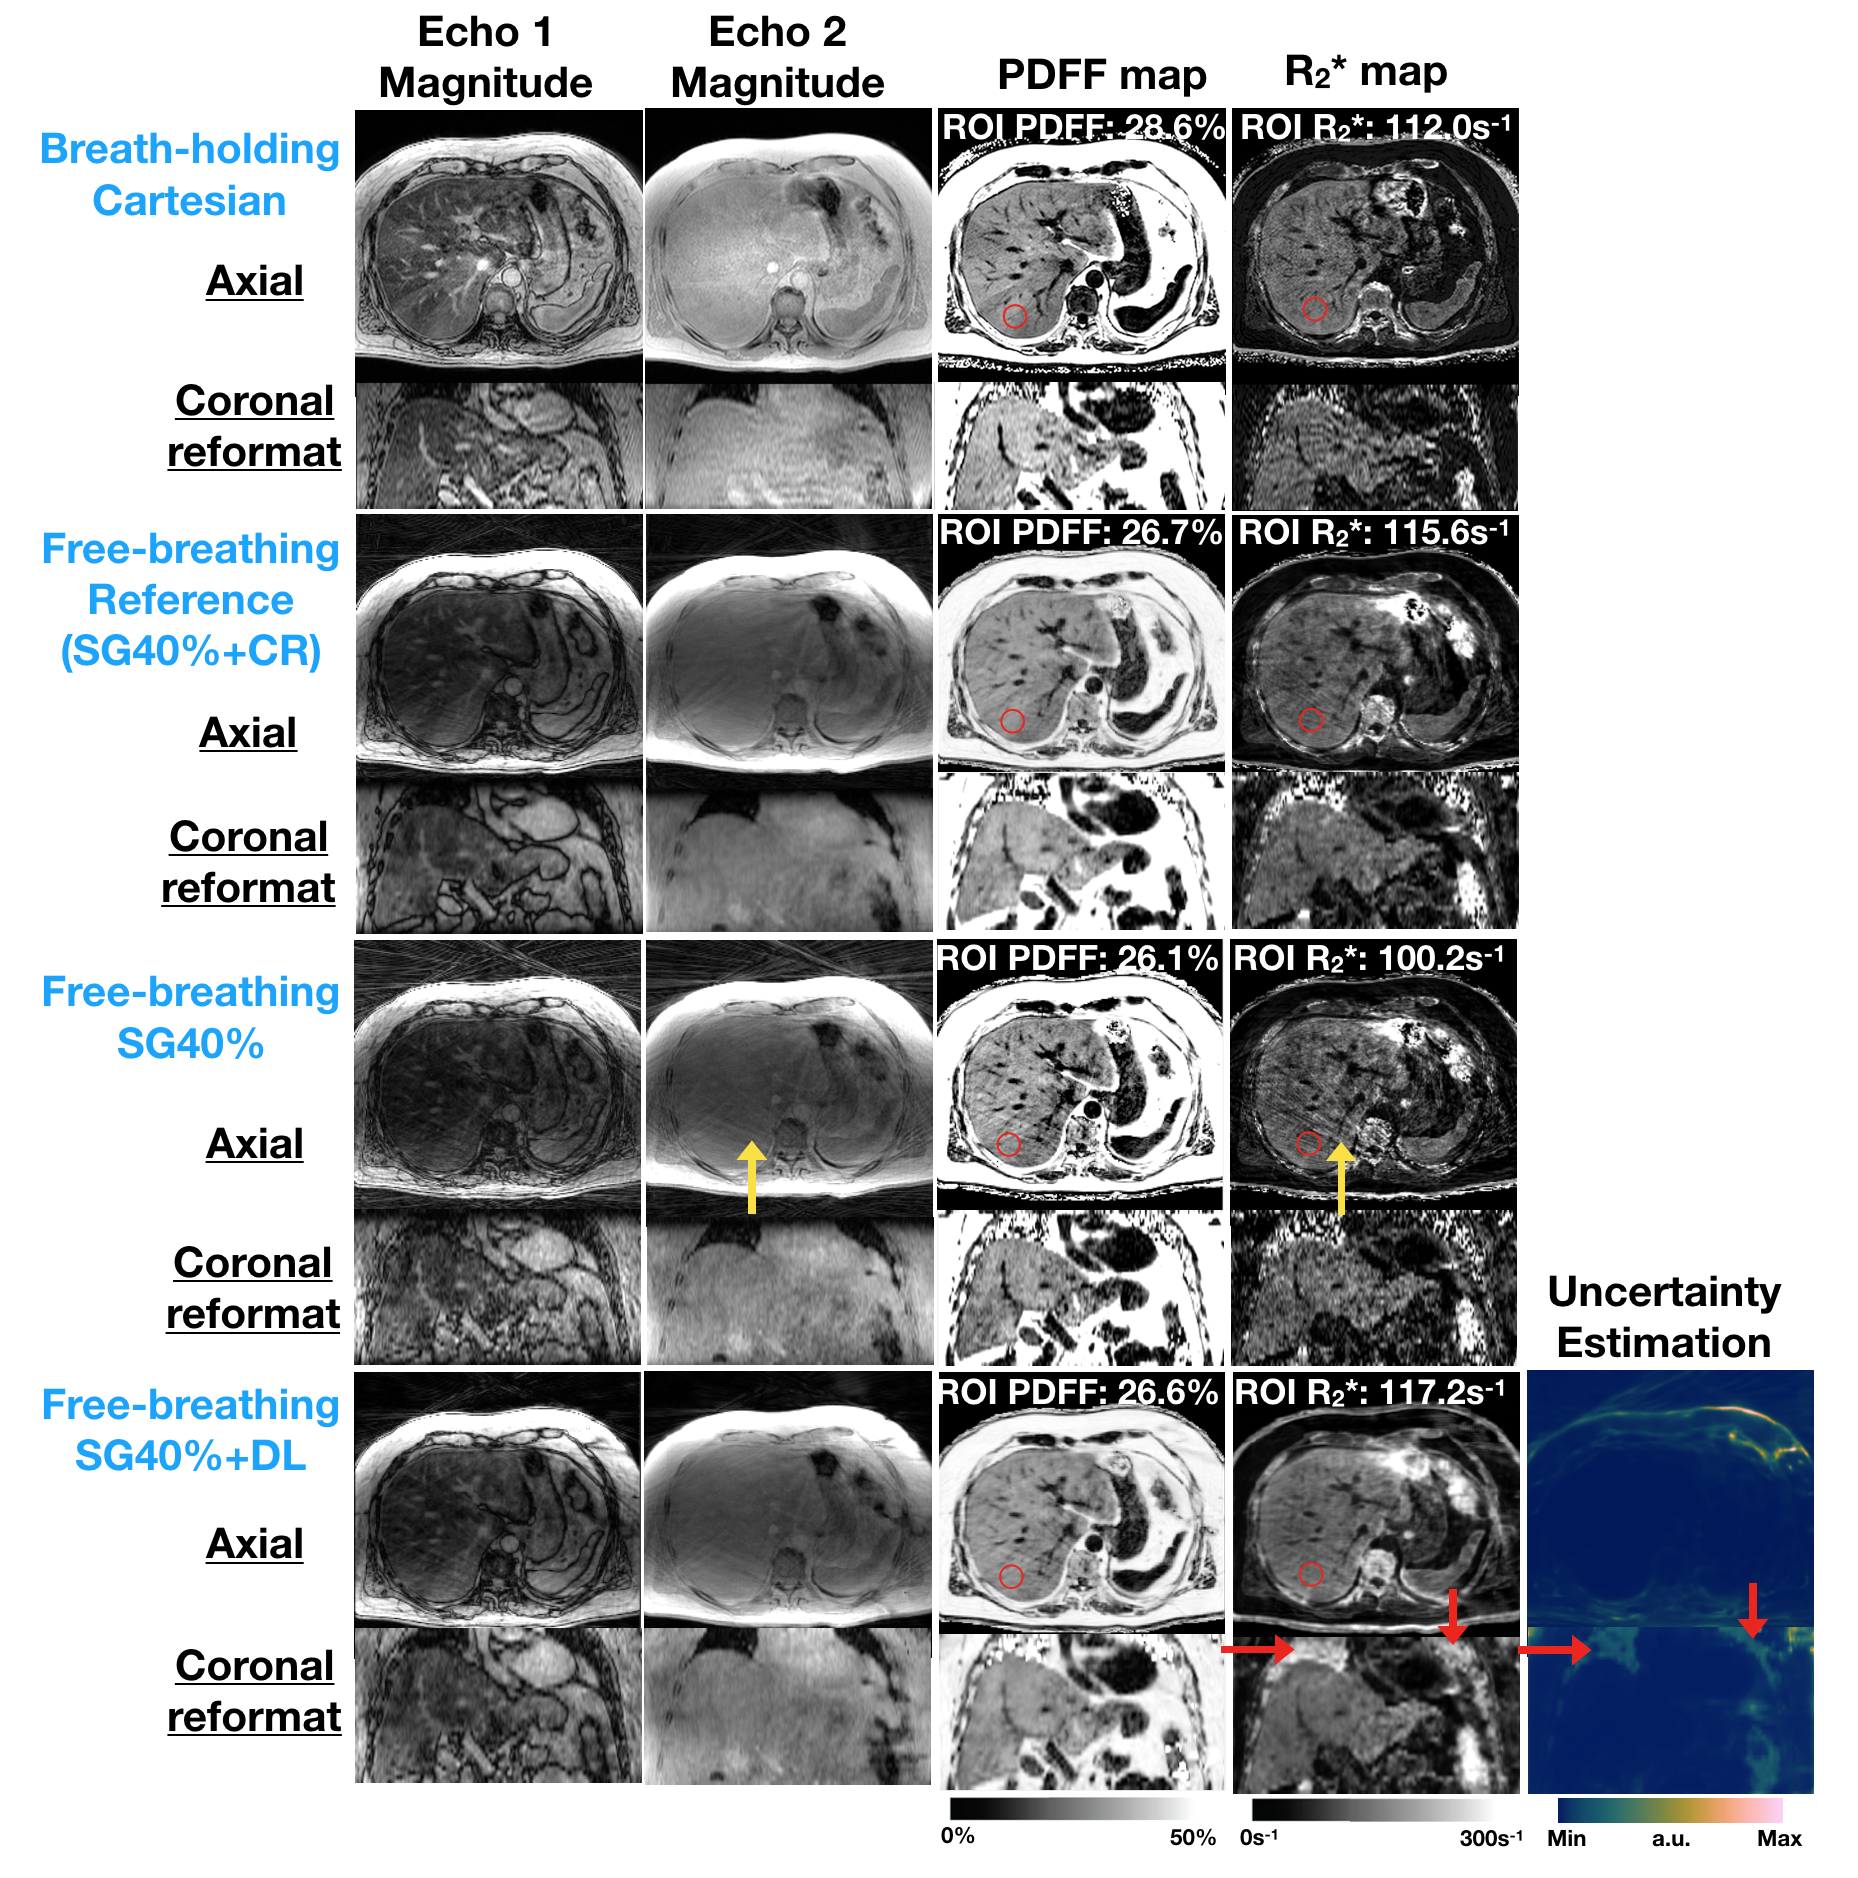
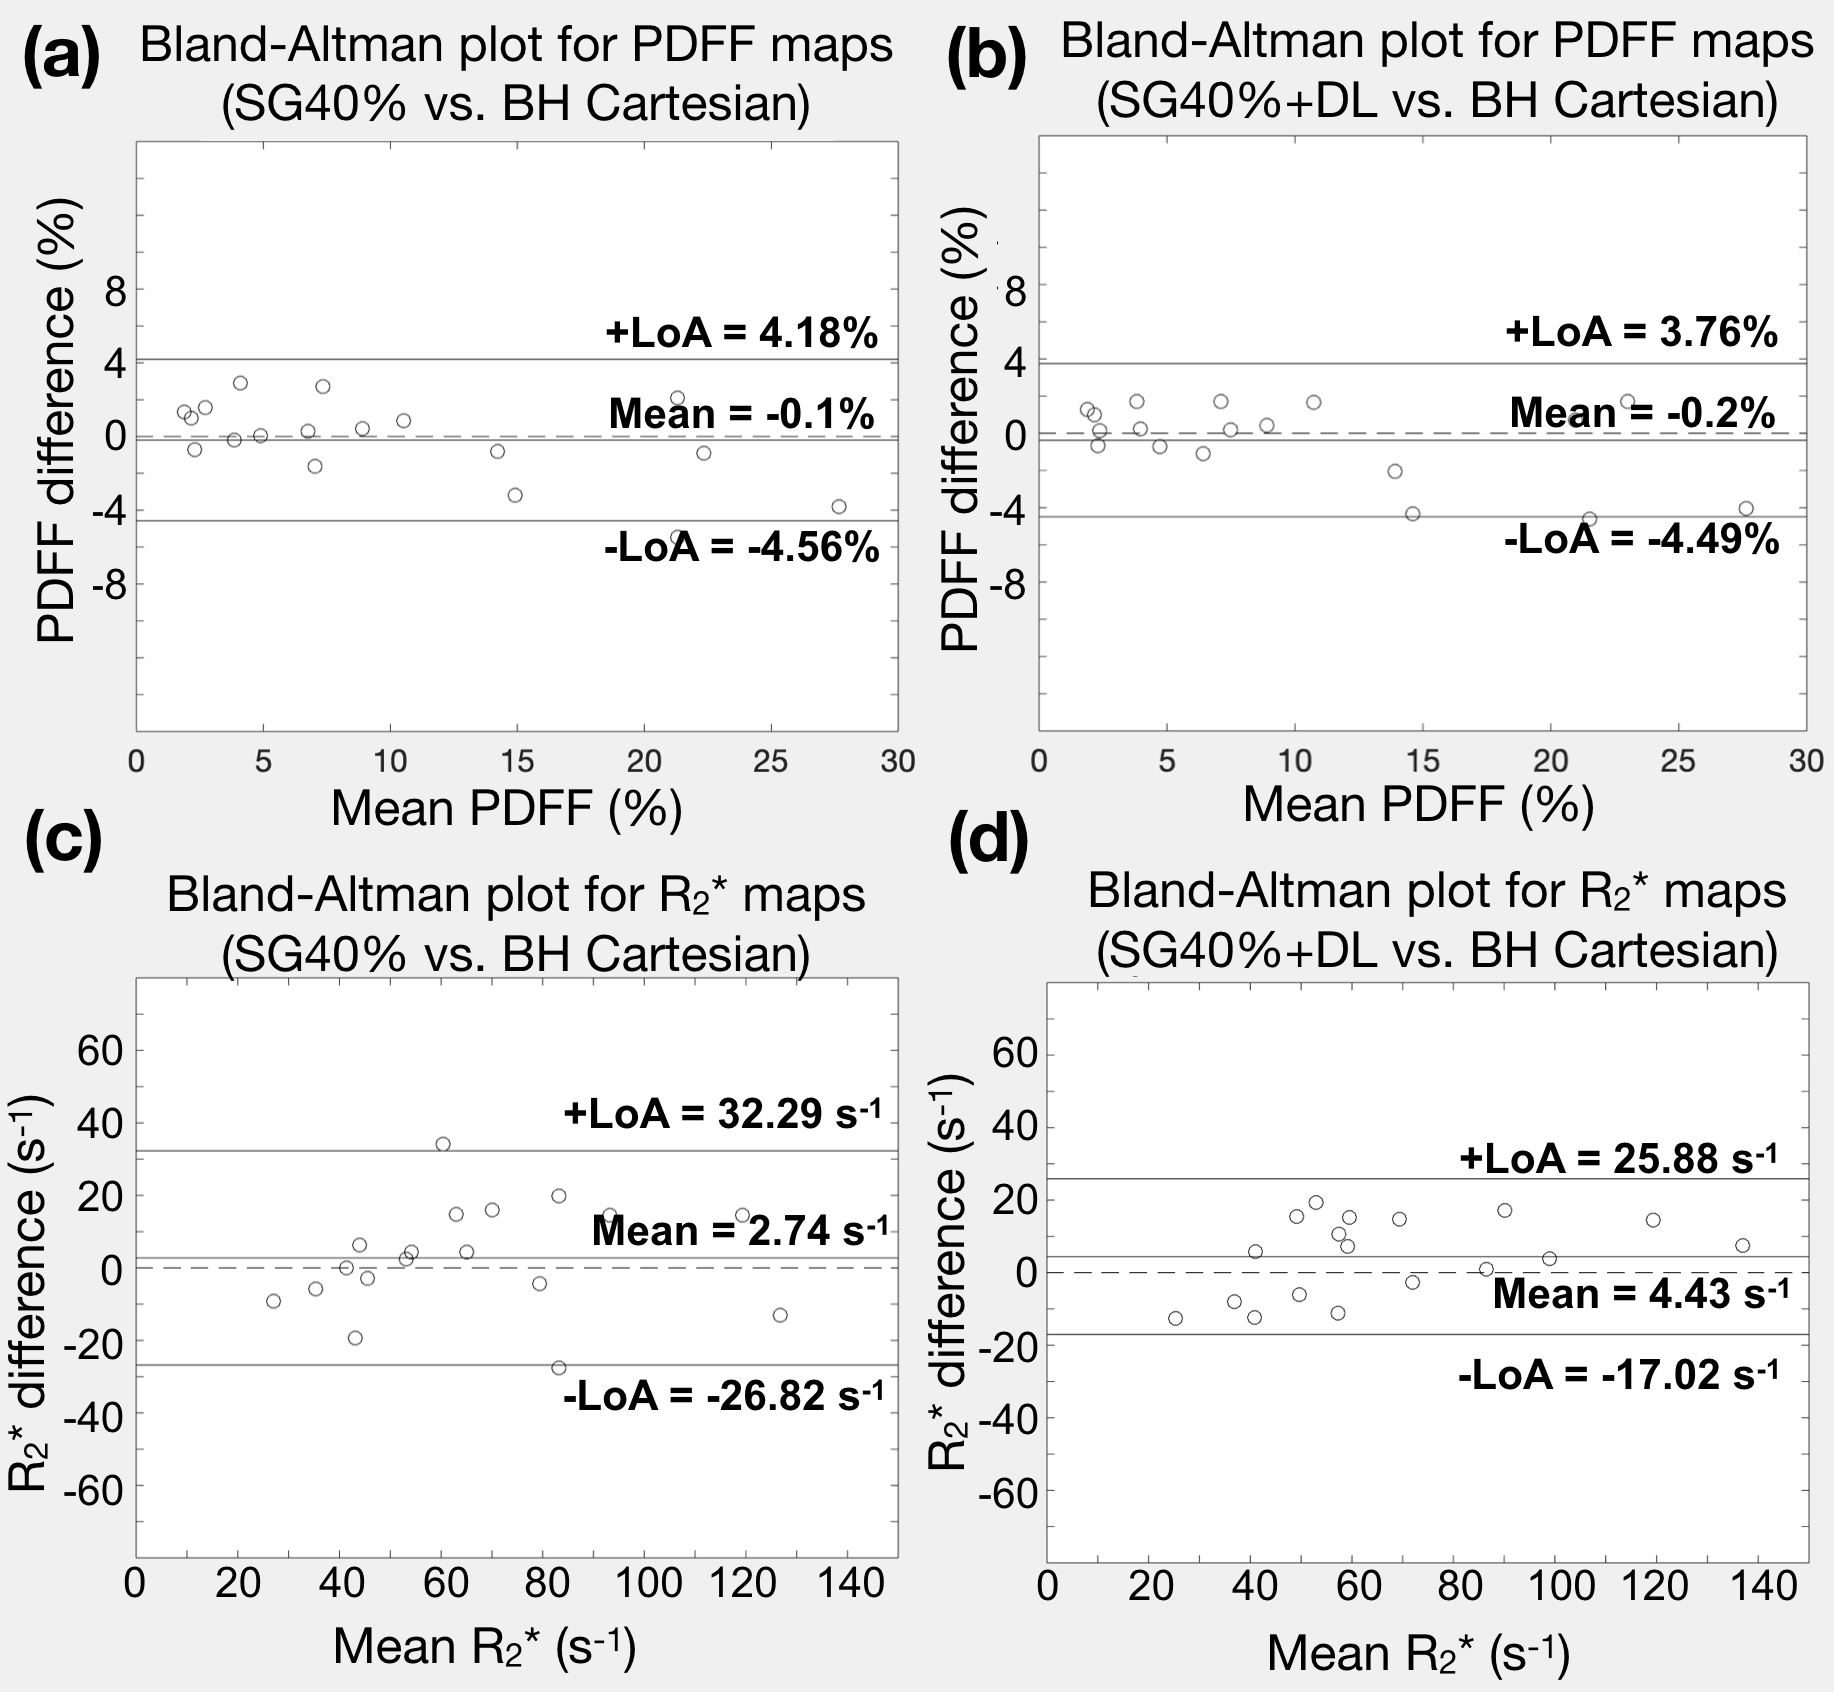
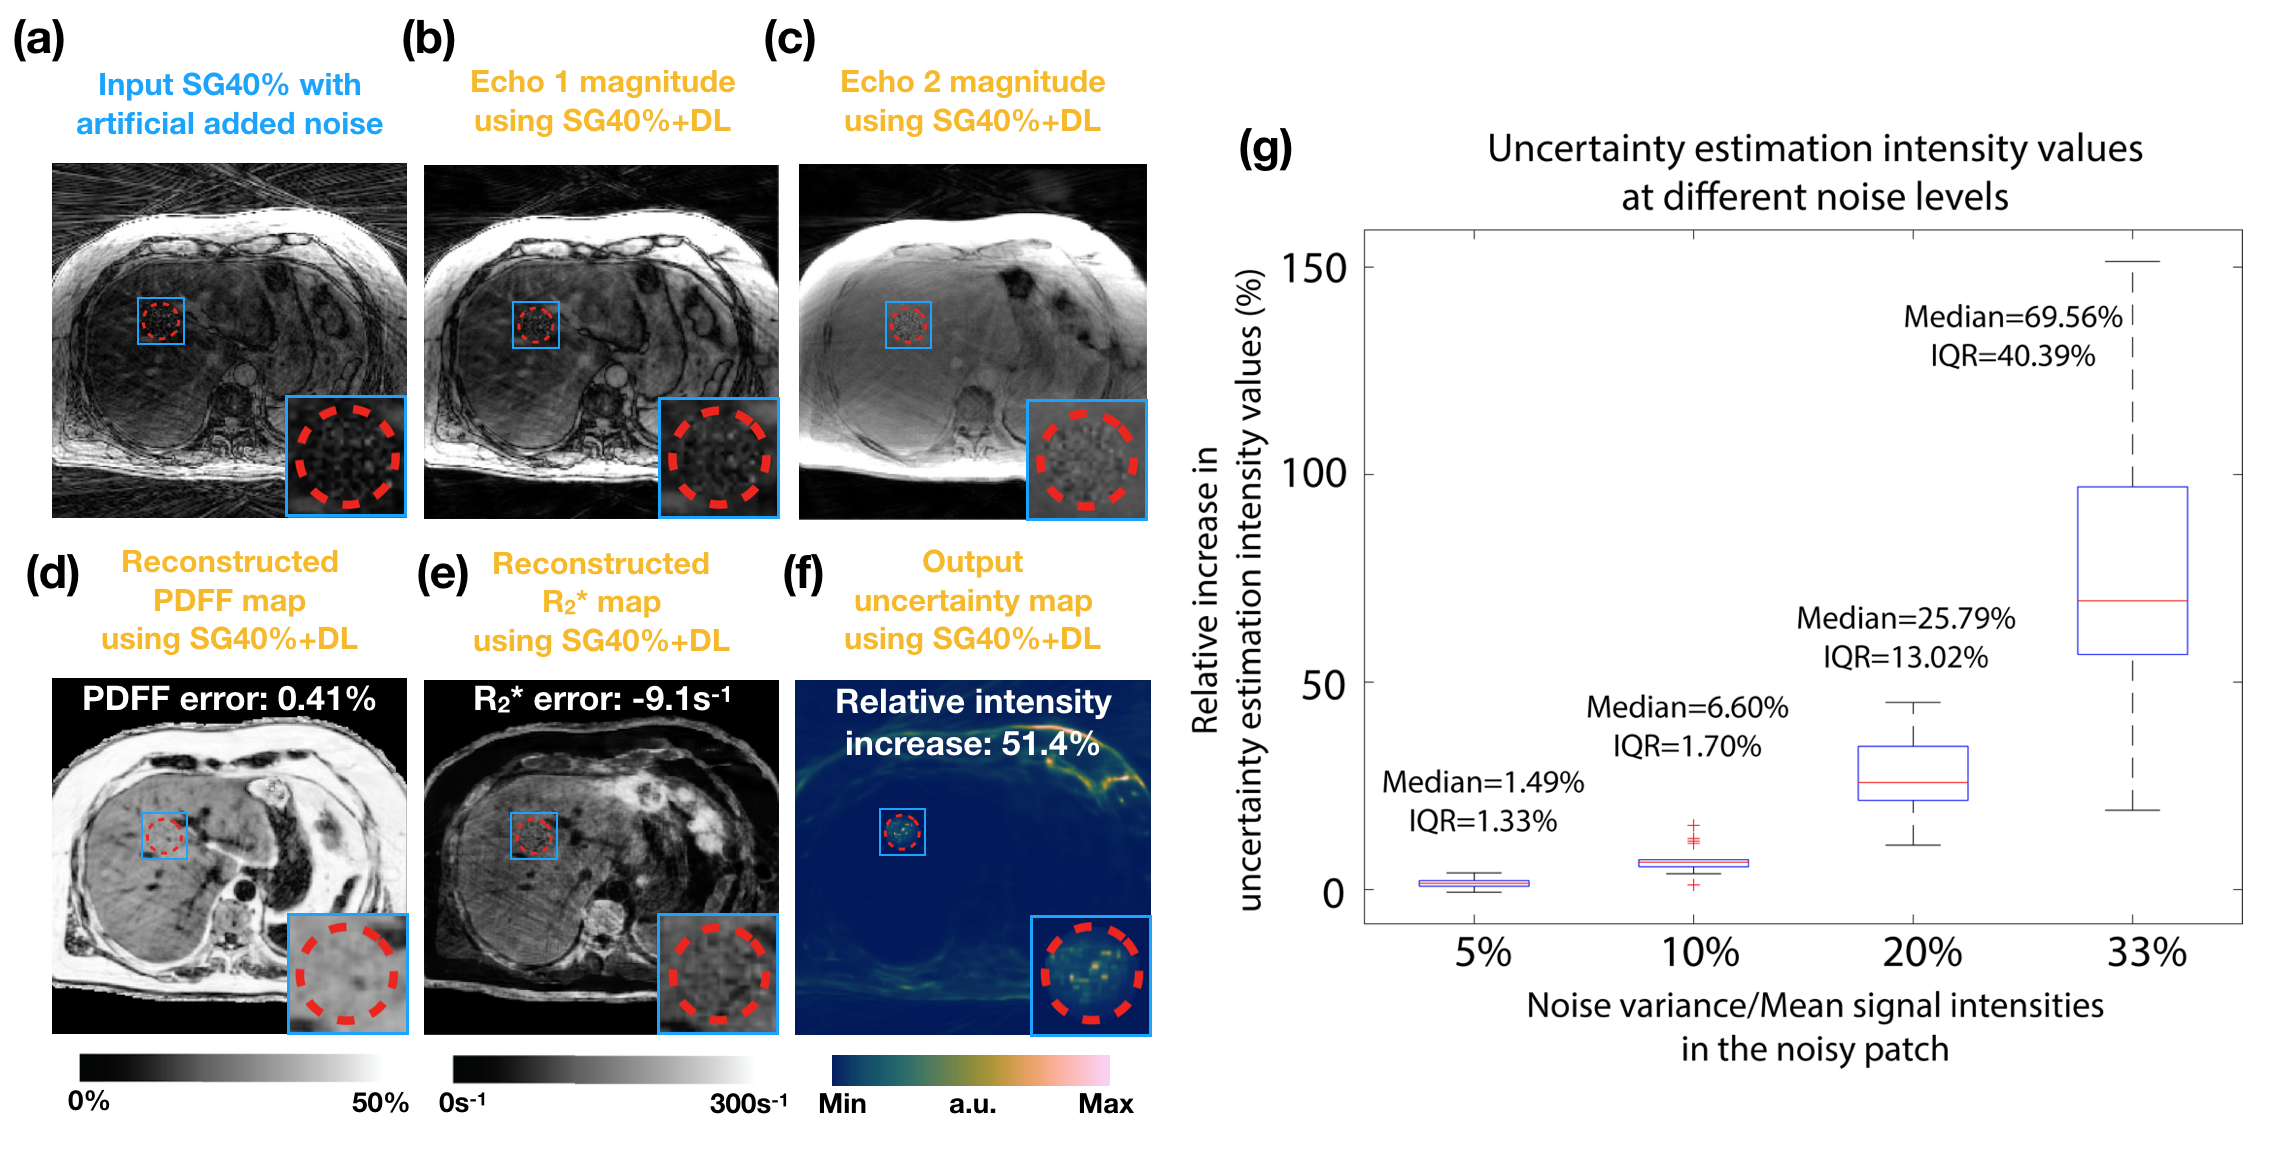
We evaluated our DL network in the testing datasets. (1) Quantification accuracy: We placed 5-mm2 regions of interest (ROIs) on a mid-liver slice to measure PDFF and R2*. We used Bland-Altman analysis to calculate the mean difference and 95% limits of agreement (LoA) of SG40% and SG40%+DL, compared to BH Cartesian. (2) Uncertainty estimation: We added noise on the input images and analyzed the signal intensities on the uncertainty maps. Four different levels of zero-mean white additive Gaussian noise were added, with noise variance/mean signal intensity = 5%, 10%, 20%, 33%.
Results
Figure 2 shows that SG40%+DL suppressed undersampling artifacts (yellow arrows) and the uncertainty map detected unreliable regions due to low signal-to-noise (SNR) in the inputs (red arrows). Figure 3 shows that SG40%+DL had improved R2* agreement with BH Cartesian, as evidenced by the tighter LoA (42.9s-1) compared to SG40% (59.11s-1). Figure 4 shows that the uncertainty map characterized the unreliable quantification at noisy locations, and had relative intensities that increased with increasing input noise levels.CR and GC took 1.5 minute/slice and 28 sec/slice on an Intel Xeon E5-2660 CPU. DL network training and inference required 20 hours and 71 msec/slice on an NVIDIA v100 GPU.
Discussion
The proposed DL two-stage network suppressed artifacts from effectively 2.5-fold radial undersampling due to self-gating, and improved quantification accuracy compared with SG40%+GC. CR results were used as the training labels in this work. Alternatively, datasets with oversampling could be acquired to improve training. Self-gating may result in variable k-space sampling patterns. Our training/testing datasets had similar ranges of k-space sampling efficiency and our network achieved consistent performance in the testing dataset. We found SG40%+DL had more improvement in R2* than PDFF accuracy, similar to previous findings that R2* fitting was more sensitive to motion-induced errors4.Our proposed uncertainty estimation provided relative values and only considered data uncertainty. Directly predicting quantification errors would further improve its applicability. Uncertainty from the network itself and distribution mismatch between datasets will be investigated in the future. Though specific computational time depends on hardware and software implementation, SG40%+DL achieved 2 orders of magnitude time reduction compared with CR and GC methods.
Conclusion
We developed a DL two-stage framework that accurately quantifies liver PDFF and R2* using free-breathing self-gated radial MRI, with a rapid <100ms/slice computational time. The built-in uncertainty estimation can also identify regions with potential errors in PDFF and R2* quantification.Acknowledgements
This project was supported by the UCLA Radiological Sciences Exploratory Research Program and the National Institute of Diabetes and Digestive and Kidney Diseases (R01DK124417).References
1. Vernon G, Baranova A, Younossi ZM. Systematic review: the epidemiology and natural history of non-alcoholic fatty liver disease and non-alcoholic steatohepatitis in adults. Aliment Pharmacol Ther. 2011;34:274-285.
2. Rinella ME, Nonalcoholic fatty liver disease: a systematic review. JAMA. 2015;313:2263-2273.
3. Hankins JS, McCarville MB, Loeffler RB, et al. R2* magnetic resonance imaging of the liver in patients with iron overload. Blood. 2009;113:4853‐4855.
4. Zhong X, Armstrong T, Nickel MD, et al. Effect of respiratory motion on free-breathing 3D stack-of-radial liver R2* relaxometry and improved quantification accuracy using self-gating. Magn Reson Med. 2020;83:1964-1978.
5. Schneider M, Benkert T, Solomon E, et al. Free‐breathing fat and R2* quantification in the liver using a stack‐of‐stars multi‐echo acquisition with respiratory‐resolved model‐based reconstruction. Magn Reson Med. 2020;84:2592-2605.
6. Lee D, Yoo J, Ye JC. Deep residual learning for compressed sensing MRI. 2017 IEEE 14th International Symposium on Biomedical Imaging (ISBI 2017), pp. 15–18, 2017.
7. Han Y, Yoo J, Kim HH, et al. Deep learning with domain adaptation for accelerated projection-reconstruction MR. Magn Reson Med. 2018;80:1189-1205.
8. Schlemper J, Caballero J, Hajnal JV, et al. A deep cascade of convolutional neural networks for MR image reconstruction. International Conference on Information Processing in Medical Imaging, pp. 647–658, 2017.
9. Goldfarb JW, Craft J, Cao JJ. Water–fat separation and parameter mapping in cardiac MRI via deep learning with a convolutional neural network. J Magn Reson Imaging. 2019;50:655-665.
10. Andersson J, Ahlstrom H, Kullberg J. Separation of water and fat signal in whole-body gradient echo scans using convolutional neural networks. Magn Reson Med. 2019;82:1177-1186
11. Cho J, Park H. Robust water–fat separation for multi-echo gradient-recalled echo sequence using convolutional neural network. Magn Reson Med. 2019;82:476-484.
12. Hernando D, Kellman P, Haldar JP, et al. Robust water/fat separation in the presence of large field inhomogeneities using a graph cut algorithm. Magn Reson Med. 2010;63:79-90.
13. Cui C, Wu X, Newell JD, et al. Fat water decomposition using globally optimal surface estimation (GOOSE) algorithm. Magn Reson Med. 2015;73:1289-1299.
14. Kendall A, Gal Y. What uncertainties do we need in Bayesian deep learning for computer vision? Advances in Neural Information Processing Systems, pp.5574–5584, 2017.
15. Armstrong T, Dregely I, Stemmer A, et al. Free-breathing liver fat quantification using a multiecho 3D stack-of-radial technique. Magn Reson Med. 2018;79:370-382.
16. Zhong X, Nickel MD, Kannengiesser SAR, et al. Liver fat quantification using a multi-step adaptive fitting approach with multi-echo GRE imaging. Magn Reson Med. 2014;72:1353-1365.
17. Shih S-F, Armstrong T, Kafali SG, et al. Rapid free-breathing volumetric liver fat and R2* quantification using soft-gating and sparsity-promoting tensor reconstruction. In: 28th Annual Meeting of ISMRM, 2020, pp. 330.
18. Ren J, Dimitrov I, Sherry AD, et al. Composition of adipose tis-sue and marrow fat in humans by 1H NMR at 7 Tesla. J Lipid Res. 2008;49:2055-2062.
Figures