3843
Fat Fraction Quantification in TSE based 2-point Dixon Acquisition: Application to Whole-body MRI1Radiology, UT Southwestern Medical Center, Dallas, TX, United States, 2Advanced Imaging Research Center, UT Southwestern Medical Center, Dallas, TX, United States, 3Philips, Dallas, TX, United States
Synopsis
Mapping fat fraction (FF) has been proposed as a biomarker of treatment response in multiple myeloma. Whole-body imaging using 2-point Dixon methods offer efficient acquisitions but may suffer from less accurate FF quantification than multi-echo Dixon. Using our previously developed whole-body MR sequence with 2-point turbo spin-echo (TSE) Dixon, we generated accurate FF maps using with a fat masking algorithm. Results from a fat-water phantom and in vivo images show that 2-point TSE-Dixon with the fat masking algorithm performed comparably to multi-echo Dixon, facilitating accurate FF maps in whole-body MRI.
Introduction
Quantitative fat fraction (FF) is an important imaging biomarker in several diseases such as non-alcoholic fatty liver disease1. Chemical shift-based fat/water separation methods, such as the Dixon method, have been developed to calculate FF based off the proton signal intensity of fat-only and water-only images. Specifically, multi-echo (or multi-point) Dixon methods (e.g., IDEAL-Quant, mDixon-Quant, Multi-echo Dixon VIBE, etc.) are used to account for the multiple peaks in the fat spectra and T2* decay, for accurate FF quantification.FF quantification has also shown clinical potential as a prognostic and predictive biomarker in other diseases such as multiple myeloma (MM)2, where the bone marrow is replaced by osteolytic lesions. Whole-body MRI, particularly using turbo spin echo (TSE) based acquisitions, is needed for the evaluation of MM due to its higher tumor conspicuity without exogenous contrast agent. We have developed an efficient whole-body MRI technique called DETECT, using single shot TSE (SShTSE) based 2-point Dixon acquisition that achieved robust image quality3. The purpose of this work was to use DETECT for efficient FF quantification, applicable to whole-body MRI.
Theory
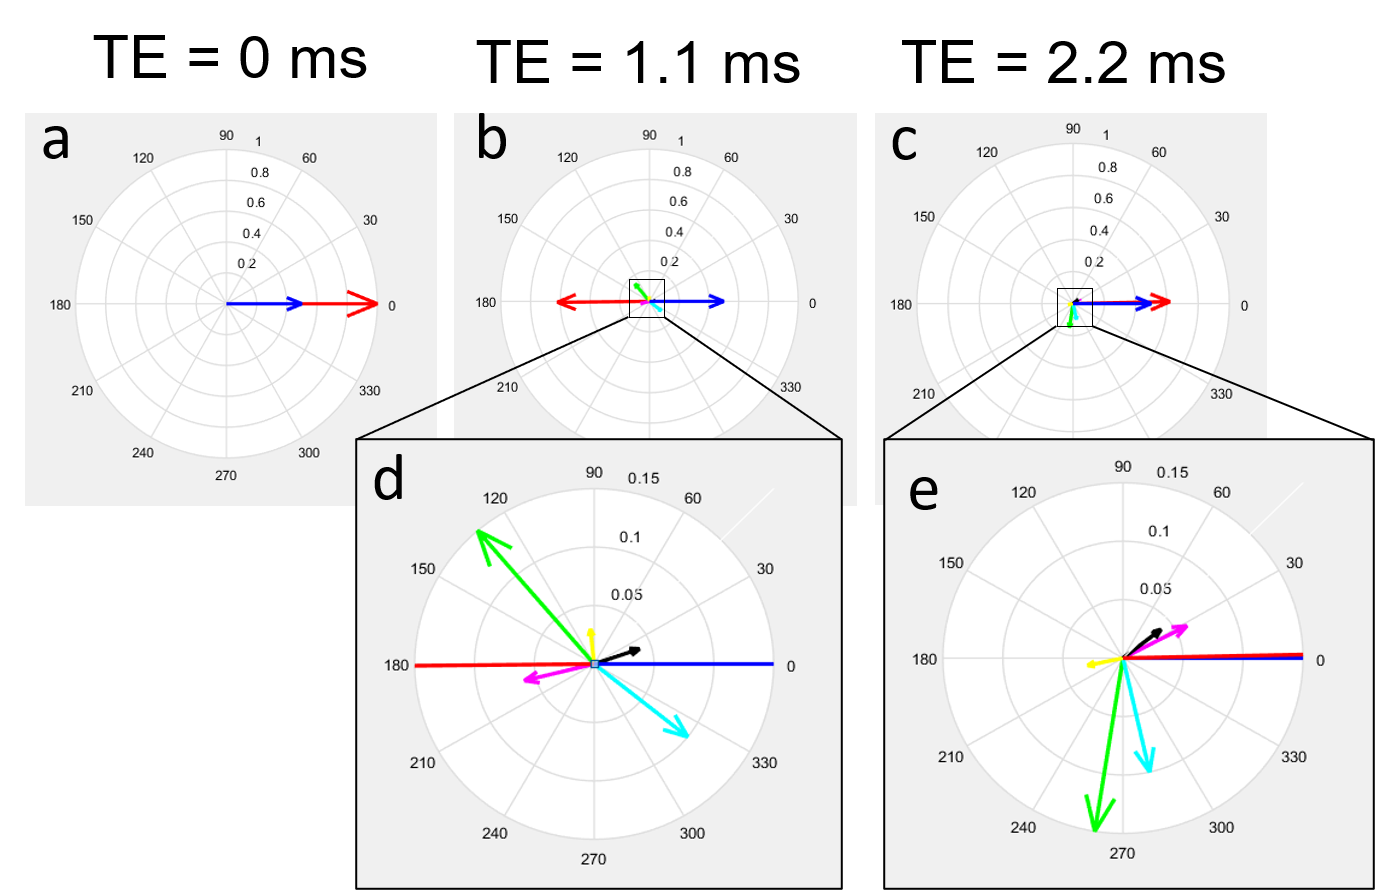
The acquisition of only two echoes is more time efficient for whole-body MRI, however, accurate FF quantification is challenging due to insufficient information of the multiple fat spectrum species. This is further confounded in the 2-point fast field echo (FFE), since the out-of-phase (OP) and in-phase (IP) images are typically acquired at 1.1 ms and 2.2 ms respectively at 3T, which only account for the phase of the main fat peak (at 1.3 ppm) (Fig. 1b-c). Thus, the conventional single peak model for fat spectra generates water-only images contaminated with residual fat signal that provides “grey-fat” appearance (Fig. 2a). Although multi-peak fat spectra models (e.g., 7-peak) can be used for improved fat/water separation, it requires at least 3 echoes for mathematically robust fat/water separation4.Compared to FFE, IP images with TSE acquisitions are acquired when all different fat species are truly in phase (at gradient TE=0 between each refocusing pulse pair) (Fig. 1a). This allows for efficient FF quantification using only two echoes with TSE-Dixon.
Methods
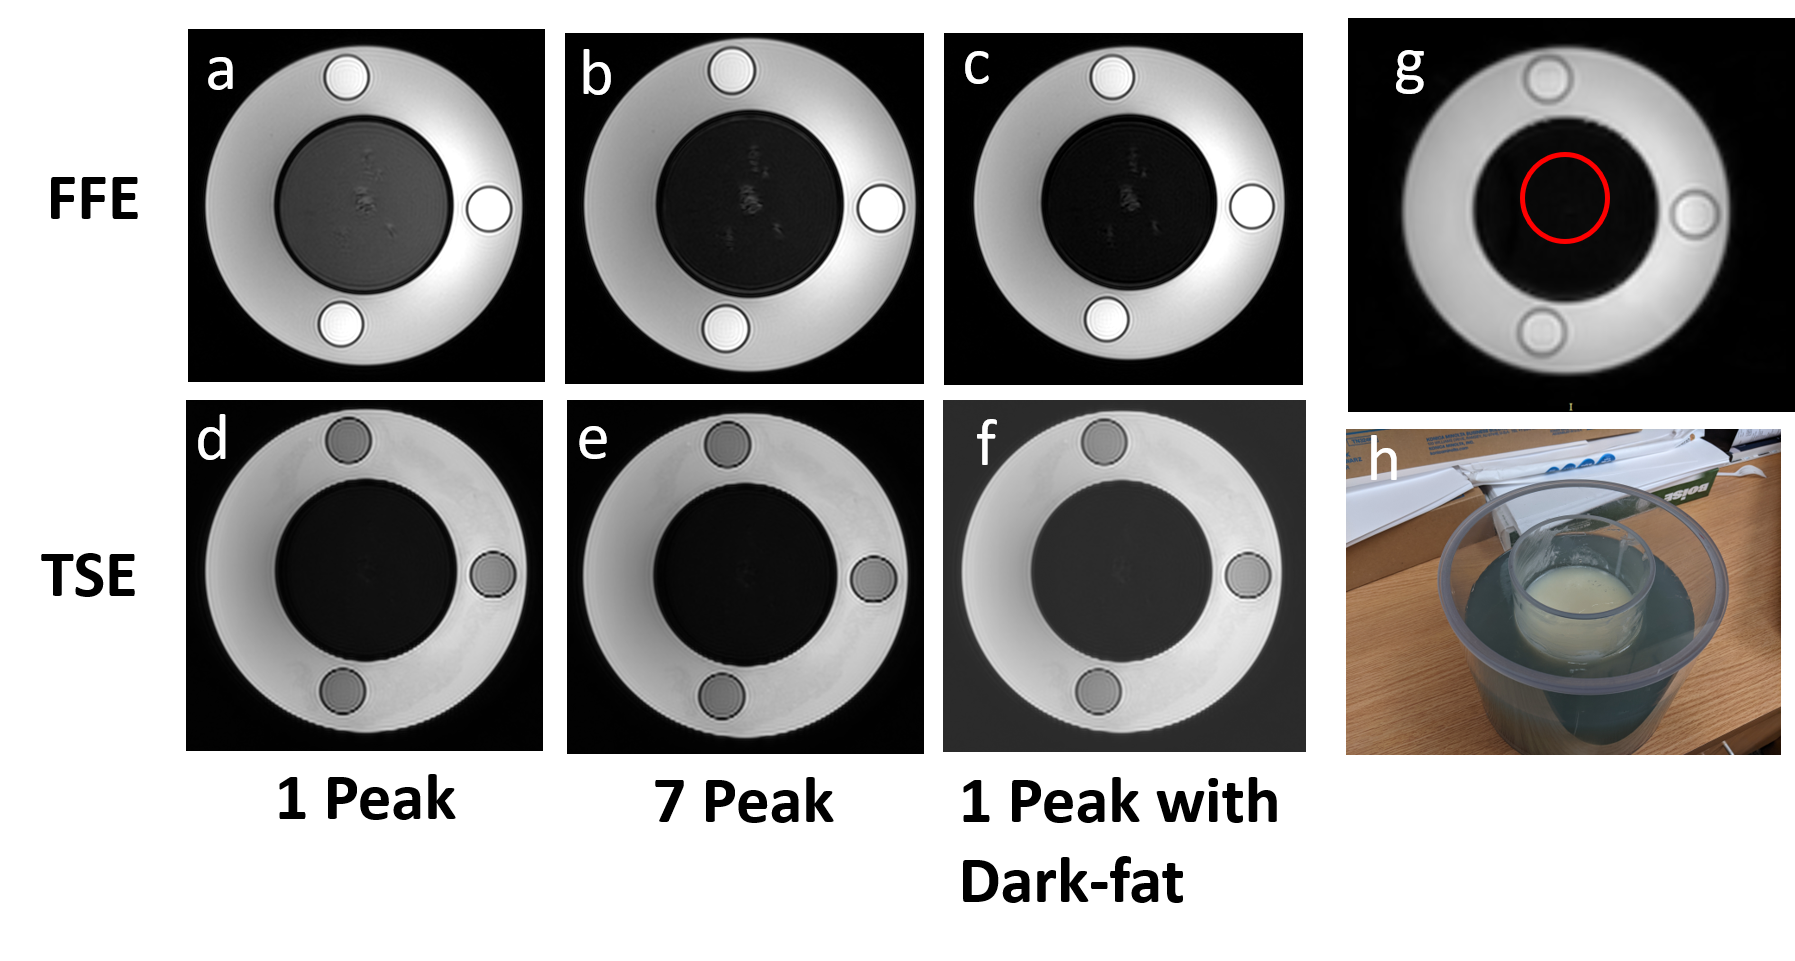
Fat-Water Phantom: A cylindrical fat-water phantom (Fig. 2h) was constructed with water and fat analogs in separate compartments. The middle compartment comprised of solidified vegetable shortening to provide lipid MR signal. For reusability, the outer compartment contained a solid water analog1 which consisted of 43 mM sodium chloride, 3 mM sodium benzoate, 1.0 mM copper sulfate, and 2.0% w/v agar in deionized water. In addition, three vials of agarose were embedded in the agar gel.MR Imaging: All MR imaging was done on a 3T Ingenia scanner (Philips Healthcare). We scanned the fat-water phantom and two normal volunteers’ pelvis (with IRB approval) using: 2D T2-weighted 2-point TSE-Dixon, 2D T1-weighted 2-point FFE-Dixon, and 3D T1-weighted multi-echo FFE (mDixon-Quant). The imaging parameters for the phantom were: TSE-Dixon: TR/TE=3000/80 ms, ΔTE=1.1 ms, FOV=250x250x150 mm3, acquired resolution=1x1x5 mm3, 22 slices, ETL=15, total acquisition time=4:24 min; with similar parameters for 2-echo FFE-Dixon except: TR/TE1/TE2=320/2.1/3.8 ms, total acquisition time=1:49 min; 3D mDixon-Quant: TR/TE1/∆TE=5.7/0.97/0.7 ms, 6-echoes, acquired resolution=2.5x2.5x6 mm3, 60 slices, total acquisition time=16 seconds. TSE, FFE, and mDixon-Quant scans were each repeated three times. The volunteers were scanned once using similar parameters.
One patient who underwent whole-body MRI using DETECT for metastatic cancer detection (under IRB approval) was also processed.
Fat-Fraction Calculations: Dixon reconstruction for the TSE and FFE images were completed using a single-peak fat model and a 7-peak fat model. Fat/water separated images from the single-peak model were also processed using a “dark-fat” algorithm5. This method estimated the residual fat signals in the water-only images from the single-peak fat/water separated images. This residual fat signal was then subtracted from the water-only images to generate “dark-fat” water-only images. FF was then calculated using the equation $$$\frac{F}{W+F}$$$, where F is the fat-only signal and W is the water-only signal from Dixon reconstruction. mDixon-Quant generated FF maps using a 6-point acquisition and a 7-peak fat spectra model was used as the ground truth.
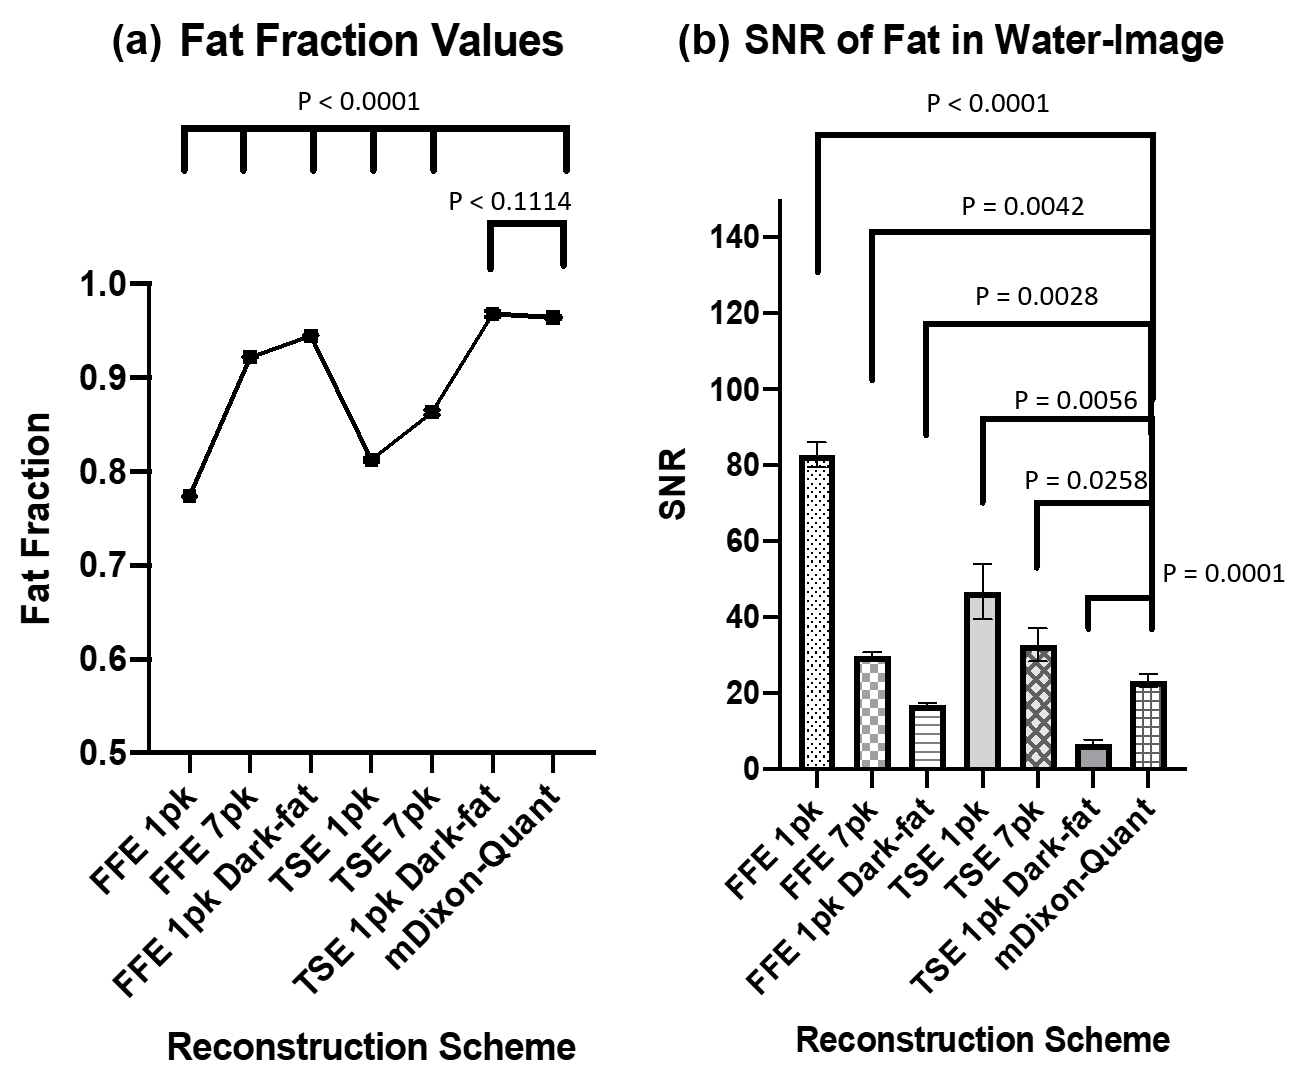
Image Analysis: FF values and the SNR using a difference method6 in the same region of interest (ROI) (Fig. 2g) was compared between different reconstruction methods across three repeated measurements. Each reconstruction method was compared with mDixon-Quant using a 2-tailed unpaired t-test.
Results
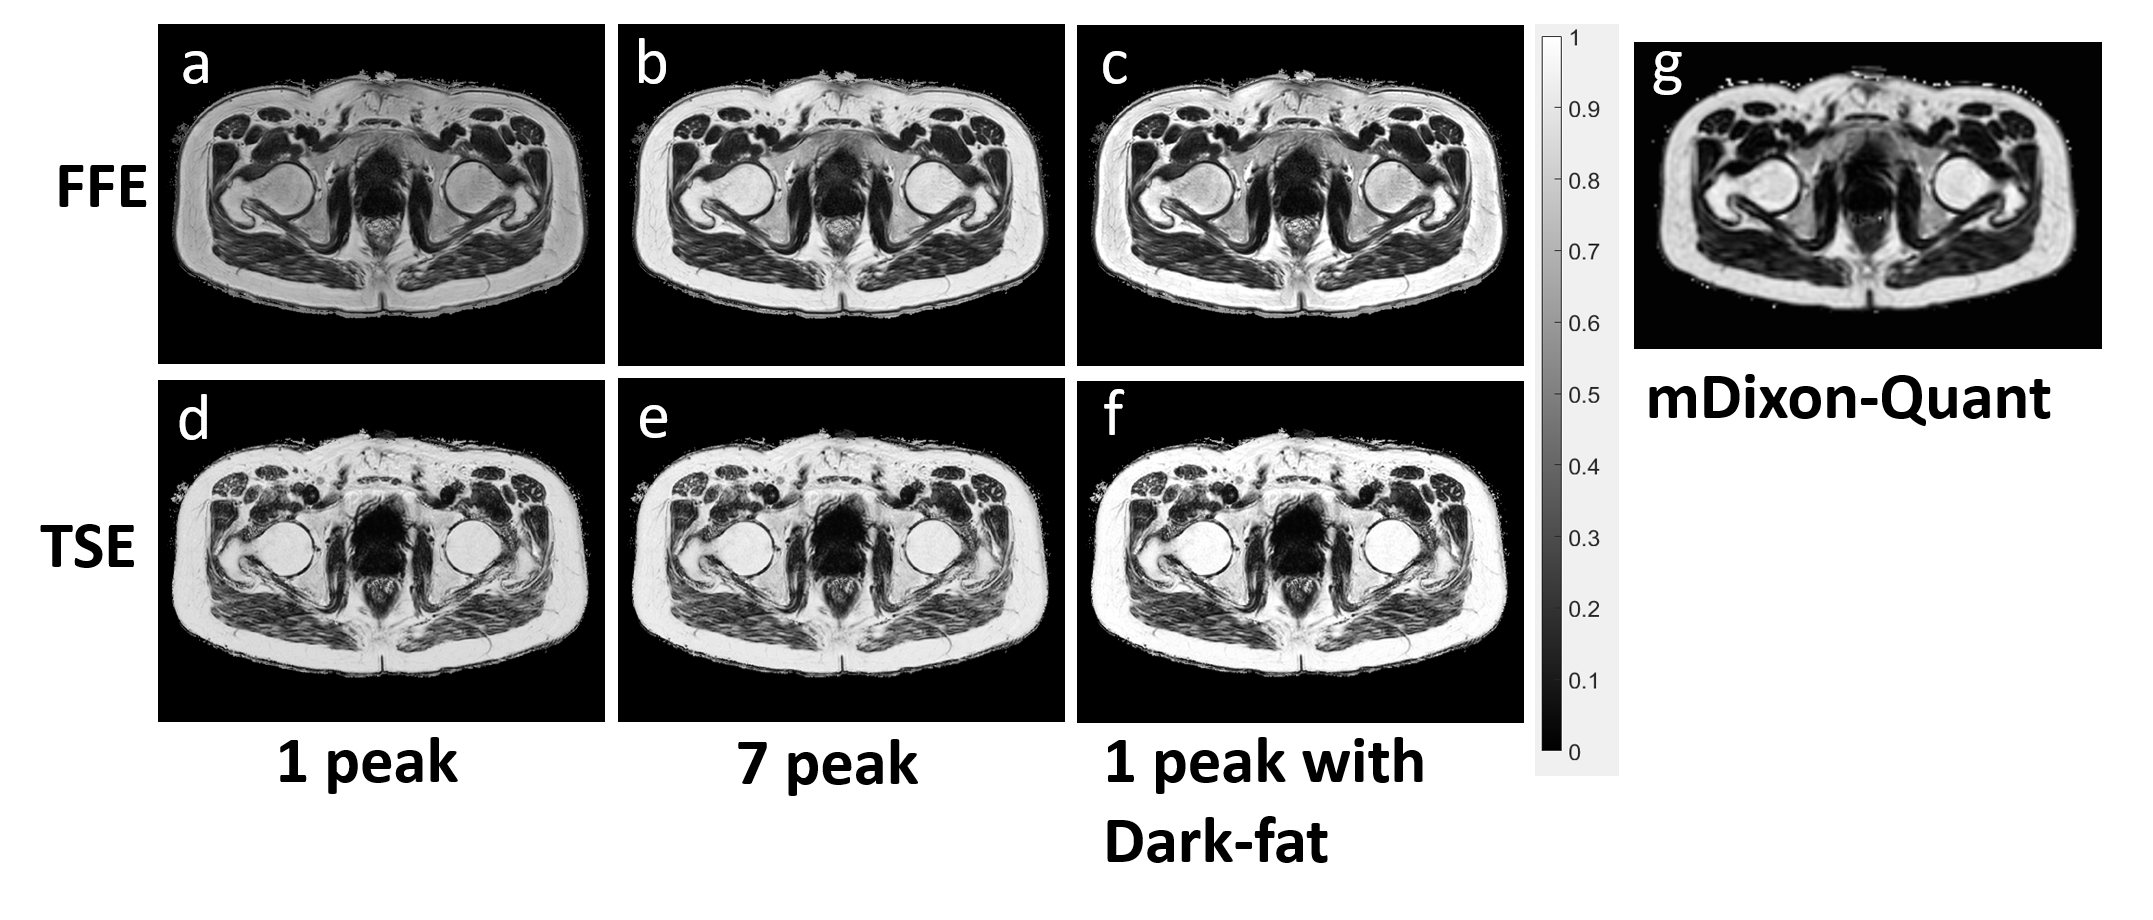
The water-only phantom images showed that 7-peak and 1-peak with dark-fat reconstruction reduced fat signal in the water-only images compared to 1-peak reconstruction (Fig. 2). Statistical analysis (Fig. 3a) showed a significant difference (p<0.0001) between mDixon-Quant and all reconstruction methods except for TSE-Dixon 1-peak reconstruction with dark-fat processing (p=0.1114). In vivo FF maps showed similar results (Fig. 4). SNR measurements of the water-only images reveal a significant difference between mDixon-Quant and all reconstruction methods (Fig. 3b), although TSE-Dixon 1-peak reconstruction with dark-fat had the lowest SNR, showing efficient fat suppression.Discussion and Conclusion
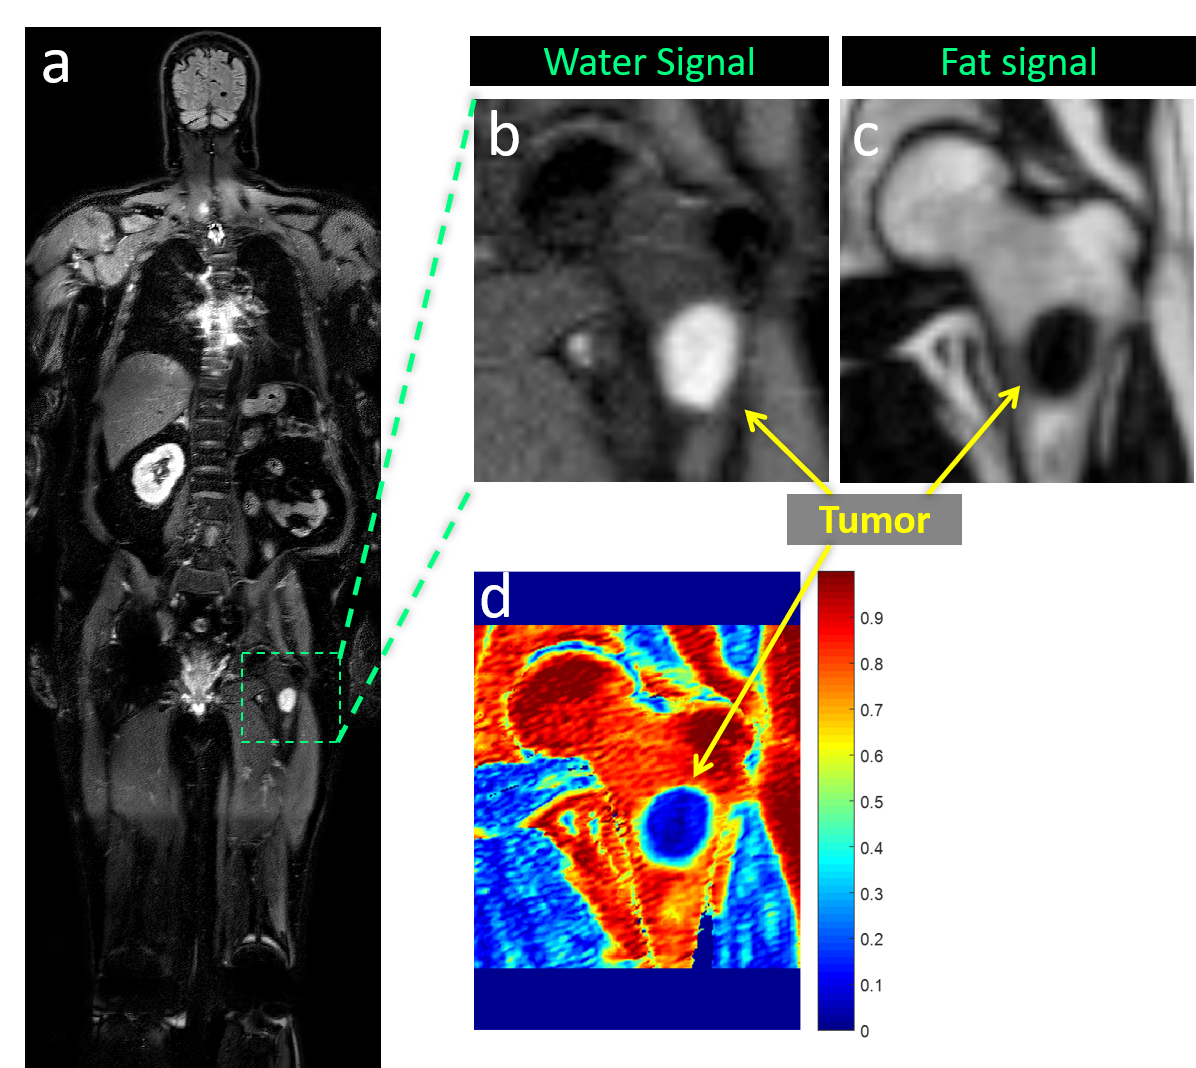
The acquisition of IP images with TSE-Dixon with all fat species in phase (at spin-echo generation between each refocusing pulse pair) enables accurate FF quantification using only two echoes. This further facilitates FF quantification in whole-body MRI using DETECT (Fig. 5). This method will be used to accurately quantify FF for therapy response assessment in the ongoing MM study using whole-body MRI.Acknowledgements
This work was partly supported by the Cancer Prevention and Research Institute of Texas (CPRIT) grant, RP190049.References
1. Pickhardt PJ, Graffy PM, Reeder SB, Hernando D, Li K. Quantification of Liver Fat Content With Unenhanced MDCT: Phantom and Clinical Correlation With MRI Proton Density Fat Fraction. Am J Roentgenol. 2018;211(3):W151-W157.
2. Latifoltojar A, Hall-Craggs M, Bainbridge A, et al. Whole-body MRI quantitative biomarkers are associated significantly with treatment response in patients with newly diagnosed symptomatic multiple myeloma following bortezomib induction. Eur Radiol. 2017;27(12):5325-5336.
3. Wang X, Pirasteh A, Brugarolas J, et al. Whole-body MRI for metastatic cancer detection using T2-weighted imaging with fat and fluid suppression. Magn Reson Med. 2018;80(4):1402-1415.
4. Yu H, Shimakawa A, McKenzie CA, Brodsky E, Brittain JH, Reeder SB. Multi-Echo Water-Fat Separation and Simultaneous R2* Estimation with Multi-Frequency Fat Spectrum Modeling. Magn Reson Med. 2008;60(5):1122-1134.
5. Madhuranthakam AJ, Yu H, Alsop DC. System and method for fat suppression in chemical shift based water-fat separated MR imaging. U.S. Patent No. 8,587,305. 19 Nov. 2013:12.
6. Dietrich O, Raya JG, Reeder SB, Reiser MF, Schoenberg SO. Measurement of signal-to-noise ratios in MR images: Influence of multichannel coils, parallel imaging, and reconstruction filters. J Magn Reson Imaging. 2007;26(2):375-385.
Figures