3842
Evaluation of mDIXON Quant imaging in the assessment of disease activity in Thyroid-associated Ophthalmopathy(TAO)1People’s Hospital of Fuyang, Fuyang, China, 2People’s Hospital of Ningxia Hui Autonomous Region, Yinchuan, China, 3Philips Healthcare, Beijing, China
Synopsis
To prospectively study the changes of adipose content, adipose tissue edema and fibrosis in the orbit of Thyroid-associated ophthalmopathy (TAO) by mDixon-Quant imaging and investigate their application to TAO activity assessment. The result showed T2* values may be a promising marker for assessing the activity of TAO.
Synopsis
To prospectively study the changes of adipose content, adipose tissue edema and fibrosis in the orbit of Thyroid-associated ophthalmopathy (TAO) by mDixon-Quant imaging and investigate their application to TAO activity assessment. The result showed T2* values may be a promising marker for assessing the activity of TAO.Introduction
Thyroid-associated ophthalmopathy (TAO) is an endocrine-related immunological disease with substantial morbidity. The main clinical symptoms of TAO are eyelid retraction, exophthalmos, restrictive extraocular myopathy, diplopia, etc. Several cases can result in visual loss. According to the severity of the disease, TAO can be divided into active and inactive stage.1 Different stages of TAO have different degree of adipose cells increasing, even becoming adipose tissue fibrosis. Therefore, diagnosing the stage of TAO is important to adopt appropriately clinical treatment. Clinical activity score (CAS) is the most commonly used to assess the activity of TAO in clinical practice.2 However, some studies have shown that CAS dependent on the examiner and inadequate for following clinical changes. Recently, mDIXON-Quant, as a new magnetic resonance technology being developed, enables and reproducible quantification of adipose deposition. This technology called mDIXON Quant on Philips scanner and it acquires 6 echoes at a time, and T2* correction ensures the accuracy of adipose quantification, and 7 peaks of fat model separate water and fat signals to ensures the reliability and accuracy of fat-water separation improving the accuracy of quantitative adipose measurement comparing with other measures. 3,4PURPOSE
To prospectively study the changes of adipose content, adipose tissue edema and fibrosis in the orbit of Thyroid-associated ophthalmopathy (TAO) by mDixon-Quant imaging and investigate their application to TAO activity assessment.METHODS
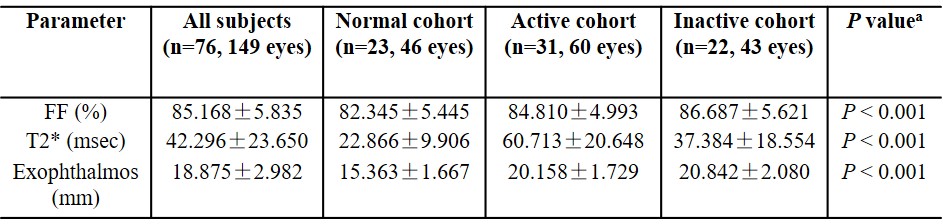
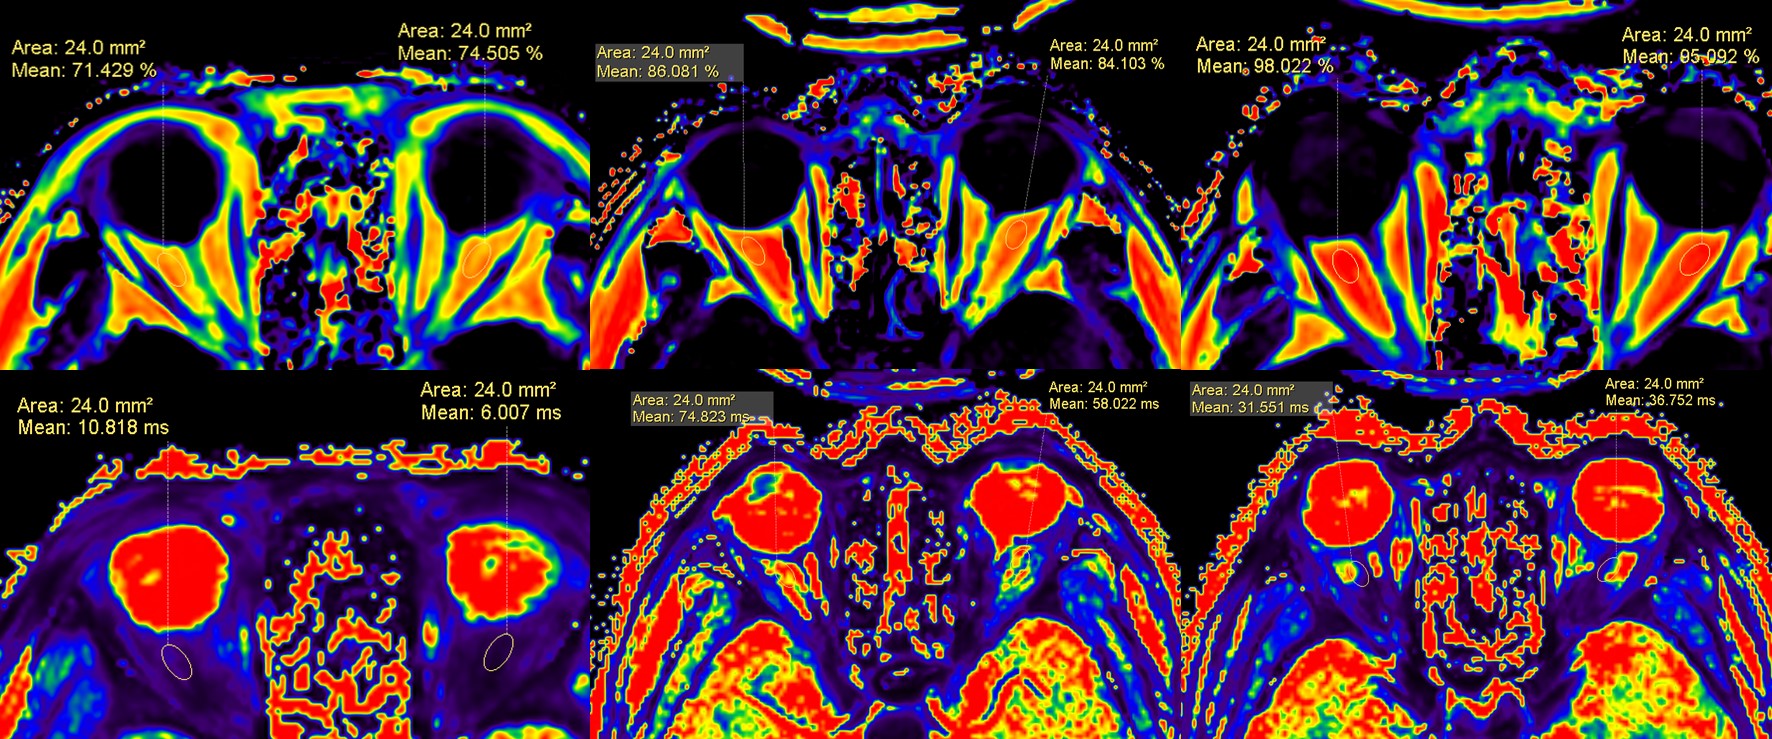
53 patients (103 eyes) with TAO and 23 normal cohort (46 eyes) were as the control. TAO patients were assigned into activity cohort (60 eyes, CAS≥3) and inactivity cohort (43 eyes, CAS<3) according to the clinical activity score (CAS) . All subjects scanned by orbital mDIXON Quant and T2WI+STIR (Philips Ingenia 3.0T). Then, fat fraction (FF) values, T2* values and degree of exophthalmos were measured on fat mapping, T2* mapping and T2WI+STIR sequence respectively. FF value, T2* value and degree of exophthalmos were analyzed by one-way ANOVA and variance similar test, when significance is observed, least significant difference (LSD) was used for paired comparison. The correlation of FF values and T2* values with CAS was conducted by Spearman rank correlation analysis in TAO patients. The efficiency of FF values, T2* values and FF + T2* values in evaluating TAO activity was determined by receiver operating characteristics (ROC) and Logistic regression.RESULTS
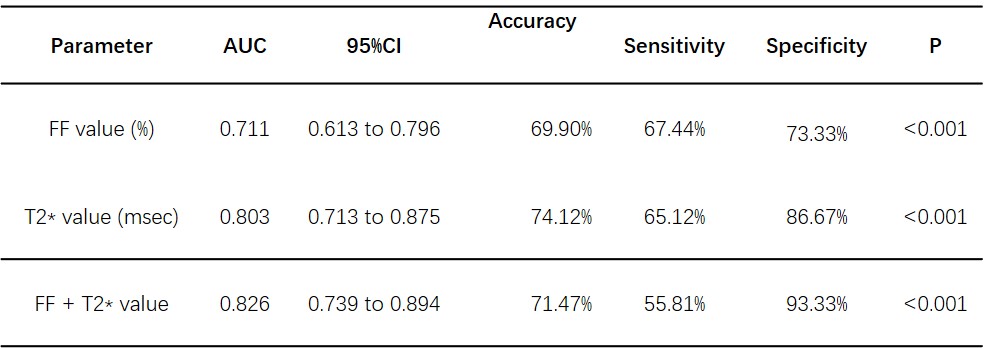
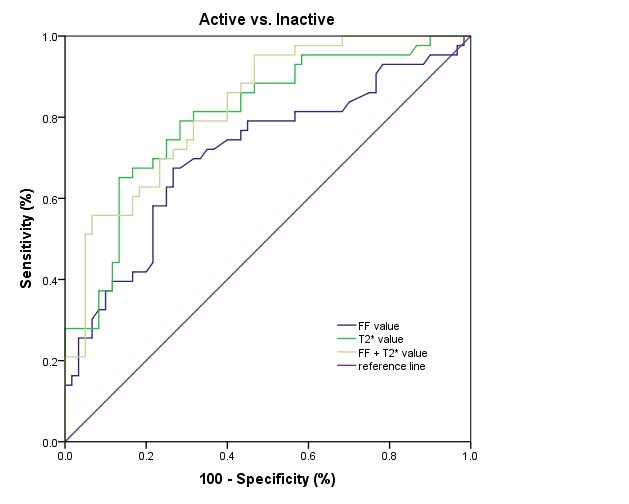
There were no significant difference of sex, age, and body mass index (BMI) among normal, active and inactive cohort. There were statistical differences in FF value, T2* value and degree of exophthalmos among three cohort (P<0.001). There were statistical differences in FF and T2* values between normal and active cohort (both P<0.001), normal and inactive cohort (both P<0.001), active and inactive cohort (both P<0.05)( TABLE 1)(FIGURE 1). Spearman correlation coefficients revealed a moderate negative correlation between FF values and CAS (r = -0.625, P<0.001), a strong positive correlation between T2* values and CAS (r=0.743, P<0.001), and a strong negative correlation between FF value and T2* value (r = -0.182, P>0.05). The AUC of FF values for TAO activity was 0.711, 95%CI was 0.613 to 0.796 (P<0.001), The AUC of T2* values for TAO activity was 0.803, 95%CI was 0.713 to 0.875 (P<0.001). The AUC of FF+T2* values for TAO activity was 0.826, 95%CI was 0.739 to 0.894 (P<0.005) (TABLE 2)(FIGURE 2).CONCLUSION
The combination of adipose content and T2* values may be a promising marker for assessing the activity of TAO.Acknowledgements
No acknowledgement found.References
1. Eckstein A, Quadbeck B, Mueller G, Rettenmeier AW, Hoermann R, Mann K, Steuhl P, Esser J. Impact of smoking on the response to treatment of thyroid associated ophthalmopathy. Br J Ophthalmol. 2003;87:773-776.
2. Mourits, M. P., Prummel, M. F., Wiersinga, W. M. & Koornneef, L. Clinical activity score as a guide in the management of patients with Graves’ ophthalmopathy. Clin. Endocrinol. (Oxf.) 47, 9–14 (1997)
3. Ligabue G, Besutti G, Scaglioni R, Stentarelli C, Guaraldi G. MR quantitative biomarkers of non-alcoholic fatty liver disease: technical evolutions and future trends. Quant Imaging Med Surg 2013; 3: 192–5.
4. Kise Y, Chikui T, Yamashita Y, et al. Clinical usefulness of the mDIXON quant the method for estimation of the salivary gland fat fraction: comparison with MR spectroscopy. Br J Radiol. 2017;90:20160704.
Figures