3841
Noninvasive in vivo assessment of liver fat on a mouse model of diet-induced fatty liver disease using 3-Tesla MRI.1NYU Grossman School of Medicine, New York, NY, United States
Synopsis
Nonalcoholic fatty liver disease (NAFLD) is the most common cause of liver disease in the Western The development of preclinical mouse models is essential in the development of virtual biopsy protocols to assess the essential features of NAFLD. In this report we have examined the feasibility of visualizing and mapping the fat fraction in mice under 2 high fat diets and one control diet using a preclinical 3-Tesla MRI with a RARE-Dixon sequence. We show that at 3T fat and water can be separated and percentage maps show a 23% and 39% increase in liver fat over the control mouse.
Introduction
Non-alcoholic steatohepatitis (NASH) is the most severe form of non-alcoholic fatty liver disease that is life-threatening. NASH patients show symptoms at a very advanced stage when irreversible damage has occurred. Efforts have been devoted to develop non-invasive imaging protocols to diagnose and monitor the evolution of the disease as the definite diagnosis can only confirmed from liver biopsy [1]. Equally important is the need of noninvasive imaging to quantify fat content in small animal models used to study this disease [2-3]. In this preliminary study, we investigated whether a cryogen-free 3-Tesla could resolve anatomically abdominal mouse organs and effectively map their apparent fat fraction. Our work examined the sensitivity and the overall performance of the Dixon method [4] on three mouse cohorts subjected to three different diet regimens (normal chow, NASH and fat diet). Our results show that despite the lower sensitivity at 3-Tesla, our MRI protocol can clearly differentiate with less than 20% the apparent fat fraction (aFF) between cohorts with a 300-µm in plane resolution throughout the mouse abdomen.Methods
Mouse models: 15 mice were subjected to either of three diet regimens (5 in each group): (a) Low Fat Diet, a standard rodent chow [PicoLab Rodent Diet 20], (b) High Fat diet [Research Diets D12492i], (c) FPC (Fructose - Palmitate – Cholesterol) diet (NASH Diet) [Envigo TD190142] supplemented with High Fructose Corn Syrup. Mouse groups were subjected during 12 weeks to either standard chow or high fat diet before being scanned. On the other hand, NASH mice were subjected to 16 weeks of diet.MRI imaging protocol: All the imaging was performed a Bruker Biospec 3-T with a cryogen-free magnet interfaced to an Avance Neo console (ParaVision 360) and a 40-mm quadrature birdcage rf coil to scan the mouse abdomen. A 2D multi-slice RARE configured for the Dixon method [4] was used to separate water protons from fat content (chemical shift: 3.7-ppm, delay 0.87-ms), TE=30-ms, TR=4-s, a rare factor of 8, 25-slices, 500-μm slice thick and 200-μm gap, 300-μm in plane resolution, acquisition= 10-minutes.
Liver Fat quantification: The apparent fat-fraction map was calculated as the ratio of the fat signal over the fat/water composite intensity. A color lookup table was generated by binning changes in 20% increment to display the fatty infiltration in the liver.
Results
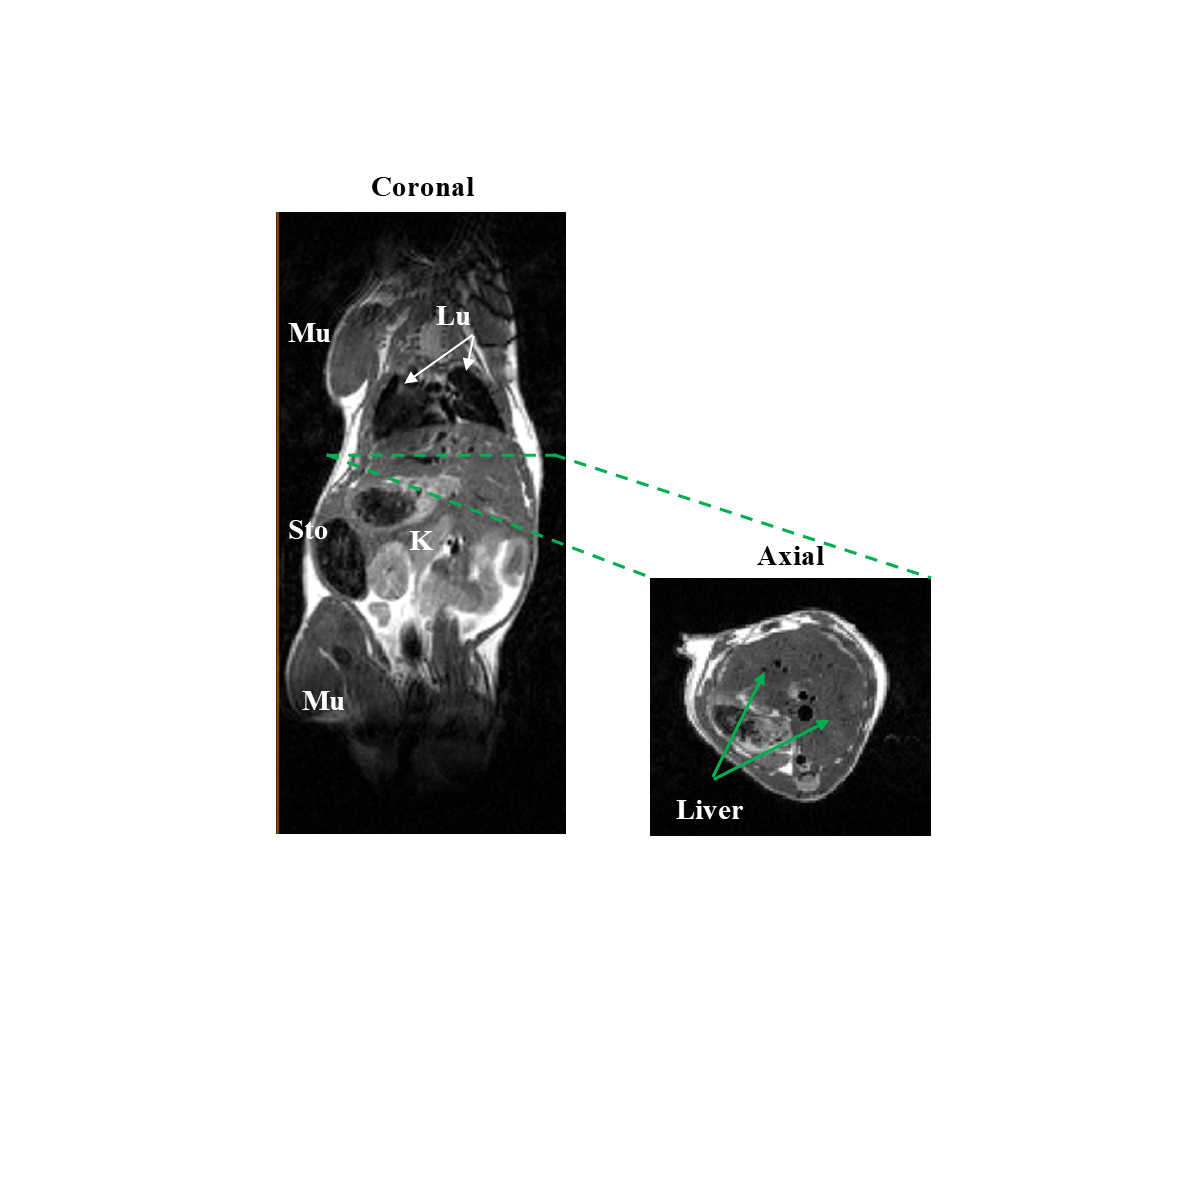
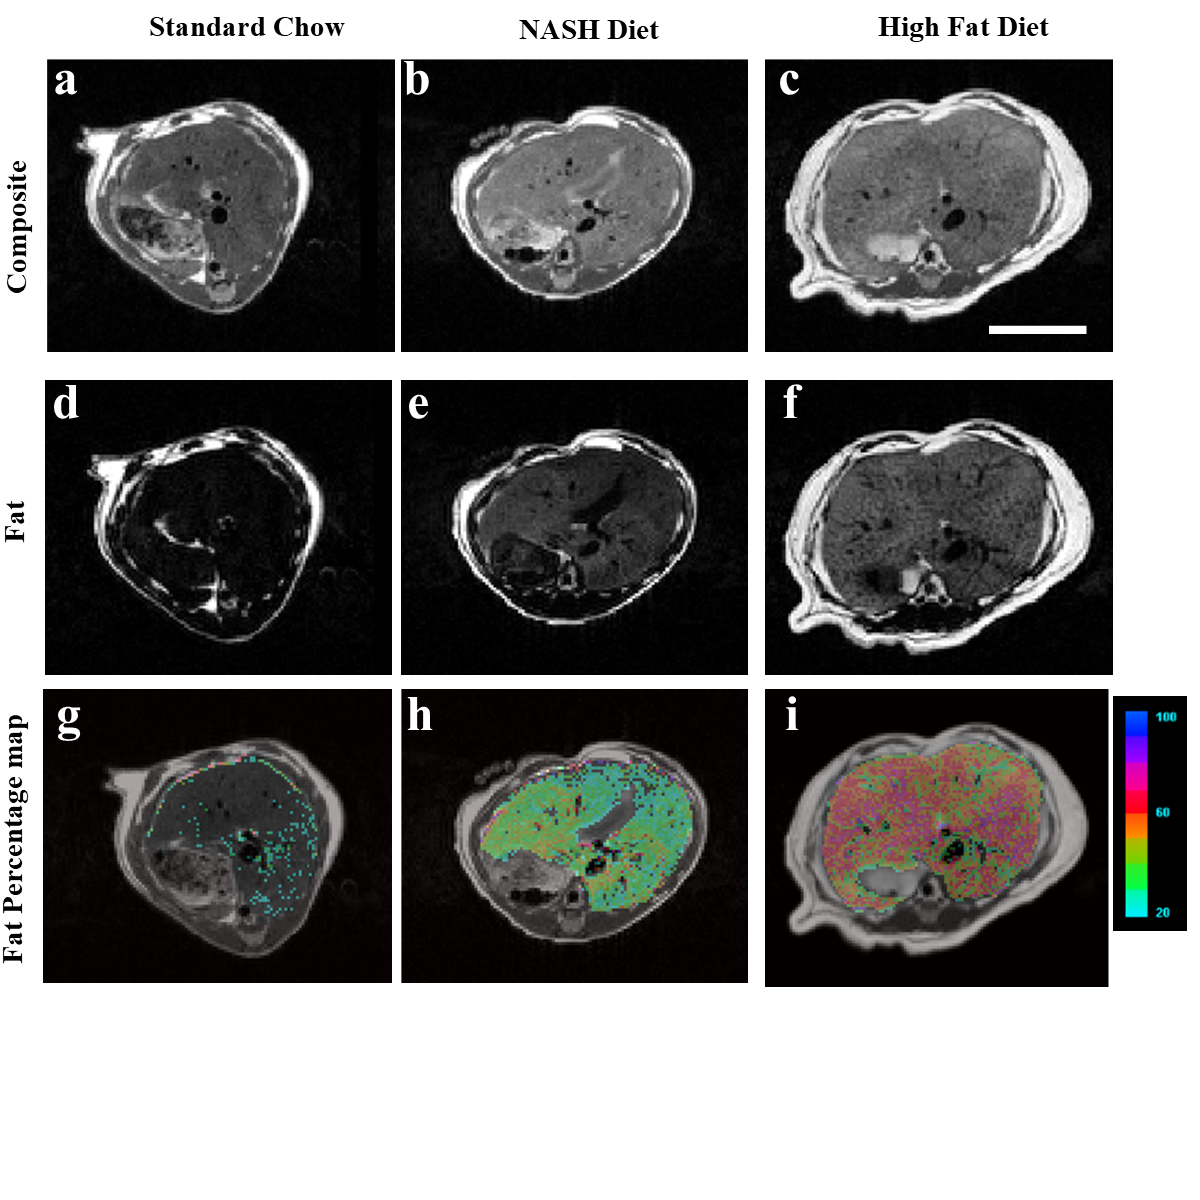
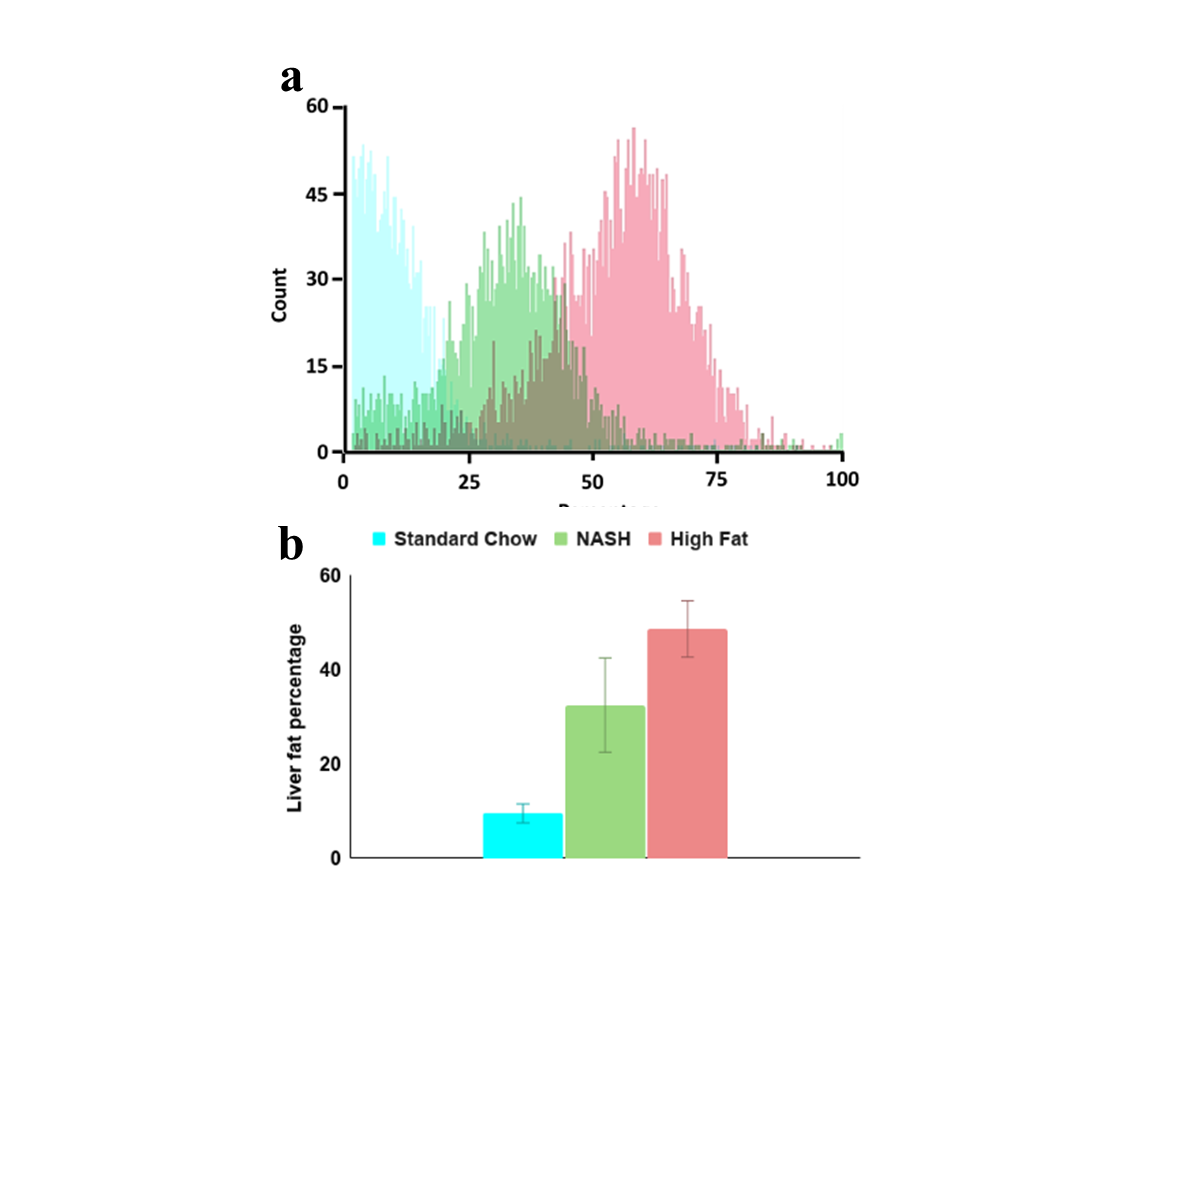
The high fat diet mice developed the obesity phenotype expected in this type of diet (50.1 ± 0.9 g). The mice on the NASH diet remained lean (28.4 ± 1.3 g) when compared to the control mice on standard chow diet (28.7 ± 1.2 g) demonstrating the insidious nature of this diet. Figure 1 illustrates the excellent image quality achievable at 3-Tesla showing the major anatomical landmarks that can be easily identified on both the coronal (Fig. 1.A) and Axial orientations. The earlier orientation covers the majority of the mouse body. Fig. 2.A-C shows the apparent proton signal density combining the fat/water signal. Using the Dixon method [4] helps separate the water from the fat proton signals. Fig. 2.D-F shows the effect of each of the three regimens at the level of the liver. Specifically, an obvious difference in fat signal enhancement on the Iiver from both the NASH and high fat diet group when compared to mice under the standard chow. Fig. 2.G-I shows in the background an axial anatomic image inclusive of all protons with an color coded overlay of the aFF. An obvious differences in aFF can be seen between the three cohorts with an increase in the liver of the NASH that is further pronounced in the high fat diet. Figure 3.A is a histogram analysis color-coded by cohorts to illustrate the distinct differences due to the effect of the diets as well as their plotted values and standard deviations (Fig3.B). Despite the limited numbers of subjects examined so far (n=9), we observed an obvious difference in apparent fat fraction that is easily distinguishable visually and supported by the quantitative analysis suggesting the sensitivity of this protocol and setup.Discussion & Conclusion
Despite the limited number of subjects (n=9) so far examined, the obvious differences observed between the 3 cohorts clearly shows that the RARE-Dixon protocol implemented with this 3-Tesla small animal system can be effective in monitoring fat fractions with sensitivity below at least 20% of aFF. This clinically relevant field strength will help bridge the translational gap between mouse models and human disease. We are currently examining the rest of the cohorts and extending the study to explore the multi-point Dixon and the T2 relaxometry.Acknowledgements
This work was performed at the Preclinical imaging core; a shared resource partially supported by the NYUCI Center Support Grant, “NIH/NCI5P30CA016087”, the NIBIB Biomedical Technology Resource Center (NIH P41 EB017183) and by NIH grant UL1 TR00038 from the National Center for Advancing Translational Sciences (NCATS). NIH PPG 1P01HL131481
References
1. Hoy AM, McDonald N, Lennen RJ, Milanesi M, Herlihy AH, Kendall TJ, et al. Non-invasive assessment of liver disease in rats using multiparametric magnetic resonance imaging: a feasibility study. Biol Open. 2018;7. doi:10.1242/bio.033910
2. Hansen HH, Feigh M, Veidal SS, Rigbolt KT, Vrang N, Fosgerau K. Mouse models of nonalcoholic steatohepatitis in preclinical drug development. Drug Discovery Today. 2017. pp. 1707–1718. doi:10.1016/j.drudis.2017.06.007
3. Blizard G. A multiparametric MRI protocol for PDFF, ADC, T1 and T2: applications in the NAFLD and NASH disease spectrum evaluated using multiple mouse models. UC San Diego. 2020. Available: https://escholarship.org/uc/item/1xm5r2x5
4. Dixon WT. Simple proton spectroscopic imaging. Radiology. 1984. pp. 189–194. doi:10.1148/radiology.153.1.6089263
Figures