3840
The relationship between preperitoneal fat and liver and pancreatic steatosis1The First Affiliated Hospital of Dalian Medical University, Dalian, China, 2MR Research, Beijing, China
Synopsis
This study assessed the correlation between preperitoneal fat and hepatic and pancreatic steatosis. The results showed that hepatic FF and pancreatic FF were strongly associated with preperitoneal fat fraction and area. This plays an important role in our further understanding of fat distribution and ectopic fat deposition.
Synopsis
This study assessed the correlation between preperitoneal fat and hepatic and pancreatic steatosis. The results showed that hepatic FF and pancreatic FF were strongly associated with preperitoneal fat fraction and area. This plays an important role in our further understanding of fat distribution and ectopic fat deposition.Introduction
Previous studies have shown that hepatic and pancreatic steatosis are closely related to type 2 diabetes mellitus, hypertension, metabolic syndrome, and increased risk of cardiovascular diseases[1-2]. Preperitoneal fat compartment is another interesting fat compartment that has not been extensively studied.Purpose
To assess the relationship between preperitoneal fat and hepatic and pancreatic fat fraction.Methods
A total of 320 subjects (148 men and 172 women) were included in the study. In this study, the MRI scanner (GE Medical Systems, Inc, Waukesha, WI, USA) with an eight-channel phased-array body coil was used. IDEAL-IQ sequence parameters were as follows: TR/TE = 6.9 ms/3.0 ms, slice thickness of 10 mm, 200 KHZ bandwidth, FOV = 36 cm×36 cm, matrix = 256 ×160, flip angle = 3 °, NEX = 1, breath holding for less than 24 s. The images were processed using IDEAL Research software provided by the manufacturer to generate water-phase, fat-phase, in-phase, out-phase, along with R2* and FF maps. On the post-processing platform (Intellispace portal, ISP, Philips, Holland), the software algorithm defined the margins of the liver in three dimensions, and whole liver was semi-automatically traced on FF maps. If the margins needed tweaking, the operator made corrections; if margins were included within the contours of liver segmentation, the main portal vein, inferior vena cava, and the gallbladder were manually removed. Then liver was segmented, and the whole hepatic FF was automatically calculated (Fig 1A). This methodology was also used to measure pancreatic FF (Fig 1 B). Meanwhile, preperitoneal fat were traced, and preperitoneal FF and area were calculated (Fig 1 C). Preperitoneal fat was defined as the fat depot seen anteriorly from the anterior surface of the left lobe of the liver to the linea alba. The intraclass correlation coefficient (ICC) was used to check the consistency of the two observers. To assess the associations between preperitoneal fat and liver and pancreatic fat fraction were computed.Results
Patients’ clinical characteristics were shown in Table 1. Two-observer measurement consistency was great (ICC > 0.75) (Table 2). Hepatic FF and pancreatic FF were strongly associated with preperitoneal fat fraction and area (P<0.05) (Table 3).Conclusion
Hepatic FF and pancreatic FF were strongly associated with preperitoneal fat fraction and area.Discussion
This study assessed the correlation between preperitoneal fat and liver and pancreatic steatosis. The results showed that hepatic FF and pancreatic FF were strongly associated with preperitoneal fat fraction and area. Thus, increased preperitoneal fat area and FF could be used to identify patients at increased risk of more aggressive hepatic and pancreatic steatosis. This plays an important role in our further understanding of fat distribution and ectopic fat deposition.Acknowledgements
No acknowledgement found.References
1.Parente DB, Oliveira Neto JA, Brasil PEAA, et al. Preperitoneal fat as a non-invasive marker of increased risk of severe non-alcoholic fatty liver disease in patients with type 2 diabetes. J Gastroenterol Hepatol. 2018;33(2):511-517.
2.Shabestari AA, Bahrami-Motlagh H, Hosseinpanah F, et al. Abdominal fat sonographic measurement compared to anthropometric indices for predicting the presence of coronary artery disease. J Ultrasound Med. 2013;32(11):1957-65.
Figures
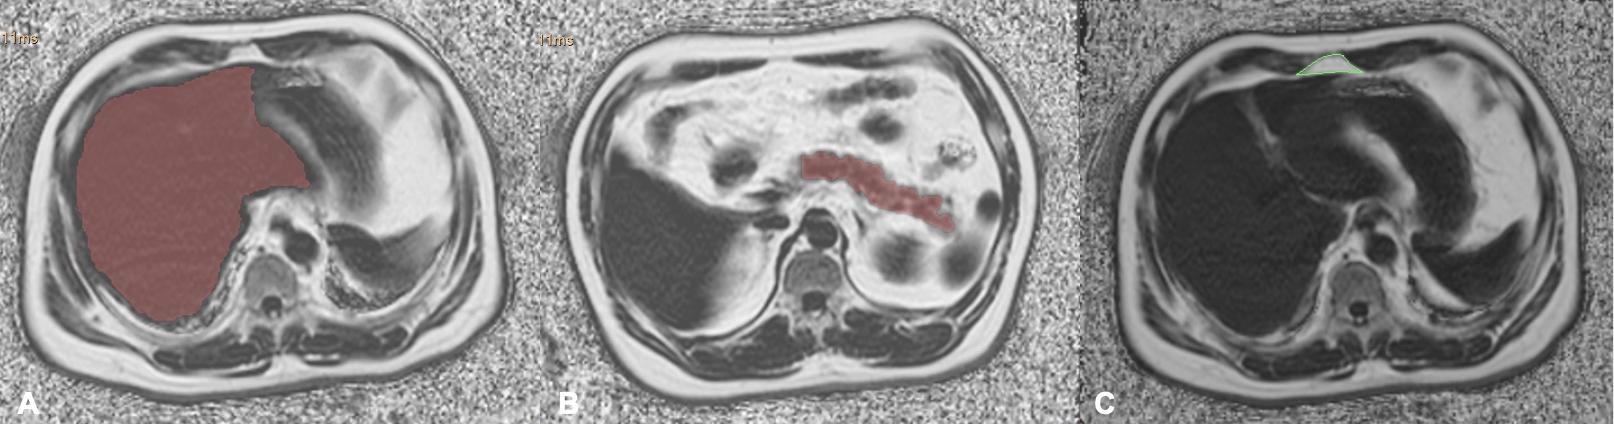
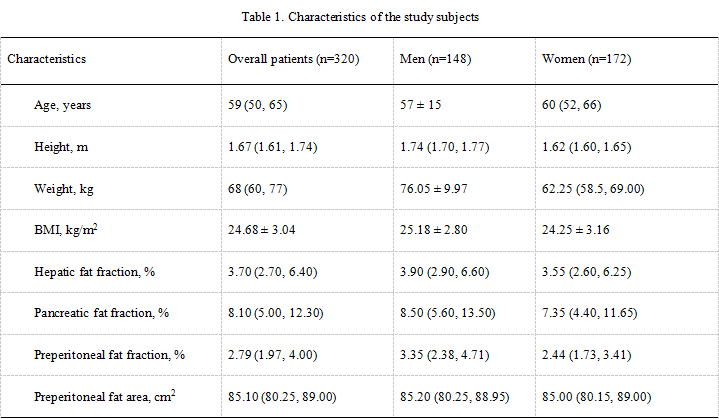
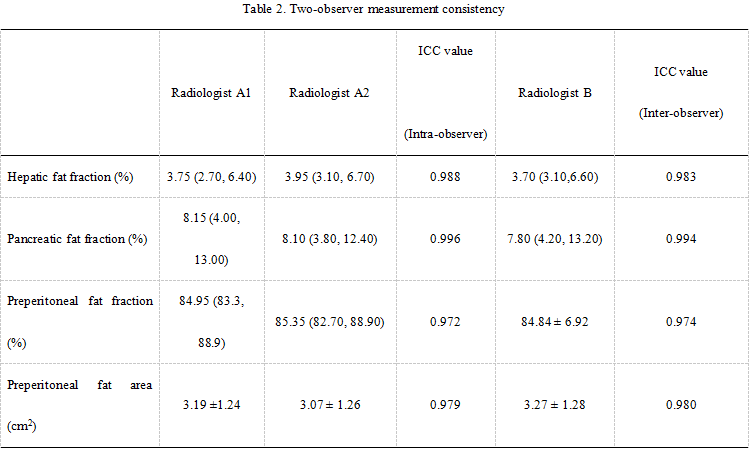
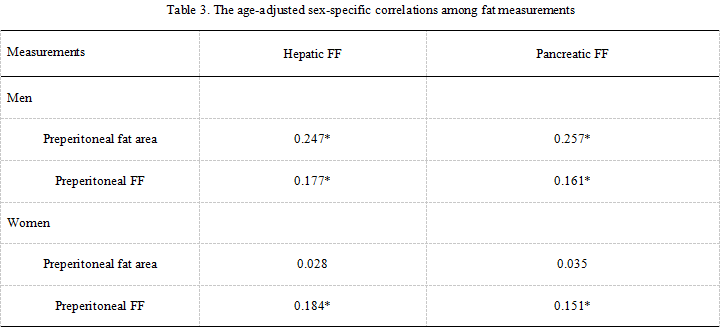
Table 3. The age-adjusted sex-specific correlations among fat measurements
*P<0.05, **P<0.001.